|
STATISTICAL BRIEF #269
December 2020
Lawrence D. Reid, Ph.D., M.P.H., and Kathryn R. Fingar, Ph.D., M.P.H. Introduction Each year in the United States, influenza infections result in substantial hospital use and mortality. In recent peak seasons characterized by more severe viral strains, such as 2014-2015, there were 851,000 emergency department (ED) visits, 223,000 hospitalizations, and 51,000 deaths.1,2 These statistics may be underestimates because they do not include influenza-like illnesses, such as bronchitis and viral pneumonia, which have clinically important flu-like signs and symptoms. Understanding patterns in hospital utilization for influenza and influenza-like illnesses, both hereafter referred to as ILI, is important to ensure hospitals have adequate capacity to respond to emerging influenza-related public health threats. This Healthcare Cost and Utilization Project (HCUP) Statistical Brief presents statistics on ILI-related ED visits from 2016 through 2018. The HCUP State Inpatient Databases (SID) were used to identify ED visits resulting in inpatient admission, and the State Emergency Department Databases (SEDD) were used to identify treat-and-release ED visits from 34 States and the District of Columbia. Three measures characterize ILI-related ED utilization: the population rate of ED visits involving ILI, the percentage of ILI-related ED visits resulting in inpatient admission, and the percentage of total ED visits involving ILI—a measure of the transmissibility and clinical severity of an influenza epidemic.3 First, monthly trends in ED visits involving ILI are shown. Second, the three metrics are examined across patient and community characteristics. Finally, State variation in the population rate of ILI-related ED visits is shown overall and by age, race/ethnicity, and location of residence. Race/ethnicity statistics are presented for a subset of 27 States with reliable data on race/ethnicity. Because of the large sample size of the SID and SEDD data, small differences can be statistically significant. Thus, only differences greater than or equal to 10 percent are discussed in the text. Findings Monthly trends in influenza and influenza-like illness (ILI)-related emergency department (ED) visits, 2016-2017 and 2017-2018 flu seasons Figure 1 presents monthly percentages of total ED visits with any-listed ILI diagnosis or a first-listed ILI diagnosis. These statistics are also provided for the 2016-2017 and 2017-2018 flu seasons combined. |
|
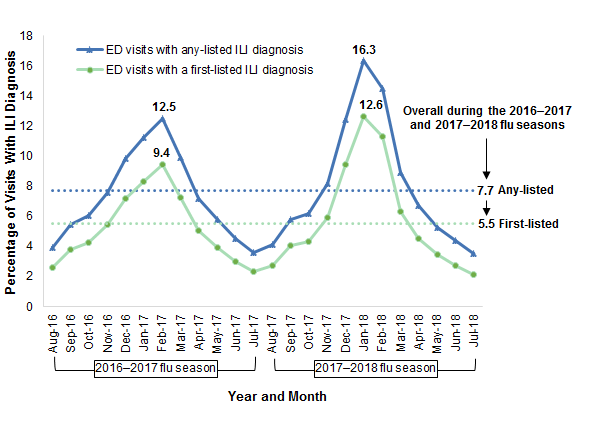
Figure 1. Percentage of total ED visits with an ILI diagnosis, August 2016-July 2018, 34 States and the District of Columbia
Abbreviations: ED, emergency department; ILI, influenza and influenza-like illness Figure 1 is a line graph that shows monthly percentages of total emergency department (ED) visits with any-listed influenza and influenza-like illness (ILI) diagnosis or a first-listed ILI diagnosis from August 2016 to July 2018 for 24 States and the District of Columbia. ED visits with any-listed ILI diagnosis: In August 2016, 3.9% of total ED visits had any-listed ILI diagnosis. This percentage steadily increased until reaching 12.5% in February 2017. From that point, the percentage steadily decreased to 3.6% in July 2017 and then increased steadily again until peaking at 16.3% in January 2018. The percentage decreased steadily through July 2018 (3.5%). ED visits with a first-listed ILI diagnosis: In August 2016, 2.6% of total ED visits had a first-listed ILI diagnosis. This percentage steadily increased until reaching 9.4% in February 2017. From that point, the percentage steadily decreased to 2.3% in July 2017 and then increased steadily again until peaking at 12.6% in January 2019. The percentage decreased steadily through July 2018 (2.1%). Overall, during the 2016-2017 and 2017-2018 flu seasons, 7.7% of ED visits had any-listed ILI diagnosis and 5.5% had a first-listed ILI diagnosis. |
Table 1 presents hospital utilization characteristics for ILI-related ED visits by patient and community characteristics for the 2016-2017 and 2017-2018 flu seasons combined. The same statistics for ED visits with no ILI diagnosis are shown for comparison. |
| Table 1. Disparities in ILI-related ED visits by patient and community characteristics, August 2016-July 2018, 34* States and the District of Columbia | |||||
| Characteristic | ILI-related ED visits | Total ED visits with or without ILI, N, millions§ | |||
|---|---|---|---|---|---|
| Total, N, millions,† | Population rate‡ | Of all ED visits, % | Admitted as inpatient from ED, % | ||
| Any ILI diagnosis | 17.0 | 3,346 | 7.7 | 21.5 | 220.9 |
| Flu season 2016-2017 | 8.1 | 3,183 | 7.3 | 21.6 | 110.5 |
| Flu season 2017-2018 | 8.9 | 3,508 | 8.1 | 21.3 | 110.4 |
| ILI diagnosis type | |||||
| Influenza only | 2.5 | 486 | 1.1 | 11.6 | 220.9 |
| Influenza-like illness only | 14.3 | 2,811 | 6.5 | 22.6 | 220.9 |
| Both | 0.2 | 49 | 0.1 | 55.8 | 220.9 |
| Age, years | |||||
| <18 | 6.0 | 5,178 | 14.1 | 4.4 | 42.5 |
| 18-64 | 7.2 | 2,304 | 5.4 | 17.0 | 134.9 |
| 65+ | 3.8 | 4,812 | 8.7 | 57.1 | 43.5 |
| Race/ethnicity* | |||||
| Asian/Pacific Islander | 0.3 | 1,051 | 7.0 | 22.6 | 4.1 |
| Black | 3.4 | 5,867 | 8.1 | 13.5 | 41.4 |
| Hispanic | 2.9 | 3,012 | 8.2 | 11.6 | 35.2 |
| White | 7.7 | 3,042 | 7.4 | 29.1 | 104.6 |
| Other | 0.6 | 4,905 | 7.5 | 15.0 | 8.4 |
| Primary expected payer | |||||
| Medicare | 4.4 | —§ | 8.5 | 53.2 | 52.1 |
| Medicaid | 6.9 | —§ | 9.6 | 8.7 | 71.6 |
| Private insurance | 3.6 | —§ | 5.9 | 13.9 | 61.5 |
| Self-pay/No charge| | 1.6 | —§ | 6.1 | 6.7 | 26.8 |
| Other | 0.4 | —§ | 4.9 | 17.4 | 8.5 |
| Location of residence | |||||
| Metro | 14.0 | 3,175 | 7.6 | 22.1 | 185.0 |
| Rural metro adjacent | 2.1 | 4,497 | 8.6 | 18.5 | 23.9 |
| Rural remote | 0.9 | 4,092 | 8.5 | 18.2 | 10.7 |
| Community income | |||||
| Quartile 1 (lowest) | 6.2 | 4,856 | 8.3 | 18.9 | 74.5 |
| Quartile 2 | 4.7 | 3,731 | 8.0 | 20.7 | 59.1 |
| Quartile 3 | 3.6 | 2,807 | 7.4 | 23.4 | 48.0 |
| Quartile 4 (highest) | 2.3 | 1,801 | 6.4 | 26.7 | 35.6 |
| Household overcrowding¶ | |||||
| Quartile 1 (lowest) | 0.6 | 2,653 | 7.2 | 26.5 | 8.9 |
| Quartile 2 | 3.9 | 2,863 | 7.4 | 25.1 | 52.3 |
| Quartile 3 | 5.5 | 3,502 | 7.8 | 21.8 | 70.4 |
| Quartile 4 (highest) | 6.9 | 3,619 | 7.9 | 18.7 | 88.3 |
| No ILI diagnosis | 203.9 | 40,106 | 92.3 | 13.3 | 220.9 |
| Abbreviations: ED, emergency department; ILI, influenza and influenza-like illness * Data come from 34 States and the District of Columbia for all statistics except race/ethnicity, for which data are from 27 States. † Denominator for the percentage of ED visits with an ILI diagnosis that were admitted to inpatient care from the ED. ‡ Population rate per 100,000. Population denominators are unavailable for payer. § Denominator for the percentage of all ED visits with an ILI diagnosis. | Self-pay/No charge: includes self-pay, no charge, charity, and no expected payment. ¶ Defined as the percentage of occupied households in the patient's ZIP Code of residence with more people than rooms. Sources: Agency for Healthcare Research and Quality (AHRQ), Healthcare Cost and Utilization Project (HCUP), State Inpatient Databases (SID) and State Emergency Department Databases (SEDD) for 34 States and the District of Columbia (all statistics except race/ethnicity) and for 27 States (for race/ethnicity), 2016-2018; U.S. Census Bureau's American Community Survey data for quartile designations of household overcrowding, 2016 five-year estimates | |||||
Figures 2 through 4 display the population rate of ILI-related ED visits by State, overall (Figure 2), by age (Figure 3), and by race/ethnicity (Figure 4). For Figure 2, States were ranked by their overall rate of ILI-related ED visits and categorized into quartiles. For Figure 3, quartile cut-offs were determined by ranking all State rates for all age groups. For Figure 4, quartile cut-offs were determined by a single ranking of all State rates for Black, Hispanic, and White individuals. |
|
Figure 2. Population rate of ILI-related ED visits by State, August 2016-July 2018, 34 States and the District of Columbia
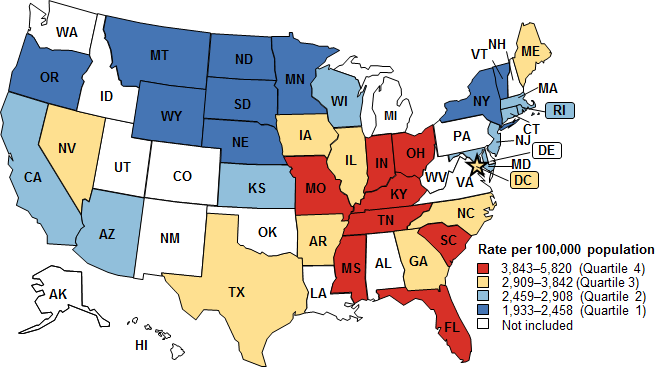
Abbreviations: ED, emergency department; ILI, influenza and influenza-like illness Figure 2 is a map that shows the overall population rate quartile of ILI-related ED visits by State from August 2016 to July 2018 for 34 States and the District of Columbia. Quartile 4 (3,843-5,820 per 100,000 population): Florida, Indiana, Kentucky, Mississippi, Missouri, Ohio, South Carolina, Tennessee. Quartile 3 (2,909-3,842 per 100,000 population): Arkansas, District of Columbia, Georgia, Illinois, Iowa, Maine, Nevada, North Carolina, Texas. Quartile 2 (2,459-2,908 per 100,000 population): Arizona, California, Connecticut, Kansas, Maryland, Massachusetts, New Jersey, Rhode Island, Wisconsin. Quartile 1 (1,933-2,458 per 100,000 population): Minnesota, Montana, Nebraska, New York, North Dakota, Oregon, South Dakota, Vermont, Wyoming. Not included: Alabama, Alaska, Colorado, Delaware, Hawaii, Idaho, Louisiana, Michigan, New Hampshire, New Mexico, Oklahoma, Pennsylvania, Utah, Virginia, Washington, West Virginia. |
|
|
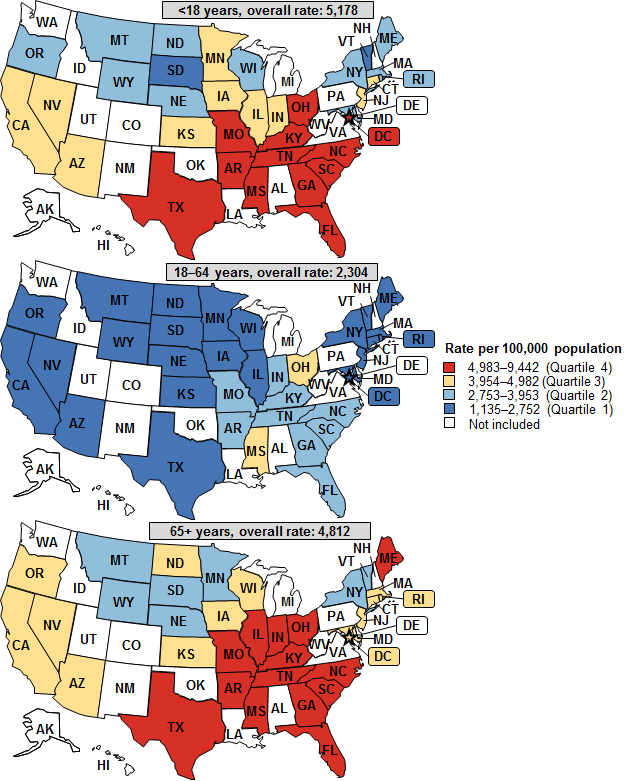
Figure 3. Population rates of ILI-related ED visits, by age group and State, August 2016-July 2018, 34 States and the District of Columbia
Abbreviations: ED, emergency department; ILI, influenza and influenza-like illness Figure 3 consists of three maps that show the population rate quartile of ILI-related ED visits by age group and State from August 2016 to July 2018 for 34 States and the District of Columbia. Quartile 4: 4,983-9,442; Quartile 3: 3,954-4,982; Quartile 2: 2,753-3,953; Quartile 1: 1,135-2,752. These States are not included: Alabama, Alaska, Colorado, Delaware, Hawaii, Idaho, Louisiana, Michigan, New Hampshire, New Mexico, Oklahoma, Pennsylvania, Utah, Virginia, Washington, West Virginia. Data are provided in Supplemental Table 1. |
|
|
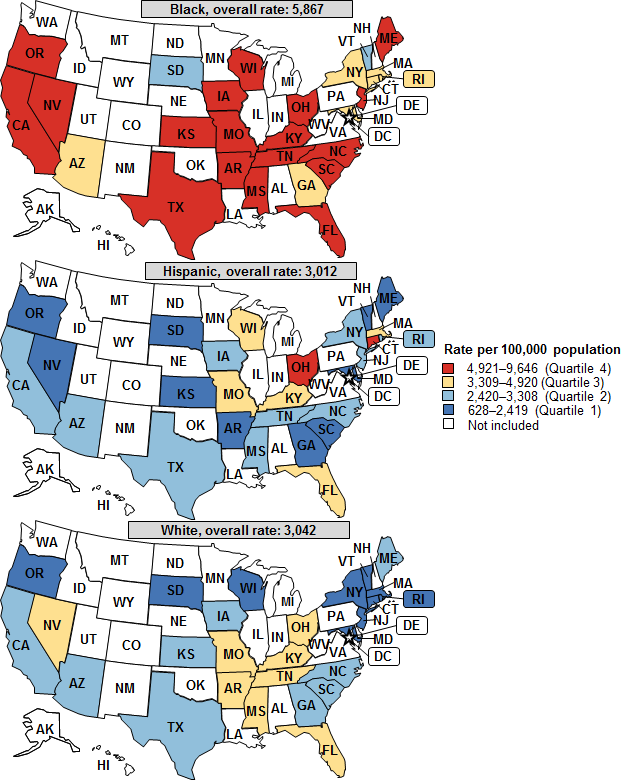
Figure 4. Population rates of ILI-related ED visits, by race/ethnicity and State, August 2016-July 2018, 27 States
Abbreviations: ED, emergency department; ILI, influenza and influenza-like illness Figure 4 consists of three maps that show the population rate quartile of ILI-related ED visits by race/ethnicity and by State from August 2016 to July 2018 for 27 States. Quartile 4: 4,921-9,646; Quartile 3: 3,309-4,920; Quartile 2: 2,420-3,308; Quartile 1: 628-2,419. These States are not included: Alabama, Alaska, Colorado, Delaware, District of Columbia, Hawaii, Idaho, Illinois, Indiana, Louisiana, Michigan, Minnesota, Montana, Nebraska, New Hampshire, New Mexico, North Dakota, Oklahoma, Pennsylvania, Utah, Virginia, Washington, West Virginia, Wyoming. Data are provided in Supplemental Table 2. |
|
|
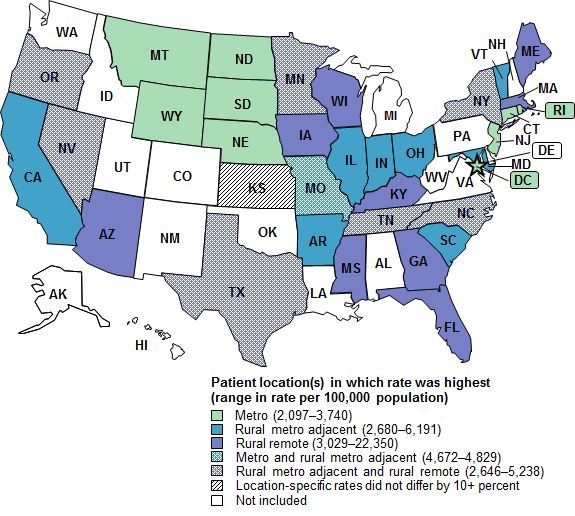
Figure 5. Patient residence location where the rate of ILI-related ED visits was highest, by State, August 2016-July 2018, 34 States and the District of Columbia
Abbreviations: ED, emergency department; ILI, influenza and influenza-like illness Figure 5 is a map that shows the patient residence location in each State in which the rate of ILI-related ED visits was highest for 34 States and the District of Columbia from August 2016 to July 2018. Metro (2,097-3,740 per 100,000 population): Connecticut, District of Columbia, Montana, Nebraska, New Jersey, North Dakota, Rhode Island, South Dakota, Wyoming. Rural metro adjacent (2,680-6,191 per 100,000 population): Arkansas, California, Illinois, Indiana, Maryland, Ohio, South Carolina, Vermont. Rural remote (3,029-22,350 per 100,000 population): Arizona, Florida, Georgia, Iowa, Kentucky, Maine, Massachusetts, Mississippi, Wisconsin. Metro and rural metro adjacent (4,672-4,829 per 100,000 population): Missouri. Rural metro adjacent and rural remote (2,646-5,238 per 100,000 population): Minnesota, Nevada, New York, North Carolina, Oregon, Tennessee, Texas. Location-specific rates did not differ by 10+ percent: Kansas. Not included: Alabama, Alaska, Colorado, Delaware, Hawaii, Idaho, Louisiana, Michigan, New Hampshire, New Mexico, Oklahoma, Pennsylvania, Utah, Virginia, Washington, West Virginia. |
1 Fingar KR, Liang L, Stocks C. Inpatient Hospital Stays and Emergency Department Visits Involving Influenza, 2006-2016. HCUP Statistical Brief #253. October 2019. Agency for Healthcare Research and Quality, Rockville, MD. www.hcup-us.ahrq.gov/reports/statbriefs/sb253-Influenza-Hospitalizations-ED-Visits-2006-2016.pdf. Accessed August 29, 2020. 2 Centers for Disease Control and Prevention. Burden Estimates for the 2014-2015 Influenza Season. Page last reviewed October 25, 2018. www.cdc.gov/flu/about/burden/2014-2015.html. Accessed August 29, 2020. 3 Reed C, Biggerstaff M, Finelli L, Koonin LM, Beauvais D, Uzicanin A, et al. Novel framework for assessing epidemiologic effects of influenza epidemics and pandemics. Emerging Infectious Diseases. 2013;19(1):85-91. About Statistical Briefs Healthcare Cost and Utilization Project (HCUP) Statistical Briefs provide basic descriptive statistics on a variety of topics using HCUP administrative healthcare data. Topics include hospital inpatient, ambulatory surgery, and emergency department use and costs, quality of care, access to care, medical conditions, procedures, and patient populations, among other topics. The reports are intended to generate hypotheses that can be further explored in other research; the reports are not designed to answer in-depth research questions using multivariate methods. Data Source The estimates in this Statistical Brief are based upon data from the HCUP 2016-2018 State Inpatient Databases (SID) and State Emergency Department Databases (SEDD). The SID capture all inpatient admissions (including those that originate in the emergency department [ED]), whereas the SEDD capture all ED visits that do not result in admission. Generally, statistics presented in this Statistical Brief include 34 States and the District of Columbia, except for those on race/ethnicity, which are based on data from 27 States which had less than 6 percent of records in the 2016-2018 SID and SEDD missing data on race/ethnicity (see Figures 2-5 for States included). Supplemental sources include population denominator data for use with HCUP databases, derived from information available from Claritas, a vendor that produces population estimates and projections based on data from the U.S. Census Bureau.b Data on community-level household crowding by ZIP Code was obtained from the U.S. Census Bureau's 2016 American Community Survey, five-year estimates. Definitions Diagnoses and ICD-10-CM The principal diagnosis is that condition established after study to be chiefly responsible for the patient's admission to the hospital. Secondary diagnoses are conditions that coexist at the time of admission that require or affect patient care treatment received or management, or that develop during the inpatient stay. All-listed diagnoses include the principal diagnosis plus the secondary conditions. For emergency department (ED) visits that are treated and released, the first-listed diagnosis represents the condition, symptom, or problem identified in the medical record to be chiefly responsible for the ED services provided. In cases where the first-listed diagnosis is a symptom or problem, a diagnosis has not been established (confirmed) by the provider. For ED visits that result in an inpatient admission, the first-listed diagnosis is the principal diagnosis, the condition established after study to be chiefly responsible for the patient's admission to the hospital. Secondary diagnoses are conditions that coexist at the time of the ED visit or inpatient admission, that require or affect patient care treatment received or management, or that develop during the inpatient stay. All-listed diagnoses include the first-listed (principal) diagnosis plus the secondary conditions. ICD-10-CM is the International Classification of Diseases, Tenth Revision, Clinical Modification. In October 2015, ICD-10-CM replaced the International Classification of Diseases, Ninth Revision, Clinical Modification (ICD-9-CM) diagnosis coding system for most inpatient and outpatient medical encounters. There are over 70,000 ICD-10-CM diagnosis codes. Case definition The ICD-10-CM codes defining influenza/influenza-like illnesses are shown in Table 2. |
| Table 2. Case definition of ILI | |
| ICD-10-CM code | Description |
|---|---|
| Influenza | |
| J1000 | Influenza due to other identified influenza virus with unspecified type of pneumonia |
| J1001 | Influenza due to other identified influenza virus with the same other identified influenza virus pneumonia |
| J1008 | Influenza due to other identified influenza virus with other specified pneumonia |
| J101 | Influenza due to other identified influenza virus with other respiratory manifestations |
| J102 | Influenza due to other identified influenza virus with gastrointestinal manifestations |
| J1081 | Influenza due to other identified influenza virus with encephalopathy |
| J1082 | Influenza due to other identified influenza virus with myocarditis |
| J1083 | Influenza due to other identified influenza virus with otitis media |
| J1089 | Influenza due to other identified influenza virus with other manifestations |
| J1100 | Influenza due to unidentified influenza virus with unspecified type of pneumonia |
| J1108 | Influenza due to unidentified influenza virus with specified pneumonia |
| J111 | Influenza due to unidentified influenza virus with other respiratory manifestations |
| J112 | Influenza due to unidentified influenza virus with gastrointestinal manifestations |
| J1181 | Influenza due to unidentified influenza virus with encephalopathy |
| J1182 | Influenza due to unidentified influenza virus with myocarditis |
| J1183 | Influenza due to unidentified influenza virus with otitis media |
| J1189 | Influenza due to unidentified influenza virus with other manifestations |
| J09X1 | Influenza due to identified novel influenza A virus with pneumonia |
| J09X2 | Influenza due to identified novel influenza A virus with other respiratory manifestations |
| J09X3 | Influenza due to identified novel influenza A virus with gastrointestinal manifestations |
| J09X9 | Influenza due to identified novel influenza A virus with other manifestations |
| Influenza-like illness | |
| J069 | Acute upper respiratory infection, unspecified |
| J399 | Disease of upper respiratory tract, unspecified |
| J200 | Acute bronchitis due to Mycoplasma pneumoniae |
| J201 | Acute bronchitis due to Hemophilus influenzae |
| J202 | Acute bronchitis due to streptococcus |
| J203 | Acute bronchitis due to coxsackievirus |
| J204 | Acute bronchitis due to parainfluenza virus |
| J205 | Acute bronchitis due to respiratory syncytial virus |
| J206 | Acute bronchitis due to rhinovirus |
| J207 | Acute bronchitis due to echovirus |
| J208 | Acute bronchitis due to other specified organisms |
| J209 | Acute bronchitis, unspecified |
| J210 | Acute bronchiolitis due to respiratory syncytial virus |
| J211 | Acute bronchiolitis due to human metapneumovirus |
| J218 | Acute bronchiolitis due to other specified organisms |
| J219 | Acute bronchiolitis, unspecified |
| J40 | Bronchitis, not specified as acute or chronic |
| B012 | Varicella pneumonia |
| B052 | Measles complicated by pneumonia |
| B0681 | Rubella pneumonia |
| B250 | Cytomegaloviral pneumonitis |
| J120 | Adenoviral pneumonia |
| J121 | Respiratory syncytial virus pneumonia |
| J122 | Parainfluenza virus pneumonia |
| J123 | Human metapneumovirus pneumonia |
| J1281 | Pneumonia due to SARS-associated coronavirus |
| J1289 | Other viral pneumonia |
| J129 | Viral pneumonia, unspecified |
| J440 | Chronic obstructive pulmonary disease with acute lower resp infection |
| J441 | Chronic obstructive pulmonary disease with (acute) exacerbation |
| J470 | Bronchiectasis with acute lower respiratory infection |
| J471 | Bronchiectasis with (acute) exacerbation |
| Abbreviations: ICD-10-CM, International Classification of Diseases, Tenth Revision, Clinical Modification; ILI, influenza and influenza-like illness; SARS, severe acute respiratory syndrome | |
Types of hospitals included in HCUP State Inpatient Databases This analysis used State Inpatient Databases (SID) limited to data from community hospitals, which are defined as short-term, non-Federal, general, and other hospitals, excluding hospital units of other institutions (e.g., prisons). Community hospitals include obstetrics and gynecology, otolaryngology, orthopedic, cancer, pediatric, public, and academic medical center hospitals. Excluded for this analysis are long-term care facilities such as rehabilitation, psychiatric, and alcoholism and chemical dependency hospitals. However, if a patient received long-term care, rehabilitation, or treatment for a psychiatric or chemical dependency condition in a community hospital, the discharge record for that stay was included in the analysis. Types of hospitals included in HCUP State Emergency Department Databases This analysis used State Emergency Department Databases (SEDD) limited to data from community hospitals with a hospital-owned ED. Community hospitals are defined as short-term, non-Federal, general, and other hospitals, excluding hospital units of other institutions (e.g., prisons). Community hospitals include specialty, pediatric, public, and academic medical center hospitals. Excluded for this analysis are long-term care facilities such as rehabilitation, psychiatric, and alcoholism and chemical dependency hospitals. Unit of analysis The unit of analysis is the ED visit, not a person or patient. This means that a person who is seen in the ED multiple times will be counted each time as a separate visit in the ED. Population rates Rates per 100,000 population were calculated as follows for the 2016-2017 and 2017-2018 flu seasons. For the combined results, the numerator and denominator for each season were summed together. 2016-2017
Place of residence is based on the rural-urban continuum codes (RUCC) for U.S. counties developed by the United States Department of Agriculture (USDA).c For this Statistical Brief, we collapsed the RUCC codes into the following three categories: Metropolitan (metro) area:
Community-level income is based on the median household income of the patient's ZIP Code of residence. Quartiles are defined so that each State's population is evenly distributed. Cut-offs for the quartiles are determined annually using ZIP Code demographic data obtained from Claritas, a vendor that produces population estimates and projections based on data from the U.S. Census Bureau.d The value ranges for the income quartiles vary by year. The income quartile is missing for patients who are homeless or foreign. Community-level household crowding Community-level household crowding is based on the percentage of occupied housing units with more people than rooms out of all occupied housing units, as estimated by the U.S Census Bureau's American Community Survey, in the patient's ZIP Code of residence. Quartiles are defined so that that the total U.S. population is evenly distributed. Household overcrowding is a measure of social vulnerability to hazardous events, including disease outbreaks, as defined by the Centers for Disease Control and Prevention's (CDC's) Social Vulnerability Index.e Expected payer To make coding uniform across all HCUP data sources, the primary expected payer for the hospital stay or ED visit combines detailed categories into general groups:
Reporting of race and ethnicity Data on Hispanic ethnicity are collected differently among the States and also can differ from the census methodology of collecting information on race (White, Black, Asian/Pacific Islander, American Indian/Alaska Native, Other [including mixed race]) separately from ethnicity (Hispanic, non-Hispanic). State data organizations often collect Hispanic ethnicity as one of several categories that include race. Therefore, for multistate analyses, HCUP creates the combined categorization of race and ethnicity for data from States that report ethnicity separately. When a State data organization collects Hispanic ethnicity separately from race, HCUP uses Hispanic ethnicity to override any other race category to create a Hispanic category for the uniformly coded race/ethnicity data element, while also retaining the original race and ethnicity data. This Statistical Brief reports race/ethnicity for the following categories: Hispanic, non-Hispanic White, non-Hispanic Black, non-Hispanic Asian/Pacific Islander, and non-Hispanic Other. About HCUP The Healthcare Cost and Utilization Project (HCUP, pronounced "H-Cup") is a family of healthcare databases and related software tools and products developed through a Federal-State-Industry partnership and sponsored by the Agency for Healthcare Research and Quality (AHRQ). HCUP databases bring together the data collection efforts of State data organizations, hospital associations, and private data organizations (HCUP Partners) and the Federal government to create a national information resource of encounter-level healthcare data. HCUP includes the largest collection of longitudinal hospital care data in the United States, with all-payer, encounter-level information beginning in 1988. These databases enable research on a broad range of health policy issues, including cost and quality of health services, medical practice patterns, access to healthcare programs, and outcomes of treatments at the national, State, and local market levels. HCUP would not be possible without the contributions of the following data collection Partners from across the United States: |
|
Alaska Department of Health and Social Services
Alaska State Hospital and Nursing Home Association Arizona Department of Health Services Arkansas Department of Health California Office of Statewide Health Planning and Development Colorado Hospital Association Connecticut Hospital Association Delaware Division of Public Health District of Columbia Hospital Association Florida Agency for Health Care Administration Georgia Hospital Association Hawaii Laulima Data Alliance Hawaii University of Hawai'i at Hilo Illinois Department of Public Health Indiana Hospital Association Iowa Hospital Association Kansas Hospital Association Kentucky Cabinet for Health and Family Services Louisiana Department of Health Maine Health Data Organization Maryland Health Services Cost Review Commission Massachusetts Center for Health Information and Analysis Michigan Health & Hospital Association Minnesota Hospital Association Mississippi State Department of Health Missouri Hospital Industry Data Institute |
Montana Hospital Association Nebraska Hospital Association Nevada Department of Health and Human Services New Hampshire Department of Health & Human Services New Jersey Department of Health New Mexico Department of Health New York State Department of Health North Carolina Department of Health and Human Services North Dakota (data provided by the Minnesota Hospital Association) Ohio Hospital Association Oklahoma State Department of Health Oregon Association of Hospitals and Health Systems Oregon Office of Health Analytics Pennsylvania Health Care Cost Containment Council Rhode Island Department of Health South Carolina Revenue and Fiscal Affairs Office South Dakota Association of Healthcare Organizations Tennessee Hospital Association Texas Department of State Health Services Utah Department of Health Vermont Association of Hospitals and Health Systems Virginia Health Information Washington State Department of Health West Virginia Department of Health and Human Resources, West Virginia Health Care Authority Wisconsin Department of Health Services Wyoming Hospital Association |
|
About the SID The HCUP State Inpatient Databases (SID) are hospital inpatient databases from data organizations participating in HCUP. The SID contain the universe of the inpatient discharge abstracts in the participating HCUP States, translated into a uniform format to facilitate multistate comparisons and analyses. Together, the SID encompass more than 95 percent of all U.S. community hospital discharges. The SID can be used to investigate questions unique to one State, to compare data from two or more States, to conduct market-area variation analyses, and to identify State-specific trends in inpatient care utilization, access, charges, and outcomes. About the SEDD The HCUP State Emergency Department Databases (SEDD) include information from hospital-owned emergency departments (EDs) from data organizations participating in HCUP, translated into a uniform format to facilitate multistate comparisons and analyses. The SEDD capture the universe of records on ED visits in participating HCUP States that do not result in an admission to the same hospital (i.e., patients who are treated in the ED and then discharged, transferred to another hospital, left against medical advice, or died). The SEDD contain a core set of clinical and nonclinical information on all patients, including individuals covered by Medicare, Medicaid, or private insurance, as well as those whose stays were not expected to be covered by insurance. The SEDD can be used to investigate questions unique to one State, to compare data from two or more States, to conduct market-area variation analyses, and to identify State-specific trends in injury surveillance, emerging infections, and other conditions treated in the ED. For More Information For other information on influenza, refer to the HCUP Statistical Briefs located at www.hcup-us.ahrq.gov/reports/statbriefs/sb_lung.jsp. For additional HCUP statistics, visit:
For a detailed description of HCUP and more information on the design of the State Inpatient Databases (SID) and State Emergency Department Databases (SEDD), please refer to the following database documentation: Agency for Healthcare Research and Quality. Overview of the State Inpatient Databases (SID). Healthcare Cost and Utilization Project (HCUP). Rockville, MD: Agency for Healthcare Research and Quality. Updated November 2019. www.hcup-us.ahrq.gov/sidoverview.jsp. Accessed February 3, 2020. Agency for Healthcare Research and Quality. Overview of the State Emergency Department Databases (SEDD). Healthcare Cost and Utilization Project (HCUP). Rockville, MD: Agency for Healthcare Research and Quality. Updated January 2020. www.hcup-us.ahrq.gov/seddoverview.jsp. Accessed February 3, 2020. Suggested Citation Reid LD (AHRQ), Fingar KF (IBM Watson Health). Emergency Department Visits Involving Influenza and Influenza-Like Illnesses, 2016-2018. HCUP Statistical Brief #269. December 2020. Agency for Healthcare Research and Quality, Rockville, MD. www.hcup-us.ahrq.gov/reports/statbriefs/sb269-Influenza-ED-Visits-2016-2018.pdf. Acknowledgments The authors would like to acknowledge the contributions of Minya Sheng of IBM Watson Health. *** AHRQ welcomes questions and comments from readers of this publication who are interested in obtaining more information about access, cost, use, financing, and quality of healthcare in the United States. We also invite you to tell us how you are using this Statistical Brief and other HCUP data and tools, and to share suggestions on how HCUP products might be enhanced to further meet your needs. Please email us at hcup@ahrq.gov or send a letter to the address below:Joel W. Cohen, Ph.D., Director Center for Financing, Access and Cost Trends Agency for Healthcare Research and Quality 5600 Fishers Lane Rockville, MD 20857 This Statistical Brief was posted online on December 15, 2020. a Overcrowding was defined as the percentage of occupied households in the patient's ZIP Code of residence with more people than rooms and is described further in the Definitions section. b Claritas. Claritas Demographic Profile by ZIP Code. https://claritas360.claritas.com/mybestsegments/. c United States Department of Agriculture. Rural-Urban Continuum Codes. www.ers.usda.gov/data-products/rural-urban-continuum-codes/. Accessed February 27, 2020. d Claritas. Claritas Demographic Profile by ZIP Code. https://claritas360.claritas.com/mybestsegments/. e Centers for Disease Control and Prevention (CDC). CDC SVI 2018 Documentation. January 31, 2020. www.atsdr.cdc.gov/placeandhealth/svi/documentation/pdf/SVI2018Documentation-H.pdf. Accessed November 1, 2020. |
| Supplemental Table 1. Population rates of ILI-related ED visits, by age group and State, August 2016-July 2018, 34 States and the District of Columbia, for data presented in Figure 3 | |||
| State | Quartile | ||
|---|---|---|---|
| <18 years | 18-64 years | 65+ years | |
| Overall rate per 100,000 population | 5,178 | 2,304 | 4,812 |
| Arizona | 3 | 1 | 3 |
| Arkansas | 4 | 2 | 4 |
| California | 3 | 1 | 3 |
| Connecticut | 3 | 1 | 3 |
| DC | 4 | 1 | 3 |
| Florida | 4 | 2 | 4 |
| Georgia | 4 | 2 | 4 |
| Illinois | 3 | 1 | 4 |
| Indiana | 3 | 2 | 4 |
| Iowa | 3 | 1 | 3 |
| Kansas | 3 | 1 | 3 |
| Kentucky | 4 | 2 | 4 |
| Maine | 2 | 1 | 4 |
| Maryland | 2 | 1 | 3 |
| Massachusetts | 2 | 1 | 3 |
| Minnesota | 3 | 1 | 2 |
| Mississippi | 4 | 3 | 4 |
| Missouri | 4 | 2 | 4 |
| Montana | 2 | 1 | 2 |
| Nebraska | 2 | 1 | 2 |
| Nevada | 3 | 1 | 3 |
| New Jersey | 3 | 1 | 3 |
| New York | 2 | 1 | 2 |
| North Carolina | 4 | 2 | 4 |
| North Dakota | 2 | 1 | 3 |
| Ohio | 4 | 3 | 4 |
| Oregon | 2 | 1 | 3 |
| Rhode Island | 2 | 1 | 3 |
| South Carolina | 4 | 2 | 4 |
| South Dakota | 1 | 1 | 2 |
| Tennessee | 4 | 2 | 4 |
| Texas | 4 | 1 | 4 |
| Vermont | 1 | 1 | 2 |
| Wisconsin | 2 | 1 | 3 |
| Wyoming | 2 | 1 | 2 |
| Supplemental Table 2. Population rates of ILI-related ED visits, by race/ethnicity and State, August 2016-July 2018, 27 States, for data presented in Figure 4 | |||
| State | Quartile | ||
|---|---|---|---|
| Black | Hispanic | White | |
| Overall rate per 100,000 population | 5,867 | 3,012 | 3,042 |
| Arizona | 3 | 2 | 2 |
| Arkansas | 4 | 1 | 3 |
| California | 4 | 2 | 2 |
| Connecticut | 3 | 4 | 1 |
| Florida | 4 | 3 | 3 |
| Georgia | 3 | 1 | 2 |
| Iowa | 4 | 2 | 2 |
| Kansas | 4 | 1 | 2 |
| Kentucky | 4 | 3 | 3 |
| Maine | 4 | 1 | 2 |
| Maryland | 3 | 1 | 1 |
| Massachusetts | 3 | 3 | 1 |
| Mississippi | 4 | 2 | 3 |
| Missouri | 4 | 3 | 3 |
| Nevada | 4 | 1 | 3 |
| New Jersey | 4 | 2 | 1 |
| New York | 3 | 2 | 1 |
| North Carolina | 4 | 2 | 2 |
| Ohio | 4 | 4 | 3 |
| Oregon | 4 | 1 | 1 |
| Rhode Island | 3 | 2 | 1 |
| South Carolina | 4 | 1 | 2 |
| South Dakota | 2 | 1 | 1 |
| Tennessee | 4 | 2 | 3 |
| Texas | 4 | 2 | 2 |
| Vermont | 2 | 1 | 1 |
| Wisconsin | 4 | 3 | 1 |
| Internet Citation: Statistical Brief #269. Healthcare Cost and Utilization Project (HCUP). December 2020. Agency for Healthcare Research and Quality, Rockville, MD. hcup-us.ahrq.gov/reports/statbriefs/sb269-Influenza-ED-Visits-2016-2018.jsp. |
| Are you having problems viewing or printing pages on this website? |
| If you have comments, suggestions, and/or questions, please contact hcup@ahrq.gov. |
| If you are experiencing issues related to Section 508 accessibility of information on this website, please contact hcup@ahrq.gov. |
| Privacy Notice, Viewers & Players |
| Last modified 12/8/20 |