|
STATISTICAL BRIEF #268
December 2020
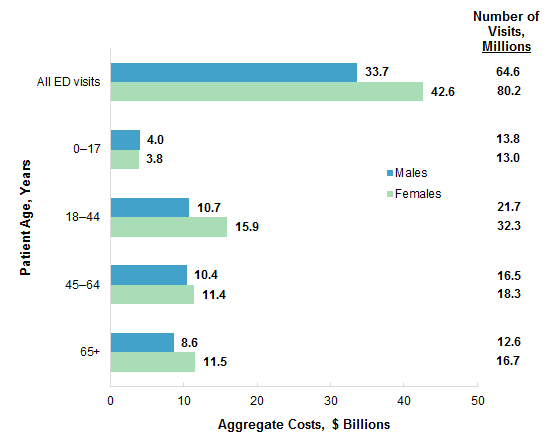
Brian J. Moore, Ph.D., and Lan Liang, Ph.D. Introduction Emergency department (ED) visits have grown in the United States, with the rate of increase from 1996 to 2013 exceeding that for hospital inpatient care.1 In 2017, 13.3 percent of the U.S. population incurred at least one expense for an ED visit.2 Furthermore, more than 50 percent of hospital inpatient stays in 2017 included evidence of ED services prior to admission.3 Trends in ED volume vary significantly by patient and hospital characteristics, but an examination of nationwide costs by these characteristics has not yet been explored in the literature.4 This Healthcare Cost and Utilization Project (HCUP) Statistical Brief presents statistics on the cost of ED visits in the United States using the 2017 Nationwide Emergency Department Sample (NEDS). Total ED charges were converted to costs using HCUP Cost-to-Charge Ratios based on hospital accounting reports from the Centers for Medicare & Medicaid Services (CMS). ED visits include patients treated and released from the ED, as well as those admitted to the same hospital through the ED. Aggregate costs, average costs, and number of ED visits are presented by patient and hospital characteristics. Because of the large sample size of the NEDS data, small differences can be statistically significant. Thus, only percentage differences greater than or equal to 10 percent are discussed in the text. Findings Aggregate costs for emergency department (ED) visits by patient sex and age group, 2017 Figure 1 presents aggregate ED visit costs by patient sex and age group in 2017 as well as number of ED visits. Estimates of aggregate cost use the product of the number of cases and the average estimated cost per visit to account for records with missing ED charge information. Aggregate cost decompositions among different descriptive statistics or using multiple levels of aggregation in a single computation could lead to slightly different total cost estimates due to the use of slightly different and more specific estimates of the missing information. |
|
Figure 1. Aggregate ED visit costs by patient sex and age, 2017
Abbreviation: ED, emergency department Bar chart that shows the aggregate ED visit costs and the number of ED visits by patient sex and age group in 2017. All ED visits: $33.7 billion (64.6 million visits) for males; $42.6 billion (80.2 million visits) for females. 0-17 years: $4.0 billion (13.8 million visits) for males; $3.8 billion (13.0 million visits) for females. 18-44 years: $10.7 billion (21.7 million visits) for males; $15.9 billion (32.3 million visits) for females. 45-64 years: $10.4 billion (16.5 million visits) for males; $11.4 billion (18.3 million visits) for females. 65+ years: $8.6 billion (12.6 million visits) for males; $11.5 billion (16.7 million visits) for females. |
Table 1 presents the aggregate and average costs for ED visits, the number of ED visits, and the distributions of costs and visits, by select patient characteristics in 2017. |
| Table 1. Aggregate costs, average costs, and number of ED visits by patient characteristics, 2017 | |||||
| Patient characteristic | Aggregate costs | Average cost per visit, $ | ED visits | ||
|---|---|---|---|---|---|
| $, billion | % | N, million | % | ||
| Total | 76.3 | 100.0 | 530 | 144.8 | 100.0 |
| Age group, years | |||||
| 0-17 | 7.9 | 10.3 | 290 | 26.8 | 18.5 |
| 18-44 | 26.7 | 35.0 | 490 | 54.1 | 37.3 |
| 45-64 | 21.8 | 28.6 | 630 | 34.7 | 24.0 |
| 65+ | 20.2 | 26.4 | 690 | 29.2 | 20.2 |
| Sex | |||||
| Female | 42.6 | 55.9 | 530 | 80.2 | 55.4 |
| Male | 33.7 | 44.1 | 520 | 64.6 | 44.6 |
| Primary expected payer | |||||
| Medicare | 23.0 | 30.1 | 660 | 34.9 | 24.1 |
| Medicaid | 19.1 | 25.0 | 420 | 45.6 | 31.5 |
| Private insurance | 23.1 | 30.3 | 560 | 41.0 | 28.3 |
| Self-pay/No charge* | 8.1 | 10.6 | 460 | 17.5 | 12.1 |
| Other | 2.8 | 3.7 | 510 | 5.5 | 3.8 |
| Community-level income | |||||
| Quartile 1 (lowest) | 24.0 | 31.4 | 480 | 49.6 | 34.3 |
| Quartile 2 | 20.2 | 26.5 | 520 | 38.8 | 26.8 |
| Quartile 3 | 17.2 | 22.6 | 560 | 30.8 | 21.2 |
| Quartile 4 (highest) | 13.8 | 18.1 | 600 | 23.2 | 16.0 |
| Location of patient's residence | |||||
| Large metropolitan | 39.5 | 51.8 | 540 | 73.1 | 50.4 |
| Small metropolitan | 23.3 | 30.6 | 500 | 46.2 | 31.9 |
| Micropolitan | 7.6 | 9.9 | 510 | 15.0 | 10.3 |
| Rural | 5.5 | 7.2 | 560 | 9.8 | 6.8 |
| ED discharge disposition | |||||
| Routine discharge | 61.6 | 80.8 | 530 | 117.2 | 80.9 |
| Inpatient admission | 7.2 | 9.4 | 360 | 20.2 | 14.0 |
| Transfer† | 4.7 | 6.2 | 1,100 | 4.3 | 3.0 |
| All other dispositions‡ | 2.3 | 3.0 | 740 | 3.1 | 2.1 |
| Abbreviation: ED, emergency department Notes: Statistics for ED visits with missing or invalid patient characteristics are not presented. Patient age, sex, expected payer, community-level income, and patient location were missing for <0.1%, <0.1%, 0.3%, 1.7%, and 0.5% of ED visits, respectively. About 13% of all ED visits (weighted) in the 2017 NEDS are missing information about ED charges, from which costs are estimated. * Self-pay/No charge: includes self-pay, no charge, charity, and no expected payment. † Transfers include both transfer to a different short-term hospital and transfer to other facilities such as skilled nursing facilities, intermediate care facilities, and other types of facilities. ‡ All other dispositions include home healthcare, against medical advice, died in the ED, and destination unknown. Source: Agency for Healthcare Research and Quality (AHRQ), Healthcare Cost and Utilization Project (HCUP), Nationwide Emergency Department Sample (NEDS), 2017 | |||||
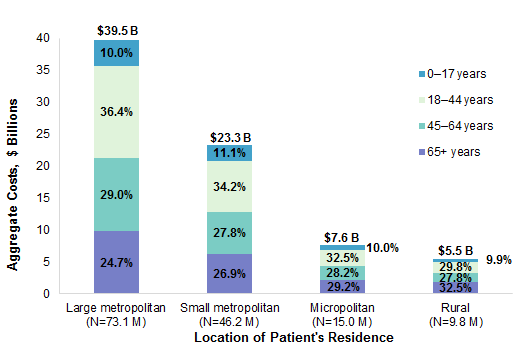
Figures 2-4 present the distribution of aggregate costs for ED visits based on the location of the patient's residence by age (Figure 2), community-level income (Figure 3), and primary expected payer (Figure 4). Figure 2 presents the distribution of aggregate costs for ED visits by patient age based on the location of the patient's residence in 2017. |
|
Figure 2. Aggregate ED visit costs by age and patient location, 2017
Abbreviations: B, billion; ED, emergency department; M, million Bar chart that shows the distribution of aggregate costs for ED visits by patient age and location of the patient's residence in 2017. Large metropolitan (N=73.1 million visits, $39.5 billion): 0-17 years: 10.0%; 18-44 years: 36.4%; 45-64 years: 29.0%; 65+ years: 24.7%. Small metropolitan (N=46.2 million visits, $23.3 billion): 0-17 years: 11.1%; 18-44 years: 34.2%; 45-64 years: 27.8%; 65+ years: 26.9%. Micropolitan (N=15.0 million visits, $7.6 billion): 0-17 years: 10.0%; 18-44 years: 32.5%; 45-64 years: 28.2%; 65+ years: 29.2%. Rural (N=9.8 million visits, $5.5 billion): 0-17 years: 9.9%; 18-44 years: 29.8%; 45-64 years: 27.8%; 65+ years: 32.5%. |
|
|
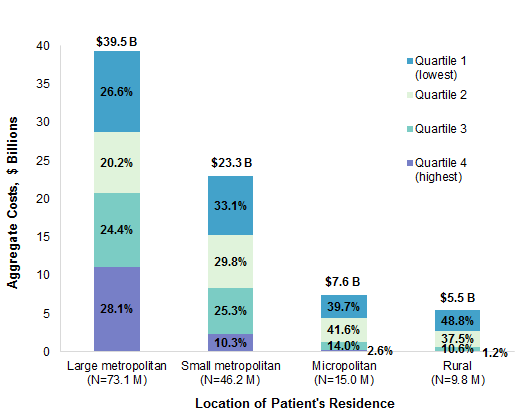
Figure 3. Aggregate ED visit costs by community-level income and location of patient's residence, 2017
Abbreviations: B, billion; ED, emergency department; M, million Bar chart that shows the distribution of aggregate costs for ED visits by community-level household income quartile and the location of the patient's residence in 2017. Large metropolitan (N=73.1 million visits, $39.5 billion): quartile 1: 26.6%; quartile 2: 20.2%; quartile 3: 24.4%; quartile 4: 28.1%. Small metropolitan (N=46.2 million visits, $23.3 billion): quartile 1: 33.1%; quartile 2: 29.8%; quartile 3: 25.3%; quartile 4: 10.3%. Micropolitan (N=15.0 million visits, $7.6 billion): quartile 1: 39.7%; quartile 2: 41.6%; quartile 3: 14.0%; quartile 4: 2.6%. Rural (N=9.8 million visits, $5.5 billion): quartile 1: 48.8%; quartile 2: 37.5%; quartile 3: 10.6%; quartile 4: 1.2%. |
|
|
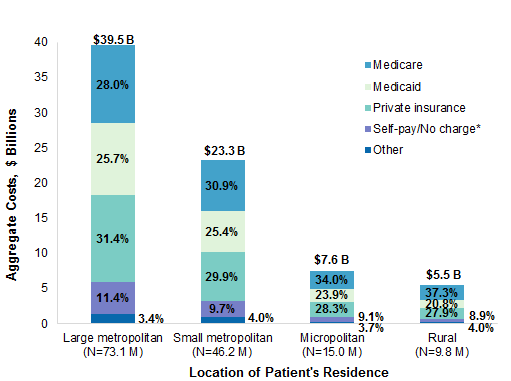
Figure 4. Aggregate ED visit costs by primary expected payer and patient location, 2017
Abbreviations: B, billion; ED, emergency department; M, million Bar chart that shows the distribution of aggregate costs for ED visits by primary expected payer and the location of the patient's residence in 2017. Large metropolitan (N=73.1 million visits, $39.5 billion): Medicare: 28.0%; Medicaid: 25.7%; private insurance: 31.4%; self-pay/no charge: 11.4%; other: 3.4%. Small metropolitan (N=46.2 million visits, $23.3 billion): Medicare: 30.9%; Medicaid: 25.4%; private insurance: 29.9%; self-pay/no charge: 9.7%; other: 4.0%. Micropolitan (N=15.0 million visits, $7.6 billion): Medicare: 34.0%; Medicaid: 23.9%; private insurance: 28.3%; self-pay/no charge: 9.1%; other: 3.7%. Rural (N=9.8 million visits, $5.5 billion): Medicare: 37.3%; Medicaid: 20.8%; private insurance: 27.9%; self-pay/no charge: 8.9%; other: 4.0%. |
Table 2 presents the aggregate and average costs for ED visits, the number of ED visits, and the distributions of costs and visits, by select hospital characteristics in 2017. |
| Table 2. Aggregate costs, average costs, and number of ED visits by hospital characteristics, 2017 | |||||
| Hospital characteristic | Aggregate costs | Average cost per visit, $ | ED visits | ||
|---|---|---|---|---|---|
| $, billion | % | N, million | % | ||
| Total | 76.3 | 100.0 | 530 | 144.8 | 100.0 |
| Region | |||||
| Northeast | 14.4 | 18.8 | 550 | 26.2 | 18.1 |
| Midwest | 18.5 | 24.3 | 560 | 33.2 | 22.9 |
| South | 27.5 | 36.1 | 480 | 57.9 | 40.0 |
| West* | 18.0 | 23.5 | 650 | 27.6 | 19.0 |
| Ownership | |||||
| Private, for-profit | 8.8 | 11.5 | 420 | 21.2 | 14.6 |
| Private, nonprofit | 55.0 | 72.0 | 540 | 100.9 | 69.6 |
| Public | 12.5 | 16.4 | 550 | 22.8 | 15.7 |
| Teaching status | |||||
| Nonteaching | 27.4 | 36.0 | 510 | 54.2 | 37.4 |
| Teaching | 48.9 | 64.1 | 540 | 90.6 | 62.6 |
| Trauma level designation | |||||
| Trauma center level I | 13.9 | 18.3 | 600 | 23.2 | 16.0 |
| Trauma center level II | 12.0 | 15.7 | 520 | 23.2 | 16.0 |
| Trauma center level III | 10.2 | 13.4 | 530 | 19.3 | 13.3 |
| Not a trauma center | 40.0 | 52.5 | 510 | 79.2 | 54.7 |
| Abbreviation: ED, emergency department * In 2017, about 13% of all ED visits (weighted) in the NEDS are missing information about ED charges; therefore, ED cost cannot be estimated. The missing information is concentrated in the West, where 58.9% of ED visits (weighted) are missing ED charges. Source: Agency for Healthcare Research and Quality (AHRQ), Healthcare Cost and Utilization Project (HCUP), Nationwide Emergency Department Sample (NEDS), 2017 | |||||
1 Dieleman JL, Squires E, Bui AL, Campbell M, Chapin A, Hamavid H, et al. Factors associated with increases in US health care spending, 1996-2013. JAMA. 2017;318(17):1668-78. 2 Agency for Healthcare Research and Quality. Percent of Population With an Expense by Event Type, United States, 2017. Medical Expenditure Panel Survey. Generated interactively. www.meps.ahrq.gov/mepstrends/hc_use/. Accessed September 11, 2020. 3 NIS Summary Statistics. HCUP Weighted Summary Statistics Report: NIS 2017 Core File. Healthcare Cost and Utilization Project (HCUP). December 2019. Agency for Healthcare Research and Quality, Rockville, MD. www.hcup-us.ahrq.gov/db/nation/nis/nissummstats.jsp. Accessed September 4, 2020. 4 Moore BJ, Stocks C, Owens PL. Trends in Emergency Department Visits, 2006-2014. HCUP Statistical Brief #227. September 2017. Agency for Healthcare Research and Quality, Rockville, MD. www.hcup-us.ahrq.gov/reports/statbriefs/sb227-Emergency-Department-Visit-Trends.pdf. Accessed September 4, 2020. About Statistical Briefs Healthcare Cost and Utilization Project (HCUP) Statistical Briefs provide basic descriptive statistics on a variety of topics using HCUP administrative healthcare data. Topics include hospital inpatient, ambulatory surgery, and emergency department use and costs, quality of care, access to care, medical conditions, procedures, and patient populations, among other topics. The reports are intended to generate hypotheses that can be further explored in other research; the reports are not designed to answer in-depth research questions using multivariate methods. Data Source The estimates in this Statistical Brief are based upon data from the HCUP 2017 Nationwide Emergency Department Sample (NEDS). Definitions Types of hospitals included in the HCUP Nationwide Emergency Department Sample The Nationwide Emergency Department Sample (NEDS) is based on emergency department (ED) data from community acute care hospitals, which are defined as short-term, non-Federal, general, and other specialty hospitals available to the public. Included among community hospitals are pediatric institutions and hospitals that are part of academic medical centers. Excluded are long-term care facilities such as rehabilitation, psychiatric, and alcoholism and chemical dependency hospitals. Hospitals included in the NEDS have EDs, and no more than 90 percent of their ED visits result in admission. Unit of analysis The unit of analysis is the ED visit, not a person or patient. This means that a person who is seen in the ED multiple times in 1 year will be counted each time as a separate visit in the ED. Costs and charges Total ED charges were converted to costs using HCUP Cost-to-Charge Ratios based on hospital accounting reports from the Centers for Medicare & Medicaid Services (CMS).a Costs reflect the actual expenses incurred in the production of hospital services, such as wages, supplies, and utility costs; charges represent the amount a hospital billed for the case. For each hospital, a cost-to-charge ratio constructed specifically for the hospital ED is used. Hospital charges reflect the amount the hospital billed for the entire ED visit and do not include professional (physician) fees. Total charges were not available on all NEDS records. About 13 percent of all ED visits (weighted) in the 2017 NEDS were missing information about ED charges, and therefore, ED cost could not be estimated. For ED visits that resulted in admission, 24 percent of records were missing ED charges. For ED visits that did not result in admission, 11 percent of records were missing ED charges. The missing information was concentrated in the West (59 percent of records missing ED charges). For this Statistical Brief, the methodology used for aggregate cost estimation was analogous to what is recommended for the estimation of aggregate charges in the Introduction to the HCUP NEDS documentation.b Aggregate costs were estimated as the product of number of visits and average cost per visit in each reporting category. If a stay was missing total charges, average cost was imputed using the average cost for other stays with the same combination of payer characteristics. Therefore, a comparison of aggregate cost estimates across different tables, figures, or characteristics may result in slight discrepancies. How HCUP estimates of costs differ from National Health Expenditure Accounts There are a number of differences between the costs cited in this Statistical Brief and spending as measured in the National Health Expenditure Accounts (NHEA), which are produced annually by CMS.c The largest source of difference comes from the HCUP coverage of ED treatment only in contrast to the NHEA inclusion of inpatient and other outpatient costs associated with other hospital-based outpatient clinics and departments as well. The outpatient portion of hospitals' activities has been growing steadily and may exceed half of all hospital revenue in recent years. On the basis of the American Hospital Association Annual Survey, 2017 outpatient gross revenues (or charges) were about 49 percent of total hospital gross revenues.d Smaller sources of differences come from the inclusion in the NHEA of hospitals that are excluded from HCUP. These include Federal hospitals (Department of Defense, Veterans Administration, Indian Health Services, and Department of Justice [prison] hospitals) as well as psychiatric, substance abuse, and long-term care hospitals. A third source of difference lies in the HCUP reliance on billed charges from hospitals to payers, adjusted to provide estimates of costs using hospital-wide cost-to-charge ratios, in contrast to the NHEA measurement of spending or revenue. HCUP costs estimate the amount of money required to produce hospital services, including expenses for wages, salaries, and benefits paid to staff as well as utilities, maintenance, and other similar expenses required to run a hospital. NHEA spending or revenue measures the amount of income received by the hospital for treatment and other services provided, including payments by insurers, patients, or government programs. The difference between revenues and costs includes profit for for-profit hospitals or surpluses for nonprofit hospitals. Location of patients' residence Place of residence is based on the urban-rural classification scheme for U.S. counties developed by the National Center for Health Statistics (NCHS) and based on the Office of Management and Budget (OMB) definition of a metropolitan service area as including a city and a population of at least 50,000 residents. For this Statistical Brief, we collapsed the NCHS categories into four groups according to the following: Large Metropolitan:
Community-level income is based on the median household income of the patient's ZIP Code of residence. Quartiles are defined so that the total U.S. population is evenly distributed. Cut-offs for the quartiles are determined annually using ZIP Code demographic data obtained from Claritas, a vendor that produces population estimates and projections based on data from the U.S. Census Bureau.e The value ranges for the income quartiles vary by year. The income quartile is missing for patients who are homeless or foreign. Expected payer To make coding uniform across all HCUP data sources, the primary expected payer for the ED visit combines detailed categories into general groups:
Region Region is one of the four regions defined by the U.S. Census Bureau:
Discharge status reflects the disposition of the patient at discharge from the ED and includes the following categories reported in this Statistical Brief: routine (to home); admitted as an inpatient to the same hospital; transfers (transfer to another short-term hospital; other transfers including skilled nursing facility, intermediate care, and another type of facility such as a nursing home); and all other dispositions (home healthcare; against medical advice [AMA]; died in the ED; or destination unknown). Hospital characteristics Data on hospital ownership and status as a teaching hospital was obtained from the American Hospital Association (AHA) Annual Survey of Hospitals. Hospital ownership/control includes categories for government nonfederal (public), private not-for-profit (voluntary), and private investor-owned (proprietary). Teaching hospital is defined as having a residency program approved by the American Medical Association, being a member of the Council of Teaching Hospitals, or having a ratio of full-time equivalent interns and residents to beds of 0.25 or higher. Hospital trauma level Trauma designation for trauma centers treating adults and children were identified through the Trauma Information Exchange Program (TIEP) database, a national inventory of trauma centers in the United States.f A trauma center is a hospital that is equipped to provide comprehensive emergency medical services 24 hours a day, 365 days per year to patients with traumatic injuries. In 1976, the American College of Surgeons Committee on Trauma (ACS/COT) defined five levels of trauma centers:g
About HCUP The Healthcare Cost and Utilization Project (HCUP, pronounced "H-Cup") ") is a family of healthcare databases and related software tools and products developed through a Federal-State-Industry partnership and sponsored by the Agency for Healthcare Research and Quality (AHRQ). HCUP databases bring together the data collection efforts of State data organizations, hospital associations, and private data organizations (HCUP Partners) and the Federal government to create a national information resource of encounter-level healthcare data. HCUP includes the largest collection of longitudinal hospital care data in the United States, with all-payer, encounter-level information beginning in 1988. These databases enable research on a broad range of health policy issues, including cost and quality of health services, medical practice patterns, access to healthcare programs, and outcomes of treatments at the national, State, and local market levels. HCUP would not be possible without the contributions of the following data collection Partners from across the United States: |
|
Alaska Department of Health and Social Services
Alaska State Hospital and Nursing Home Association Arizona Department of Health Services Arkansas Department of Health California Office of Statewide Health Planning and Development Colorado Hospital Association Connecticut Hospital Association Delaware Division of Public Health District of Columbia Hospital Association Florida Agency for Health Care Administration Georgia Hospital Association Hawaii Laulima Data Alliance Hawaii University of Hawai'i at Hilo Illinois Department of Public Health Indiana Hospital Association Iowa Hospital Association Kansas Hospital Association Kentucky Cabinet for Health and Family Services Louisiana Department of Health Maine Health Data Organization Maryland Health Services Cost Review Commission Massachusetts Center for Health Information and Analysis Michigan Health & Hospital Association Minnesota Hospital Association Mississippi State Department of Health Missouri Hospital Industry Data Institute |
Montana Hospital Association Nebraska Hospital Association Nevada Department of Health and Human Services New Hampshire Department of Health & Human Services New Jersey Department of Health New Mexico Department of Health New York State Department of Health North Carolina Department of Health and Human Services North Dakota (data provided by the Minnesota Hospital Association) Ohio Hospital Association Oklahoma State Department of Health Oregon Association of Hospitals and Health Systems Oregon Office of Health Analytics Pennsylvania Health Care Cost Containment Council Rhode Island Department of Health South Carolina Revenue and Fiscal Affairs Office South Dakota Association of Healthcare Organizations Tennessee Hospital Association Texas Department of State Health Services Utah Department of Health Vermont Association of Hospitals and Health Systems Virginia Health Information Washington State Department of Health West Virginia Department of Health and Human Resources, West Virginia Health Care Authority Wisconsin Department of Health Services Wyoming Hospital Association |
|
About the NEDS The HCUP Nationwide Emergency Department Sample (NEDS) is a unique and powerful database that yields national estimates of emergency department (ED) visits. The NEDS was constructed using records from both the HCUP State Emergency Department Databases (SEDD) and the State Inpatient Databases (SID). The SEDD capture information on ED visits that do not result in an admission (i.e., patients who were treated in the ED and then released from the ED, or patients who were transferred to another hospital); the SID contain information on patients initially seen in the ED and then admitted to the same hospital. The NEDS was created to enable analyses of ED utilization patterns and support public health professionals, administrators, policymakers, and clinicians in their decision making regarding this critical source of care. The NEDS is produced annually beginning in 2006. Over time, the sampling frame for the NEDS has changed; thus, the number of States contributing to the NEDS varies from year to year. The NEDS is intended for national estimates only; no State-level estimates can be produced. The unweighted sample size for the 2017 NEDS is 33,506,645 (weighted, this represents 144,814,803 ED visits). For More Information For other information on emergency department visits, refer to the HCUP Statistical Briefs located at www.hcup-us.ahrq.gov/reports/statbriefs/sb_ed.jsp. For additional HCUP statistics, visit:
For a detailed description of HCUP and more information on the design of the Nationwide Emergency Department Sample (NEDS), please refer to the following database documentation: Agency for Healthcare Research and Quality. Overview of the Nationwide Emergency Department Sample (NEDS). Healthcare Cost and Utilization Project (HCUP). Rockville, MD: Agency for Healthcare Research and Quality. Updated December 2019. www.hcup-us.ahrq.gov/nedsdoverview.jsp. Accessed February 3, 2020. Suggested Citation Moore BJ (IBM Watson Health), Liang L (AHRQ). Costs of Emergency Department Visits in the United States, 2017. HCUP Statistical Brief #268. December 2020. Agency for Healthcare Research and Quality, Rockville, MD. www.hcup-us.ahrq.gov/reports/statbriefs/sb268-ED-Costs-2017.pdf. Acknowledgments The authors would like to acknowledge the contributions of Nils Nordstrand of IBM Watson Health. *** AHRQ welcomes questions and comments from readers of this publication who are interested in obtaining more information about access, cost, use, financing, and quality of healthcare in the United States. We also invite you to tell us how you are using this Statistical Brief and other HCUP data and tools, and to share suggestions on how HCUP products might be enhanced to further meet your needs. Please email us at hcup@ahrq.gov or send a letter to the address below:Joel W. Cohen, Ph.D., Director Center for Financing, Access and Cost Trends Agency for Healthcare Research and Quality 5600 Fishers Lane Rockville, MD 20857 This Statistical Brief was posted online on December 8, 2020. a The HCUP Cost-to-Charge Ratios (CCRs) for NEDS Files were not publicly available at the time of publication, so an internal version was used in this Statistical Brief. b Agency for Healthcare Research and Quality. HCUP Nationwide Emergency Department Sample (NEDS) Database Documentation. Healthcare Cost and Utilization Project (HCUP). Agency for Healthcare Research and Quality. Updated April 27, 2020. www.hcup-us.ahrq.gov/db/nation/neds/nedsdbdocumentation.jsp. Accessed October 27, 2020. c For additional information about the NHEA, see Centers for Medicare & Medicaid Services (CMS). National Health Expenditure Data. CMS website. Updated December 17, 2019. www.cms.gov/Research-Statistics-Data-and-Systems/Statistics-Trends-and-Reports/NationalHealthExpendData/index.html?redirect=/NationalHealthExpendData/. Accessed February 3, 2020. d American Hospital Association. TrendWatch Chartbook, 2019. Table 4.2. Distribution of Inpatient vs. Outpatient Revenues, 1995-2017. www.aha.org/system/files/media/file/2019/11/TrendwatchChartbook-2019-Appendices.pdf. e Claritas. Claritas Demographic Profile by ZIP Code. https://claritas360.claritas.com/mybestsegments/. f American Trauma Society. Trauma Information Exchange Program (TIEP). www.amtrauma.org/page/TIEP. g MacKenzie EJ, Hoyt DB, Sacra JC, Jurkovich GJ, Carlini AR, Teitelbaum SD, et al. National inventory of hospital trauma centers. JAMA. 2003;289(12):1515-22. h American College of Surgeons Committee on Trauma, Verification, Review, and Consultation Program for Hospitals. Additional details are available at www.facs.org/quality-programs/trauma/vrc. |