|
STATISTICAL BRIEF #267
November 2020
Audrey J. Weiss, Ph.D., Marguerite L. Barrett, M.S., and William J. Freeman, Dr.PH., M.P.H. Introduction Severe hurricanes strike portions of the United States nearly every year, affecting tens of thousands of people. In order to better identify health-related emergency response needs following a hurricane, the Agency for Healthcare Research and Quality (AHRQ) conducted a series of analyses on postdisaster hospital utilization, including a recent study that described significant increases in emergency department (ED) utilization following a hurricane.1 Emergency response needs varied by clinical condition and patient age group. As an extension of that study and information provided on the HCUP Fast Stats Hurricane Impact on Hospital Use topic,2 this Healthcare Cost and Utilization Project (HCUP) Statistical Brief presents a more detailed analysis focused on ED visits for injuries following a hurricane. Statistics are presented from the 2005-2016 State Inpatient Databases (SID) and State Emergency Department Databases (SEDD) from 11 States affected by seven hurricanes (listed in the Data Source section at the end of this Statistical Brief). Counties designated by the Federal Emergency Management Agency3 as disaster areas because of the hurricane were classified based on their proximity to the hurricane:
|
|
Findings
County and prehurricane ED visit characteristics, 2005-2016 This Statistical Brief is based on all available HCUP ED utilization data (from the SID and SEDD) that cover hurricane-affected counties from 11 States: Florida, Georgia, Maine, Maryland, Massachusetts, New Jersey, New York, North Carolina, Rhode Island, South Carolina, and Vermont. Table 1 summarizes the characteristics of hurricane disaster counties included in this analysis. The table includes information on the population represented in the data for the counties affected by the seven hurricanes by county proximity to the hurricane (in the direct path of the hurricane, near the hurricane path, or remote from the hurricane path). The average prehurricane population rate of injury-related treat-and-release ED visits and the average prehurricane population rate of injury-related ED visits resulting in admission are provided for each of three age groups: 0-17 years, 18-64 years, and 65 years and older. |
| Table 1. Characteristics for hurricane disaster counties, by county proximity to the hurricane, 2005-2016 | |||
| Characteristic | County proximity to hurricane | ||
|---|---|---|---|
| Direct path | Near path | Remote | |
| Counties affected | |||
| Total number of counties affected by the 7 hurricanes | 48 | 316 | 421 |
| Counties included in analysis | |||
| Number | 21 | 184 | 139 |
| % | 43.8 | 58.2 | 33.0 |
| Population affected | |||
| Total population of counties affected by the 7 hurricanes | 15,571,789 | 73,671,930 | 38,737,408 |
| Population included in analysis | |||
| Number | 13,354,505 | 53,974,967 | 21,307,790 |
| % | 85.8 | 73.3 | 55.0 |
| Prehurricane rate* of injury-related treat-and-release ED visits (per 100,000 population) | |||
| All ages | 149.6 | 154.8 | 172.7 |
| Ages 0-17 years | 174.6 | 196.8 | 205.9 |
| Ages 18-64 years | 149.3 | 146.2 | 171.1 |
| Ages 65+ years | 110.3 | 125.2 | 132.8 |
| Prehurricane rate* of injury-related ED visits resulting in admission (per 100,000 population) | |||
| All ages | 9.3 | 9.2 | 9.1 |
| Ages 0-17 years | 3.7 | 3.2 | 3.4 |
| Ages 18-64 years | 7.9 | 7.2 | 7.7 |
| Ages 65+ years | 26.7 | 28.4 | 27.0 |
| Abbreviation: ED, emergency department * The prehurricane rate is based on the average rate for the 4 weeks immediately prior to the hurricane making landfall. Notes: Direct-path counties were those through which the hurricane traveled. Near-path counties were those not in the direct path but affected by a hurricane wind speed of 34 knots per hour or greater. Remote counties were other counties in a hurricane-affected State that were neither in the direct path nor near the path of the hurricane. Sources: Agency for Healthcare Research and Quality (AHRQ), Healthcare Cost and Utilization Project (HCUP), State Inpatient Databases (SID) and State Emergency Department Databases (SEDD), 11 States, 2005-2016; National Oceanic and Atmospheric Administration (NOAA) Best Track data | |||
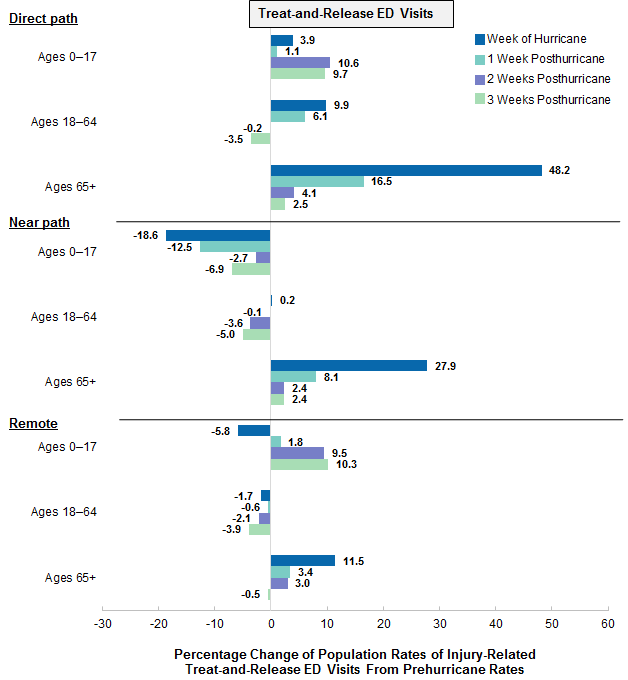
Figure 1 presents the percentage change from the prehurricane population rate of injury-related treat-and-release ED visits to the rate the week of the hurricane and 1 to 3 weeks after the hurricane, by county proximity to the hurricane (in the direct path, near the hurricane path, or remote from the path). Results are shown for three age groups: 0-17 years, 18-64 years, and 65 years and older. |
|
Figure 1. Percentage change in the population rates of injury-related treat-and-release emergency department (ED) visits after a hurricane, by county proximity to the hurricane and age group, 2005-2016
Abbreviation: ED, emergency department Figure 1 is a bar chart that shows the percentage change in the population rates of injury-related treat-and-release ED visits after a hurricane for counties that were in the direct path of the hurricane, in the near path of the hurricane, and remote from the hurricane path during the week of the hurricane and weeks 1-3 after the hurricane by age for 2005 to 2016. Data are provided in Supplemental Table 1. |
|
|
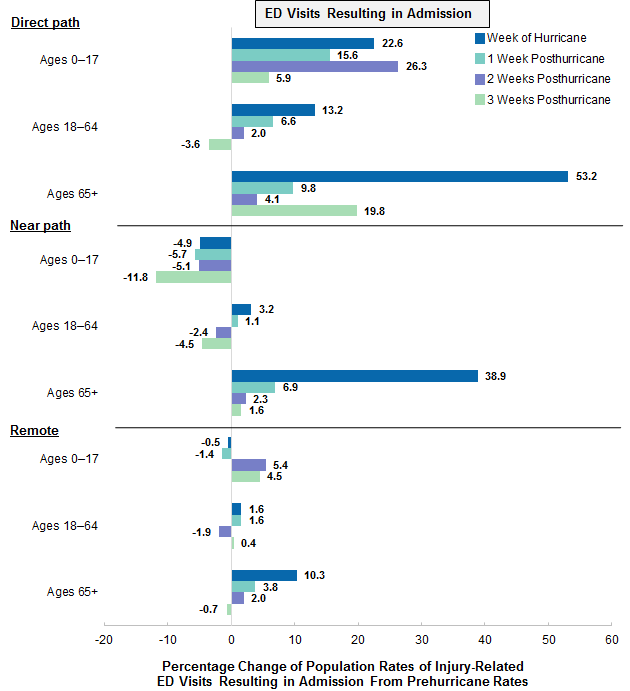
Figure 2. Percentage change in the population rates of injury-related emergency department (ED) visits resulting in admission after a hurricane, by county proximity to the hurricane and age group, 2005-2016
Abbreviation: ED, emergency department Figure 2 is a bar chart that shows the percentage change in the population rates of injury-related ED visits resulting in admission after a hurricane for counties that were in the direct path of the hurricane, in the near path of the hurricane, and remote from the hurricane path during the week of the hurricane and weeks 1-3 after the hurricane by age for 2005 to 2016. Data are provided in Supplemental Table 2. |
| Table 2. Percentage changes in the population rate of injury-related emergency department (ED) visits after a hurricane, by county proximity to the hurricane and age group, 2005-2016 | |||||||||
| County proximity to hurricane | Age group, years | Treat-and-release ED visits | ED visits resulting in admission | ||||||
|---|---|---|---|---|---|---|---|---|---|
| HW | Wk1 | Wk2 | Wk3 | HW | Wk1 | Wk2 | Wk3 | ||
| Direct path | Ages 0-17 | 10.6 | 22.6 | 15.6 | 26.3 | ||||
| Ages 18-64 | 13.2 | ||||||||
| Ages 65+ | 48.2 | 16.5 | 53.2 | 19.8 | |||||
| Near path | Ages 0-17 | -18.6 | -12.5 | -11.8 | |||||
| Ages 18-64 | |||||||||
| Ages 65+ | 27.9 | 38.9 | |||||||
| Remote path | Ages 0-17 | 10.3 | |||||||
| Ages 18-64 | |||||||||
| Ages 65+ | 11.5 | 10.3 | |||||||
| Abbreviations: ED, emergency department; HW, hurricane week (week of hurricane); Wk, week posthurricane Notes: Direct-path counties were those through which the hurricane traveled. Near-path counties were those not in the direct path but affected by a hurricane wind speed of 34 knots per hour or greater. Remote counties were other counties in a hurricane-affected State that were neither in the direct path nor near the path of the hurricane. Sources: Agency for Healthcare Research and Quality (AHRQ), Healthcare Cost and Utilization Project (HCUP), State Inpatient Databases (SID) and State Emergency Department Databases (SEDD), 11 States, 2005-2016; National Oceanic and Atmospheric Administration (NOAA) Best Track data | |||||||||
1 Heslin KC, Barrett ML, Hensche M, Pickens G, Ringel JS, Karaca Z, Owens PL. Effects of hurricanes on emergency department utilization: an analysis across 7 U.S. storms. Disaster Medicine and Public Health Preparedness. First View published October 7, 2020. https://doi.org/10.1017/dmp.2020.281. 2 Healthcare Cost and Utilization Project. HCUP Fast Stats, Hurricane Impact on Hospital Use. https://datatools.ahrq.gov/hcup-fast-stats/?type=subtab&tab=hcupfsse&count=4. Accessed March 30, 2020. 3 Federal Emergency Management Agency. Disasters. www.fema.gov/disasters. Accessed June 20, 2019. 4 National Oceanic and Atmospheric Administration. Storm Events Database. www.ncdc.noaa.gov/stormevents/ftp.jsp. Accessed February 19, 2018. 5 National Oceanic and Atmospheric Administration. Best Track Data (HURDAT2). www.nhc.noaa.gov/data/#hurdat. Accessed May 1, 2018. About Statistical Briefs Healthcare Cost and Utilization Project (HCUP) Statistical Briefs provide basic descriptive statistics on a variety of topics using HCUP administrative healthcare data. Topics include hospital inpatient, ambulatory surgery, and emergency department (ED) use and costs, quality of care, access to care, medical conditions, procedures, and patient populations, among other topics. The reports are intended to generate hypotheses that can be further explored in other research; the reports are not designed to answer in-depth research questions using multivariate methods. Data Source The estimates in this Statistical Brief are based upon data from the HCUP 2005-2016 State Inpatient Databases (SID) and State Emergency Department Databases (SEDD) for 11 States, as listed in Table 3, for seven hurricanes: |
| Table 3. Hurricanes, their years, and affected States included in analysis | ||
| Hurricane | Year | States |
|---|---|---|
| Dennis | 2005 | Florida |
| Wilma | 2005 | Florida |
| Gustav | 2008 | Florida |
| Irene | 2011 | Maine, Maryland, Massachusetts, New Jersey, New York, North Carolina, Rhode Island, Vermont |
| Isaac | 2012 | Florida |
| Sandy | 2012 | Maryland, Massachusetts, New Jersey, New York, Rhode Island |
| Matthew | 2016 | Florida, Georgia, North Carolina, South Carolina |
Counties included in this analysis were limited to those that the Federal Emergency Management Agency designated as disaster areas.a Data from the National Oceanic and Atmospheric Administration was used to classify the disaster counties into direct path, near path, and remote from the hurricane path and to determine the start date of the hurricane in each State.b,c
Supplemental sources included population denominator data for use with HCUP databases, derived from information available from Claritas, a vendor that produces population estimates and projections based on data from the U.S. Census Bureau.d Definitions Diagnoses, ICD-9-CM, and ICD-10-CM For emergency department (ED) visits that are treated and released, the first-listed diagnosis represents the condition, symptom, or problem identified in the medical record to be chiefly responsible for the ED services provided. In cases where the first-listed diagnosis is a symptom or problem, a diagnosis has not been established (confirmed) by the provider. For ED visits that result in an inpatient admission, the first-listed diagnosis is the principal diagnosis, the condition established after study to be chiefly responsible for the patient's admission to the hospital. Secondary diagnoses are conditions that coexist at the time of the ED visit or inpatient admission, that require or affect patient care treatment received or management, or that develop during the inpatient stay. All-listed diagnoses include the first-listed (principal) diagnosis plus the secondary conditions. ICD-9-CM is the International Classification of Diseases, Ninth Revision, Clinical Modification, which assigns numeric codes to diagnoses. There are approximately 14,000 ICD-9-CM diagnosis codes. ICD-10-CM is the International Classification of Diseases, Tenth Revision, Clinical Modification. In October 2015, ICD-10-CM replaced the ICD-9-CM diagnosis coding system for most inpatient and outpatient medical encounters. There are over 70,000 ICD-10-CM diagnosis codes. Case definition In this Statistical Brief, injuries were identified using the principal diagnosis for ED visits resulting in admission and the first-listed diagnosis for treat-and-release ED visits. Injuries were defined based on the ICD-9-CM and ICD-10-CM diagnosis codes shown in Table 4. For six of the hurricanes, which occurred between 2005 and 2012 (Dennis through Sandy), injuries were identified using ICD-9-CM diagnosis codes. For Hurricane Matthew, which occurred in 2016, injuries were identified using ICD-10-CM diagnosis codes. |
| Table 4. ICD-9-CM and ICD-10-CM diagnosis codes defining injury | |
| Clinical diagnosis code | Description |
|---|---|
| ICD-9-CM | |
| 800-909.2, 909.4, 909.9 | Fracture of skull, spine, trunk, upper limb, and lower limb; dislocation; sprains and strains of joints and adjacent muscles; intracranial injury, excluding those with skull fracture; internal injury of chest, abdomen, and pelvis; open wound of the head, neck, trunk, upper limb, and lower limb; injury to blood vessels; late effects of injury, poisonings, toxic effects, and other external causes, excluding those of complications of surgical and medical care and adverse effect of drugs, medicinal or biological substance |
| 910-994.9 | Superficial injury; contusion with intact skin surface; crushing injury; effects of foreign body entering through orifice; burns; injury to nerves and spinal cord; certain traumatic complications and unspecified injuries; poisoning by drugs, medicinals and biological substances; toxic effects of substances chiefly nonmedicinal as to source; other and unspecified effects of external causes |
| 995.50-995.59 | Child maltreatment syndrome |
| 995.80-995.85 | Adult maltreatment, unspecified; adult physical abuse; adult emotional/ psychological abuse; adult sexual abuse; adult neglect (nutritional); other adult abuse and neglect |
| ICD-10-CM | |
| S00 series |
|
| T07-T34 series |
|
| T36-T50 series |
|
| T51-T76 series |
|
| T79 series |
|
| Abbreviations: ICD-9-CM, International Classification of Diseases, Ninth Revision, Clinical Modification; ICD-10-CM, International Classification of Diseases, Tenth Revision, Clinical Modification Note: The injury definition used in this Statistical Brief is based on the current injury definition used by the Centers for Disease Control and Prevention (CDC) but does not include ICD-10-CM diagnosis codes O9A (obstetric injuries) or M97 and T84.04 (prosthetic injuries and complications of orthopedic devices).e These codes were not part of the CDC injury definition at the time the hurricane analyses that are reported in this Statistical Brief were conducted. | |
Types of hospitals included in HCUP State Inpatient Databases This analysis used State Inpatient Databases (SID) for all types of hospitals, including community hospitals and long-term care facilities. Community hospitals are defined as short-term, non-Federal, general, and other hospitals, excluding hospital units of other institutions (e.g., prisons). Community hospitals include obstetrics and gynecology, otolaryngology, orthopedic, cancer, pediatric, public, and academic medical center hospitals. Long-term care facilities include rehabilitation, psychiatric, and alcoholism and chemical dependency hospitals. Types of hospitals included in HCUP State Emergency Department Databases This analysis used State Emergency Department Databases (SEDD) for all types of hospitals, including community hospitals and long-term care facilities with a hospital-owned emergency department. Community hospitals are defined as short-term, non-Federal, general, and other hospitals, excluding hospital units of other institutions (e.g., prisons). Community hospitals include specialty, pediatric, public, and academic medical center hospitals. Long-term care facilities include rehabilitation, psychiatric, and alcoholism and chemical dependency hospitals. Treat-and-release ED visits and ED visits resulting in admission Treat-and-release ED visits were defined as those ED visits in which patients were treated and then released from the ED; that is, patients were not admitted to the specific hospital associated with the ED. The majority of treat-and-release ED visits involved patients who were discharged home. A small number of treat-and-release ED visits involved patients who were transferred to another acute care facility, left against medical advice, were discharged to another type of long-term or intermediate care facility (nursing home or psychiatric treatment facility), were referred to home health care, died, or were discharged alive but the destination was unknown. ED visits resulting in admission were defined as those ED visits in which patients were admitted to the same hospital at which they were seen in the ED. Unit of analysis For treat-and-release ED visits, the unit of analysis is the ED visit, not a person or patient. This means that a person who is seen in the ED multiple times in 1 year will be counted each time as a separate visit to the ED. For ED visits resulting in admission, the unit of analysis is the hospital discharge (i.e., the hospital stay), not a person or patient. This means that a person who is admitted to the hospital multiple times in 1 year will be counted each time as a separate discharge from the hospital. About HCUP The Healthcare Cost and Utilization Project (HCUP, pronounced "H-Cup") is a family of healthcare databases and related software tools and products developed through a Federal-State-Industry partnership and sponsored by the Agency for Healthcare Research and Quality (AHRQ). HCUP databases bring together the data collection efforts of State data organizations, hospital associations, and private data organizations (HCUP Partners) and the Federal government to create a national information resource of encounter-level healthcare data. HCUP includes the largest collection of longitudinal hospital care data in the United States, with all-payer, encounter-level information beginning in 1988. These databases enable research on a broad range of health policy issues, including cost and quality of health services, medical practice patterns, access to healthcare programs, and outcomes of treatments at the national, State, and local market levels. HCUP would not be possible without the contributions of the following data collection Partners from across the United States: |
|
Alaska Department of Health and Social Services
Alaska State Hospital and Nursing Home Association Arizona Department of Health Services Arkansas Department of Health California Office of Statewide Health Planning and Development Colorado Hospital Association Connecticut Hospital Association Delaware Division of Public Health District of Columbia Hospital Association Florida Agency for Health Care Administration Georgia Hospital Association Hawaii Laulima Data Alliance Hawaii University of Hawai'i at Hilo Illinois Department of Public Health Indiana Hospital Association Iowa Hospital Association Kansas Hospital Association Kentucky Cabinet for Health and Family Services Louisiana Department of Health Maine Health Data Organization Maryland Health Services Cost Review Commission Massachusetts Center for Health Information and Analysis Michigan Health & Hospital Association Minnesota Hospital Association Mississippi State Department of Health Missouri Hospital Industry Data Institute |
Montana Hospital Association Nebraska Hospital Association Nevada Department of Health and Human Services New Hampshire Department of Health & Human Services New Jersey Department of Health New Mexico Department of Health New York State Department of Health North Carolina Department of Health and Human Services North Dakota (data provided by the Minnesota Hospital Association) Ohio Hospital Association Oklahoma State Department of Health Oregon Association of Hospitals and Health Systems Oregon Office of Health Analytics Pennsylvania Health Care Cost Containment Council Rhode Island Department of Health South Carolina Revenue and Fiscal Affairs Office South Dakota Association of Healthcare Organizations Tennessee Hospital Association Texas Department of State Health Services Utah Department of Health Vermont Association of Hospitals and Health Systems Virginia Health Information Washington State Department of Health West Virginia Department of Health and Human Resources, West Virginia Health Care Authority Wisconsin Department of Health Services Wyoming Hospital Association |
|
About the SID The HCUP State Inpatient Databases (SID) are hospital inpatient databases from data organizations participating in HCUP. The SID contain the universe of the inpatient discharge abstracts in the participating HCUP States, translated into a uniform format to facilitate multistate comparisons and analyses. Together, the SID encompass more than 95 percent of all U.S. community hospital discharges. The SID can be used to investigate questions unique to one State, to compare data from two or more States, to conduct market-area variation analyses, and to identify State-specific trends in inpatient care utilization, access, charges, and outcomes. About the SEDD The HCUP State Emergency Department Databases (SEDD) include information from hospital-owned emergency departments (EDs) from data organizations participating in HCUP, translated into a uniform format to facilitate multistate comparisons and analyses. The SEDD capture the universe of records on ED visits in participating HCUP States that do not result in an admission to the same hospital (i.e., patients who are treated in the ED and then discharged, transferred to another hospital, left against medical advice, or died). The SEDD contain a core set of clinical and nonclinical information on all patients, including individuals covered by Medicare, Medicaid, or private insurance, as well as those whose stays were not expected to be covered by insurance. The SEDD can be used to investigate questions unique to one State, to compare data from two or more States, to conduct market-area variation analyses, and to identify State-specific trends in injury surveillance, emerging infections, and other conditions treated in the ED. For More Information For other information on emergency department visits and inpatient stays related to injuries, refer to the HCUP Statistical Briefs located at www.hcup-us.ahrq.gov/reports/statbriefs/sb_injuries.jsp and www.hcup-us.ahrq.gov/reports/statbriefs/sb_injurypoisoning.jsp. For additional HCUP statistics, visit:
For a detailed description of HCUP and more information on the design of the State Inpatient Databases (SID) and State Emergency Department Databases (SEDD), please refer to the following database documentation: Agency for Healthcare Research and Quality. Overview of the State Inpatient Databases (SID). Healthcare Cost and Utilization Project (HCUP). Rockville, MD: Agency for Healthcare Research and Quality. Updated November 2019. www.hcup-us.ahrq.gov/sidoverview.jsp. Accessed February 3, 2020. Agency for Healthcare Research and Quality. Overview of the State Emergency Department Databases (SEDD). Healthcare Cost and Utilization Project (HCUP). Rockville, MD: Agency for Healthcare Research and Quality. Updated January 2020. www.hcup-us.ahrq.gov/seddoverview.jsp. Accessed February 3, 2020. For a more detailed description of the study that supported the analyses used in this HCUP Statistical Brief, please see:
Suggested Citation Weiss AJ (IBM Watson Health), Barrett ML (M.L. Barrett, Inc.), Freeman WJ (AHRQ). Impact of Hurricanes on Injury-Related Emergency Department Visits, 2005-2016. HCUP Statistical Brief #267. November 2020. Agency for Healthcare Research and Quality, Rockville, MD. www.hcup-us.ahrq.gov/reports/statbriefs/sb267-Hurricanes-Injuries-ED-Visits-2005-2016.pdf. Acknowledgments This HCUP Statistical Brief was funded through the Patient-Centered Outcomes Research Trust Fund as part of the partnership project titled Assessing and Predicting Medical Needs in a Disaster among the Office of the Assistant Secretary for Planning and Evaluation, the Office of the Assistant Secretary for Preparedness and Response, and AHRQ. For more information, see: www.aspe.hhs.gov/assessing-and-predicting-medical-needs-disaster. The authors would like to acknowledge the contributions of Thomas Flottemesch, Ph.D. (while with IBM Watson Health), Molly Hensche, M.S. (IBM Watson Health), Kevin C. Heslin, Ph.D. (while with AHRQ), Zeynal Karaca, Ph.D. (AHRQ), Pamela L. Owens, Ph.D. (AHRQ), Gary Pickens, Ph.D. (IBM Watson Health), Jeanne S. Ringel, Ph.D. (RAND), and Minya Sheng, M.S. (IBM Watson Health). *** AHRQ welcomes questions and comments from readers of this publication who are interested in obtaining more information about access, cost, use, financing, and quality of healthcare in the United States. We also invite you to tell us how you are using this Statistical Brief and other HCUP data and tools, and to share suggestions on how HCUP products might be enhanced to further meet your needs. Please email us at hcup@ahrq.gov or send a letter to the address below:Joel W. Cohen, Ph.D., Director Center for Financing, Access and Cost Trends Agency for Healthcare Research and Quality 5600 Fishers Lane Rockville, MD 20857 This Statistical Brief was posted online on November 24, 2020. a Federal Emergency Management Agency. Disasters. www.fema.gov/disasters. Accessed June 20, 2019. b National Oceanic and Atmospheric Administration. Storm Events Database. www.ncdc.noaa.gov/stormevents/ftp.jsp. Accessed February 19, 2018. c National Oceanic and Atmospheric Administration. Best Track Data (HURDAT2). www.nhc.noaa.gov/data/#hurdat. Accessed May 1, 2018. www.nhc.noaa.gov/data/hurdat/hurdat2-1851-2017-050118.txt. Accessed April 9, 2018. d Claritas. Claritas Demographic Profile by ZIP Code. https://claritas360.claritas.com/mybestsegments/. e Hedegaard H, Johnson RL, Warner M, Chen L-H, Annest JL. Proposed Framework for Presenting Injury Data Using the International Classification of Disease Tenth Revision, Clinical Modification (ICD-10-CM) Diagnosis Codes. National Health Statistics Report #89. January 22, 2016. Centers for Disease Control and Prevention, National Center for Health Statistics. www.cdc.gov/nchs/data/nhsr/nhsr089.pdf. Accessed July 26, 2019. |
| Supplemental Table 1. Percentage change in the population rates of injury-related treat-and-release emergency department (ED) visits after a hurricane, by county proximity to the hurricane and age group, 2005-2016, for data presented in Figure 1 | ||||
| Injury-related ED treat-and-release visits | Week of hurricane | 1 week posthurricane | 2 weeks posthurricane | 3 weeks posthurricane |
|---|---|---|---|---|
| Direct path | ||||
| Age, years | ||||
| 0-17 | 3.9 | 1.1 | 10.6 | 9.7 |
| 18-64 | 9.9 | 6.1 | -0.2 | -3.5 |
| 65+ | 48.2 | 16.5 | 4.1 | 2.5 |
| Near path | ||||
| Age, years | ||||
| 0-17 | -18.6 | -12.5 | -2.7 | -6.9 |
| 18-64 | 0.2 | -0.1 | -3.6 | -5.0 |
| 65+ | 27.9 | 8.1 | 2.4 | 2.4 |
| Remote path | ||||
| Age, years | ||||
| 0-17 | -5.8 | 1.8 | 9.5 | 10.3 |
| 18-64 | -1.7 | -0.6 | -2.1 | -3.9 |
| 65+ | 11.5 | 3.4 | 3.0 | -0.5 |
| Supplemental Table 2. Percentage change in the population rates of injury-related emergency department (ED) visits resulting in admission after a hurricane, by county proximity to the hurricane and age group, 2005-2016, for data presented in Figure 2 | ||||
| Injury-related ED visits resulting in admission | Week of hurricane | 1 week posthurricane | 2 weeks posthurricane | 3 weeks posthurricane |
|---|---|---|---|---|
| Direct path | ||||
| Age, years | ||||
| 0-17 | 22.6 | 15.6 | 26.3 | 5.9 |
| 18-64 | 13.2 | 6.6 | 2.0 | -3.6 |
| 65+ | 53.2 | 9.8 | 4.1 | 19.8 |
| Near path | ||||
| Age, years | ||||
| 0-17 | -4.9 | -5.7 | -5.1 | -11.8 |
| 18-64 | 3.2 | 1.1 | -2.4 | -4.5 |
| 65+ | 38.9 | 6.9 | 2.3 | 1.6 |
| Remote path | ||||
| Age, years | ||||
| 0-17 | -0.5 | -1.4 | 5.4 | 4.5 |
| 18-64 | 1.6 | 1.6 | -1.9 | 0.4 |
| 65+ | 10.3 | 3.8 | 2.0 | -0.7 |