|
STATISTICAL BRIEF #266
November 2020
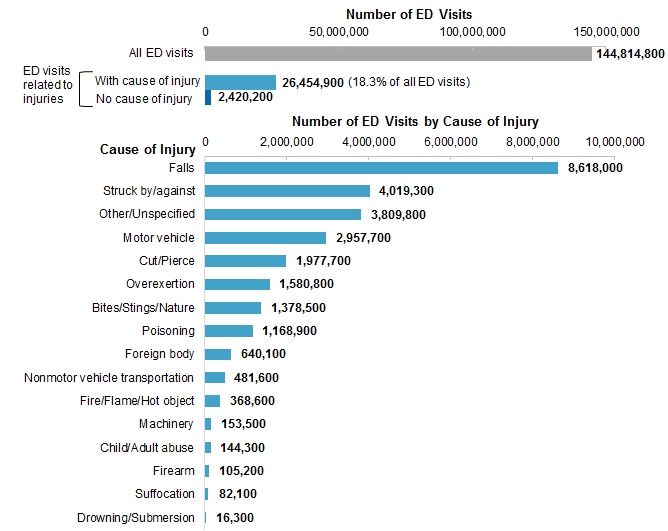
Audrey J. Weiss, Ph.D., Lawrence D. Reid, Ph.D., M.P.H., and Marguerite L. Barrett, M.S. Introduction Injuries are common and can have many causes, such as falls, cuts, motor vehicle accidents, bites, poisoning, and hot objects. In 2017, the Centers for Disease Control and Prevention estimated unintentional falls were the leading cause of injuries treated in the emergency department (ED) for all age groups except ages 10-24 years, for which being struck by or against something was the leading cause of ED visits related to injuries.1 If severe or untreated, injuries can result in death. In 2018, unintentional injuries were the leading cause of death among people aged 1-44 years.2 However, the majority of injuries are nonfatal, and many are treated in EDs. In 2014, the rate of ED visits related to injuries was approximately 82 per 1,000 population, with less than 10 percent of these visits resulting in the patient being admitted to the hospital.3 This Healthcare Cost and Utilization Project (HCUP) Statistical Brief presents statistics on ED visits related to injuries using the 2017 Nationwide Emergency Department Sample (NEDS). The number of ED visits related to each cause of injury is presented, along with the percentage of those visits that resulted in the patient being admitted to the same hospital or transferred to another hospital. The population rate of ED visits related to injuries is presented by select population characteristics for all injury causes and for the five most common specific causes of injury. Finally, the distribution of primary expected payer for ED visits related to injuries is provided for all injury causes and for the five most common specific causes of injury. Because of the large sample size of the NEDS data, small differences can be statistically significant. Thus, only differences greater than or equal to 10 percent are noted in the text. Findings Overall emergency department (ED) visits related to injuries, by cause of injury, 2017 Figure 1 presents the total number of ED visits related to injuries by the cause of injury in 2017. |
|
Figure 1. Number of ED visits related to injuries, by cause of injury, 2017
Abbreviation: ED, emergency department Two bar charts that show (1) the total number of ED visits in 2017 and (2) the total number of ED visits related to injuries by the cause of injury in 2017. Number of ED visits: There were 144,814,800 ED visits in 2017. Of the ED visits related to injuries, 26,454,900 (18.3% of all ED visits) included a cause of injury, and 2,420,200 included no cause of injury. Number of ED visits by cause of injury: falls: 8,618,000; struck by/against: 4,019,300; other/unspecified: 3,809,800; motor vehicle: 2,957,700; cut/pierce: 1,977,700; overexertion: 1,580,800; bites/stings/nature: 1,378,500; poisoning: 1,168,900; foreign body: 640,100; nonmotor vehicle transportation: 481,600; fire/flame/hot object: 368,600; machinery: 153,500; child/adult abuse: 144,300; firearm: 105,200; suffocation: 82,100; drowning/submersion: 16,300. |
|
|
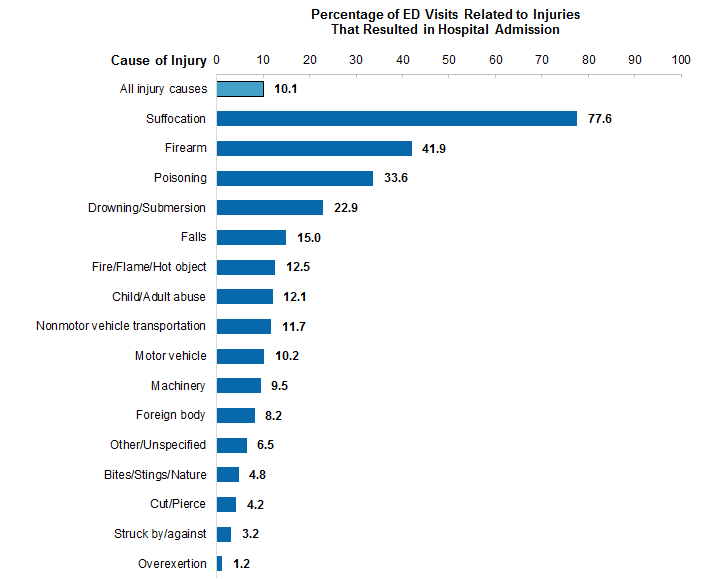
Figure 2. Percentage of ED visits related to injuries that resulted in hospital admission, by cause of injury, 2017
Abbreviation: ED, emergency department Bar chart that shows the percentage of ED visits related to injuries that resulted in hospital admission by the cause of injury in 2017, for all injury causes and for specific causes of injury. All injury causes: 10.1%; suffocation: 77.6%; firearm: 41.9%; poisoning: 33.6%; drowning/submersion: 22.9%; falls: 15.0%; fire/flame/hot object: 12.5%; child/adult abuse: 12.1%; nonmotor vehicle transportation: 11.7%; motor vehicle: 10.2%; machinery: 9.5%; foreign body: 8.2%; other/unspecified: 6.5%; bites/stings/nature: 4.8%; cut/pierce: 4.2%; struck by/against: 3.2%; overexertion: 1.2%. |
Table 1 presents the population rate of ED visits related to injuries, for all injury causes and for the five most common specific causes of injury, by population characteristics in 2017. The five most common specific injury causes account for approximately 70 percent of the 26.5 million ED visits related to injuries for which a cause of injury was reported. |
| Table 1. Rate of ED visits related to injuries per 100,000 population, by most common specific injury causes, and by population characteristics, 2017 | ||||||
| Characteristic | All injury causes | Falls | Struck by/against | Motor vehicle | Cut/pierce | Over-exertion |
|---|---|---|---|---|---|---|
| Number | 26,454,900 | 8,618,000 | 4,019,300 | 2,957,700 | 1,977,700 | 1,580,800 |
| Rate per 100,000 population | 8,122.0 | 2,645.8 | 1,234.0 | 908.1 | 607.2 | 485.3 |
| Age | ||||||
| 0-17 years | 8,493.5 | 2,757.0 | 1,790.3 | 479.9 | 498.9 | 475.1 |
| 18-29 years | 9,091.3 | 1,359.1 | 1,686.5 | 1,680.8 | 983.5 | 643.5 |
| 30-44 years | 7,709.9 | 1,468.8 | 1,242.7 | 1,163.5 | 764.3 | 630.3 |
| 45-64 years | 6,599.4 | 2,127.4 | 796.7 | 828.4 | 509.7 | 422.1 |
| 65+ years | 9,589.5 | 6,165.1 | 662.2 | 524.2 | 332.0 | 258.0 |
| Sex | ||||||
| Male | 8,424.5 | 2,359.8 | 1,465.9 | 897.0 | 785.2 | 486.8 |
| Female | 7,827.4 | 2,923.1 | 1,008.8 | 918.5 | 434.4 | 483.9 |
| Community-level income | ||||||
| Quartile 1 (lowest) | 9,997.8 | 2,967.8 | 1,550.5 | 1,205.1 | 724.4 | 588.8 |
| Quartile 2 | 8,527.2 | 2,751.2 | 1,289.3 | 941.6 | 642.9 | 527.7 |
| Quartile 3 | 7,261.6 | 2,458.0 | 1,080.4 | 800.6 | 552.3 | 443.7 |
| Quartile 4 (highest) | 6,138.3 | 2,240.4 | 930.0 | 621.8 | 470.0 | 352.6 |
| Location of patient's residence | ||||||
| Metro | 7,756.9 | 2,529.4 | 1,188.8 | 899.7 | 570.2 | 460.1 |
| Rural adjacent | 10,359.0 | 3,325.8 | 1,519.3 | 992.1 | 816.8 | 657.6 |
| Rural remote | 9,682.9 | 3,252.7 | 1,388.2 | 842.8 | 821.3 | 585.1 |
| Abbreviation: ED, emergency department Notes: The same ED visit may be counted more than once for each different injury cause. Community-level income was missing for less than 2% of ED visits; location of patient's residence was missing for less than 1% of ED visits. The number of ED visits was rounded to the nearest hundred. Source: Agency for Healthcare Research and Quality (AHRQ), Healthcare Cost and Utilization Project (HCUP), Nationwide Emergency Department Sample (NEDS), 2017 | ||||||
|
|
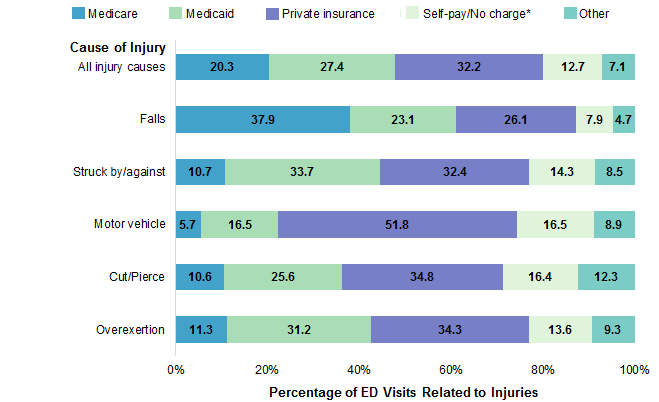
Figure 3. Distribution of primary expected payer of ED visits related to injuries, by most common specific injury cause, 2017
Abbreviation: ED, emergency department Bar chart that shows the distribution of primary expected payer for ED visits related to injuries, for all injury causes and for the five most common specific causes of injury, in 2017. All injury causes: Medicare: 20.3%; Medicaid: 27.4%; private insurance: 32.2%; self-pay/no charge: 12.7%; other: 7.1%. Falls: Medicare: 37.9%; Medicaid: 23.1%; private insurance: 26.1%; self-pay/no charge: 7.9%; other: 4.7%. Struck by/against: Medicare: 10.7%; Medicaid: 33.7%; private insurance: 32.4%; self-pay/no charge: 14.3%; other: 8.5%. Motor vehicle: Medicare: 5.7%; Medicaid: 16.5%; private insurance: 51.8%; self-pay/no charge: 16.5%; other: 8.9%. Cut/pierce: Medicare: 10.6%; Medicaid: 25.6%; private insurance: 34.8%; self-pay/no charge: 16.4%; other: 12.3%. Overexertion: Medicare: 11.3%; Medicaid: 31.2%; private insurance: 34.3%; self-pay/no charge: 13.6%; other: 9.3%. |
References 1 Centers for Disease Control and Prevention. National Estimates of the 10 Leading Causes of Nonfatal Injuries Treated in Hospital Emergency Departments, United States - 2017. www.cdc.gov/injury/wisqars/pdf/leading_causes_of_nonfatal_injury_2017-508.pdf. Accessed June 4, 2020. 2 Centers for Disease Control and Prevention. 10 Leading Causes of Death by Age Group, United States - 2018. www.cdc.gov/injury/images/lc-charts/leading_causes_of_death_by_age_group_2018_1100w850h.jpg. Accessed June 4, 2020. 3 Moore BJ, Stocks C, Owens PL. Trends in Emergency Department Visits, 2006-2014. HCUP Statistical Brief #227. September 2017. Agency for Healthcare Research and Quality, Rockville, MD. www.hcup-us.ahrq.gov/reports/statbriefs/sb227-Emergency-Department-Visit-Trends.pdf. Accessed April 9, 2020. About Statistical Briefs Healthcare Cost and Utilization Project (HCUP) Statistical Briefs provide basic descriptive statistics on a variety of topics using HCUP administrative healthcare data. Topics include hospital inpatient, ambulatory surgery, and emergency department use and costs, quality of care, access to care, medical conditions, procedures, and patient populations, among other topics. The reports are intended to generate hypotheses that can be further explored in other research; the reports are not designed to answer in-depth research questions using multivariate methods. Data Source The estimates in this Statistical Brief are based upon data from the HCUP 2017 Nationwide Emergency Department Sample (NEDS). Supplemental sources included population denominator data for use with HCUP databases, derived from information available from the U.S. Census Bureau and Claritas, a vendor that produces population estimates and projections based on data from the U.S. Census Bureau.a,b Definitions Diagnoses, ICD-10-CM, and Clinical Classifications Software Refined (CCSR) for ICD-10-CM Diagnoses For emergency department (ED) visits that are treated and released, the first-listed diagnosis represents the condition, symptom, or problem identified in the medical record to be chiefly responsible for the emergency department (ED) services provided. In cases where the first-listed diagnosis is a symptom or problem, a diagnosis has not been established (confirmed) by the provider. For ED visits that result in an inpatient admission, the first-listed diagnosis is the principal diagnosis, the condition established after study to be chiefly responsible for the patient's admission to the hospital. Secondary diagnoses are conditions that coexist at the time of the ED visit or inpatient admission, that require or affect patient care treatment received or management, or that develop during the inpatient stay. All-listed diagnoses include the first-listed (principal) diagnosis plus the secondary conditions. ICD-10-CM is the International Classification of Diseases, Tenth Revision, Clinical Modification. In October 2015, ICD-10-CM replaced the International Classification of Diseases, Ninth Revision, Clinical Modification (ICD-9-CM) diagnosis coding system for most inpatient and outpatient medical encounters. There are over 70,000 ICD-10-CM diagnosis codes. The CCSR aggregates ICD-10-CM diagnosis codes into a manageable number of clinically meaningful categories.c The CCSR is intended to be used analytically to examine patterns of healthcare in terms of cost, utilization, and outcomes; rank utilization by diagnoses; and risk-adjust by clinical condition. The CCSR capitalizes on the specificity of the ICD-10-CM coding scheme and allows ICD-10-CM codes to be classified in more than one category. Approximately 10 percent of diagnosis codes are associated with more than one CCSR category because the diagnosis code documents either multiple conditions or a condition along with a common symptom or manifestation. ICD-10-CM coding definitions for each CCSR category presented in this Statistical Brief can be found in the CCSR reference file, available at www.hcup-us.ahrq.gov/toolssoftware/ccsr/ccs_refined.jsp#download. Case definition ED visits related to injuries were defined using any-listed ICD-10-CM diagnosis code in the following CCSR, as listed in Table 2. |
| Table 2. Clinical Classifications Software Refined (CCSR) for ICD-10-CM Diagnoses defining emergency department visits related to injuries | |
| CCSR | Description of CCSR |
|---|---|
| INJ001 | Fracture of head and neck, initial encounter |
| INJ002 | Fracture of the spine and back, initial encounter |
| INJ003 | Fracture of torso, initial encounter |
| INJ004 | Fracture of the upper limb, initial encounter |
| INJ005 | Fracture of the lower limb (except hip), initial encounter |
| INJ006 | Fracture of the neck of the femur (hip), initial encounter |
| INJ007 | Dislocations, initial encounter |
| INJ008 | Traumatic brain injury (TBI); concussion, initial encounter |
| INJ009 | Spinal cord injury (SCI), initial encounter |
| INJ010 | Internal organ injury, initial encounter |
| INJ011 | Open wounds of head and neck, initial encounter |
| INJ012 | Open wounds to limbs, initial encounter |
| INJ013 | Open wounds of trunk, initial encounter |
| INJ014 | Amputation of a limb, initial encounter |
| INJ015 | Amputation of other body parts, initial encounter |
| INJ016 | Injury to blood vessels, initial encounter |
| INJ017 | Superficial injury; contusion, initial encounter |
| INJ018 | Crushing injury, initial encounter |
| INJ019 | Burn and corrosion, initial encounter |
| INJ020 | Effect of foreign body entering opening, initial encounter |
| INJ021 | Effect of other external causes, initial encounter |
| INJ022 | Poisoning by drugs, initial encounter |
| INJ023 | Toxic effects, initial encounter |
| INJ024 | Sprains and strains, initial encounter |
| INJ025 | Injury to nerves, muscles and tendons, initial encounter |
| INJ026 | Other specified injury, initial encounter |
| INJ027 | Other unspecified injury, initial encounter |
| INJ032 | Maltreatment/abuse |
| Abbreviations: CCSR, Clinical Classifications Software Refined (CCSR) for ICD-10-CM Diagnoses; ICD-10-CM, International Classification of Diseases, Tenth Revision, Clinical Modification | |
Mechanism or cause of the injury was identified and defined based on the ICD-10-CM external cause of injury matrix developed by the Centers for Disease Control and Prevention (CDC), version updated December 2019. This coding is available on the CDC website at www.cdc.gov/nchs/injury/injury_tools.htm. Certain ICD-10-CM diagnosis codes that begin with the letter T are included in the definition of an injury and an external cause. Most of these T codes are poisoning by drugs, medicaments, and biological substances. Other T codes include asphyxiation; effects of foreign body entering through natural orifice; and adult and child abuse, neglect, and other maltreatment.
Of the 144.8 million ED visits in 2017, 28.9 million indicated an injury. Of these, 26.5 million (91.6 percent) included at least one external cause of injury code and 2.4 million (8.4 percent) did not include any external cause of injury codes. Some ED visits related to injuries included more than one code identifying the external cause of injury; thus, more than one cause of injury may be documented for a single ED visit. Of the 26.5 million ED visits related to injuries with at least one external cause of injury code, 25.1 million (94.9 percent) had only one external cause code and 1.3 million (5.1 percent) had more than one external cause code. The analysis in this Statistical Brief included all codes that identified an external cause of injury; thus, the same ED visit may be counted more than once. Injury causes from the CDC's ICD-10-CM external cause of injury matrix were grouped into a smaller number of categories for reporting in this Statistical Brief, as shown in Table 3. |
| Table 3. CDC external cause of injury categories and grouping in this Statistical Brief | |
| Original CDC categories for cause of injury | Grouped causes for this Statistical Brief |
|---|---|
| Cut/Pierce | Cut/Pierce |
| Drowning/Submersion | Drowning/Submersion |
| Falls | Falls |
| Fire/Flame | Fire/Flame/Hot object |
| Hot object/substance | |
| Firearm | Firearm |
| Machinery | Machinery |
| MVT-Occupant | Motor vehicle |
| MVT-Motorcyclist | |
| MVT-Pedal cyclist | |
| MVT-Pedestrian | |
| MVT-Other | |
| MVT-Unspecified | |
| Motor vehicle-Nontraffic | |
| Pedal cyclist, other | Nonmotor vehicle transportation |
| Pedestrian, other | |
| Other land transport | |
| Other transport | |
| Bites and stings, nonvenomous | Bites/Stings/Nature |
| Bites and stings, venomous | |
| Natural/environmental, other | |
| Overexertion | Overexertion |
| Poisoning: Drug | Poisoning |
| Poisoning: Nondrug | |
| Struck by/against | Struck by/against |
| Suffocation | Suffocation |
| Other specified, child/adult abuse | Child/Adult abuse |
| Other specified, foreign body | Foreign body |
| Other specified, classifiable | Other/Unspecified |
| Other specified, not elsewhere classifiable | |
| Unspecified | |
| Abbreviations: CDC, Centers for Disease Control and Prevention; MVT, motor vehicle traffic Source of CDC external cause of injury mechanism classification: Hedegaard H, Johnson RL, Garnett MF, Thomas KE. The International Classification of Diseases 10th Revision, Clinical Modification (ICD-10-CM) External Cause-of-Injury Framework for Categorizing Mechanism and Intent of Injury. Table A. Basic structure of the 2014 proposed ICD-10-CM external cause-of-injury matrix for categorizing mechanism and intent of injury. National Health Statistics Reports #136. December 30, 2019. www.cdc.gov/nchs/data/nhsr/nhsr136-508.pdf. Accessed July 20, 2020. | |
Types of hospitals included in the HCUP Nationwide Emergency Department Sample The Nationwide Emergency Department Sample (NEDS) is based on ED data from community acute care hospitals, which are defined as short-term, non-Federal, general, and other specialty hospitals available to the public. Included among community hospitals are pediatric institutions and hospitals that are part of academic medical centers. Excluded are long-term care facilities such as rehabilitation, psychiatric, and alcoholism and chemical dependency hospitals. Hospitals included in the NEDS have EDs, and no more than 90 percent of their ED visits result in admission. Unit of analysis The unit of analysis is the ED visit, not a person or patient. This means that a person who is seen in the ED multiple times in 1 year will be counted each time as a separate visit in the ED. Location of patients' residence Place of residence is based on the rural-urban continuum codes (RUCC) for U.S. counties developed by the United States Department of Agriculture (USDA).d For this Statistical Brief, we collapsed the RUCC codes into the following three categories: Metropolitan (metro) area:
Community-level income is based on the median household income of the patient's ZIP Code of residence. Quartiles are defined so that the total U.S. population is evenly distributed. Cut-offs for the quartiles are determined annually using ZIP Code demographic data obtained from Claritas, a vendor that produces population estimates and projections based on data from the U.S. Census Bureau.e The value ranges for the income quartiles vary by year. Patients in the first quartile are designated as having low income, and patients in the upper three quartiles are designated as having not low income. The income quartile is missing for patients who are homeless or foreign. Expected payer To make coding uniform across all HCUP data sources, the primary expected payer for the ED visit combines detailed categories into general groups:
For this Statistical Brief, when more than one payer is listed for an ED visit, the first-listed payer is used. ED visits resulting in admission or transfer Disposition of the patient at discharge from the ED was used to identify ED visits resulting in admission or transferred to another facility. ED visits resulting in admission to the same hospital were those patients initially seen in the ED who were then admitted to the specific hospital associated with that ED. ED visits that were transferred to another facility included those patients who were transferred to another acute care facility. About HCUP The Healthcare Cost and Utilization Project (HCUP, pronounced "H-Cup") is a family of healthcare databases and related software tools and products developed through a Federal-State-Industry partnership and sponsored by the Agency for Healthcare Research and Quality (AHRQ). HCUP databases bring together the data collection efforts of State data organizations, hospital associations, and private data organizations (HCUP Partners) and the Federal government to create a national information resource of encounter-level healthcare data. HCUP includes the largest collection of longitudinal hospital care data in the United States, with all-payer, encounter-level information beginning in 1988. These databases enable research on a broad range of health policy issues, including cost and quality of health services, medical practice patterns, access to healthcare programs, and outcomes of treatments at the national, State, and local market levels. HCUP would not be possible without the contributions of the following data collection Partners from across the United States: |
|
Alaska Department of Health and Social Services
Alaska State Hospital and Nursing Home Association Arizona Department of Health Services Arkansas Department of Health California Office of Statewide Health Planning and Development Colorado Hospital Association Connecticut Hospital Association Delaware Division of Public Health District of Columbia Hospital Association Florida Agency for Health Care Administration Georgia Hospital Association Hawaii Laulima Data Alliance Hawaii University of Hawai'i at Hilo Illinois Department of Public Health Indiana Hospital Association Iowa Hospital Association Kansas Hospital Association Kentucky Cabinet for Health and Family Services Louisiana Department of Health Maine Health Data Organization Maryland Health Services Cost Review Commission Massachusetts Center for Health Information and Analysis Michigan Health & Hospital Association Minnesota Hospital Association Mississippi State Department of Health Missouri Hospital Industry Data Institute |
Montana Hospital Association Nebraska Hospital Association Nevada Department of Health and Human Services New Hampshire Department of Health & Human Services New Jersey Department of Health New Mexico Department of Health New York State Department of Health North Carolina Department of Health and Human Services North Dakota (data provided by the Minnesota Hospital Association) Ohio Hospital Association Oklahoma State Department of Health Oregon Association of Hospitals and Health Systems Oregon Office of Health Analytics Pennsylvania Health Care Cost Containment Council Rhode Island Department of Health South Carolina Revenue and Fiscal Affairs Office South Dakota Association of Healthcare Organizations Tennessee Hospital Association Texas Department of State Health Services Utah Department of Health Vermont Association of Hospitals and Health Systems Virginia Health Information Washington State Department of Health West Virginia Department of Health and Human Resources, West Virginia Health Care Authority Wisconsin Department of Health Services Wyoming Hospital Association |
|
About the NEDS The HCUP Nationwide Emergency Department Sample (NEDS) is a unique and powerful database that yields national estimates of emergency department (ED) visits. The NEDS was constructed using records from both the HCUP State Emergency Department Databases (SEDD) and the State Inpatient Databases (SID). The SEDD capture information on ED visits that do not result in an admission (i.e., patients who were treated in the ED and then released from the ED, or patients who were transferred to another hospital); the SID contain information on patients initially seen in the ED and then admitted to the same hospital. The NEDS was created to enable analyses of ED utilization patterns and support public health professionals, administrators, policymakers, and clinicians in their decision making regarding this critical source of care. The NEDS is produced annually beginning in 2006. Over time, the sampling frame for the NEDS has changed; thus, the number of States contributing to the NEDS varies from year to year. The NEDS is intended for national estimates only; no State-level estimates can be produced. The unweighted sample size for the 2017 NEDS is 33,506,645 (weighted, this represents 144,814,803 ED visits). For More Information For other information on inpatient stays and emergency department visits related to injuries, refer to the HCUP Statistical Briefs located at www.hcup-us.ahrq.gov/reports/statbriefs/sb_injurypoisoning.jsp and www.hcup-us.ahrq.gov/reports/statbriefs/sb_injuries.jsp. For additional HCUP statistics, visit:
For a detailed description of HCUP and more information on the design of the Nationwide Emergency Department Sample (NEDS), please refer to the following database documentation: Agency for Healthcare Research and Quality. Overview of the Nationwide Emergency Department Sample (NEDS). Healthcare Cost and Utilization Project (HCUP). Rockville, MD: Agency for Healthcare Research and Quality. Updated December 2019. www.hcup-us.ahrq.gov/nedsoverview.jsp. Accessed February 3, 2020. Suggested Citation Weiss AJ (IBM Watson Health), Reid LD (AHRQ), Barrett ML (M.L. Barrett, Inc.). Overview of Emergency Department Visits Related to Injuries, by Cause of Injury, 2017. HCUP Statistical Brief #266. November 2020. Agency for Healthcare Research and Quality, Rockville, MD. www.hcup-us.ahrq.gov/reports/statbriefs/sb266-Injuries-Causes-ED-Visits-2017.pdf. Acknowledgments The authors would like to acknowledge the contributions of Minya Sheng of IBM Watson Health. *** AHRQ welcomes questions and comments from readers of this publication who are interested in obtaining more information about access, cost, use, financing, and quality of healthcare in the United States. We also invite you to tell us how you are using this Statistical Brief and other HCUP data and tools, and to share suggestions on how HCUP products might be enhanced to further meet your needs. Please email us at hcup@ahrq.gov or send a letter to the address below:Joel W. Cohen, Ph.D., Director Center for Financing, Access and Cost Trends Agency for Healthcare Research and Quality 5600 Fishers Lane Rockville, MD 20857 This Statistical Brief was posted online on November 17, 2020. a Barrett M, Coffey R, Levit K. Population Denominator Data Sources and Data for Use with HCUP Databases (Updated with 2018 Population Data). HCUP Methods Series Report #2019-02. October 24, 2019. U.S. Agency for Healthcare Research and Quality. www.hcup-us.ahrq.gov/reports/methods/2019-02.pdf. Accessed February 3, 2020. b Claritas. Claritas Demographic Profile by ZIP Code. https://claritas360.claritas.com/mybestsegments/. c Agency for Healthcare Research and Quality. HCUP Clinical Classifications Software Refined (CCSR) for ICD-10-CM Diagnoses. Healthcare Cost and Utilization Project (HCUP). Agency for Healthcare Research and Quality. Updated January 2020. www.hcup-us.ahrq.gov/toolssoftware/ccsr/ccs_refined.jsp. Accessed February 27, 2020. d United States Department of Agriculture. Rural-Urban Continuum Codes. www.ers.usda.gov/data-products/rural-urban-continuum-codes/. Accessed February 27, 2020. e Claritas. Claritas Demographic Profile by ZIP Code. https://claritas360.claritas.com/mybestsegments/. |