|
STATISTICAL BRIEF #265
October 2020
Zeynal Karaca, Ph.D., and Kathryn R. Fingar, Ph.D., M.P.H. Introduction A shift from traditional fee-for-service-based to value-based payments has incentivized hospitals and health systems to integrate, allowing them to better respond to new healthcare delivery and payment models.1,2 Rural hospitals have lower profitability than their urban counterparts and are more vulnerable to closure.2 System affiliation may be especially beneficial for rural hospitals by giving them access to shared resources and technologies.2 Conceptually, integration may improve the value and quality of hospital care and patient outcomes.3 However, integration also may result in eliminating unprofitable service lines, leaving gaps in care for vulnerable populations.4 Understanding the landscape, characteristics, and outcomes of inpatient stays across the U.S. in health system-affiliated versus unaffiliated hospitals in urban and rural areas is important as health system affiliation continues to become more common.5 This Healthcare Cost and Utilization Project (HCUP) Statistical Brief presents statistics on inpatient stays at rural and metropolitan hospitals affiliated and unaffiliated with health systems using the 2016 State Inpatient Databases (SID) for 47 States and the District of Columbia. Community nonrehabilitation general acute care hospitals were classified as health system affiliated or unaffiliated using data from the Agency for Healthcare Research and Quality's (AHRQ's) 2016 Compendium of U.S. Health Systems.6 The compendium focuses on integration between hospitals and physicians (vertical integration), rather than on hospital mergers (horizontal integration). Only health systems with at least one community nonrehabilitation general acute care hospital in the Compendium that linked to a hospital in the SID are included in this analysis. This Statistical Brief describes the distribution of general acute care hospitals and inpatient stays across U.S. health systems. Second, the percentage of hospitals and of inpatient stays at hospitals that were affiliated with a health system is shown for rural and metro areas across nine census divisions. Finally, the characteristics of stays at system-affiliated hospitals are compared with those at unaffiliated hospitals, overall and by rural/metro location of the hospital. Because of the large sample size of the SID data, small differences can be statistically significant. Thus, only percentage differences greater than or equal to 10 percent are discussed in the text. Findings Distribution of hospitals and inpatient stays across health systems in 47 States and the District of Columbia, 2016 Figure 1 displays the percentage of general acute care hospitals that were affiliated with a health system in 2016 and the percentage of inpatient stays at system-affiliated hospitals. |
|
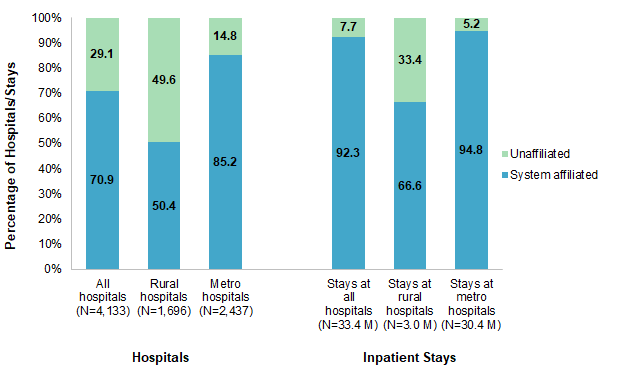
Figure 1. Health system affiliation of hospitals and inpatient stays, 2016
Abbreviation: M, million Figure 1 is a bar chart that shows the percentage of general acute care hospitals in 2016 that were affiliated with a health system versus unaffiliated and the percentage of inpatient stays at affiliated versus unaffiliated hospitals, for all hospitals/hospital stays, rural hospitals/rural hospital stays, and metro hospitals/metro hospital stays. Percentage of hospitals: all hospitals (N=4,133): 70.9% affiliated, 29.1% unaffiliated; rural hospitals (N=1,696): 50.4% affiliated, 49.6% unaffiliated; metro hospitals (N=2,437): 85.2% affiliated, 14.8% unaffiliated. Percentage of stays: all hospital stays (N=33.4 M): 92.3% affiliated, 7.7% unaffiliated; rural hospital stays (N=3.0 M): 66.6% affiliated, 33.4% unaffiliated; metro hospital stays (N=30.4 M): 94.8% affiliated, 5.2% unaffiliated. |
|
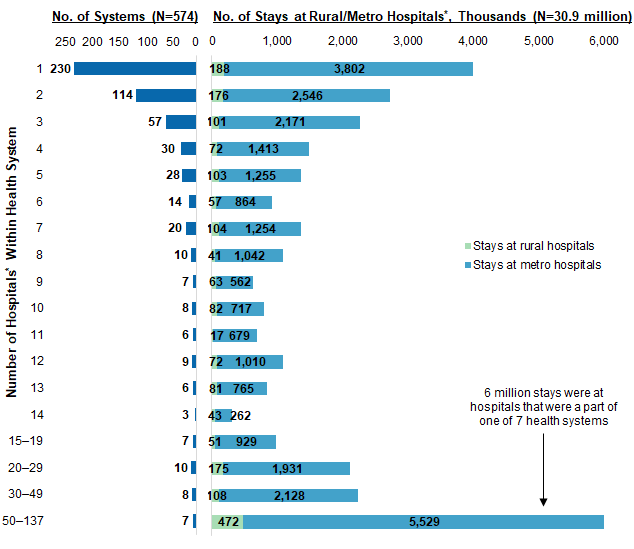
Figure 2. Distribution of inpatient stays across health systems, by system size and rural/metro location of the hospital, 2016
* Reflects the number of community nonrehabilitation general acute care hospitals within the system. A system could have rehabilitation, long-term care, or specialty hospitals that are not reflected in this analysis. Only health systems with at least one community nonrehabilitation general acute care hospital and that linked to a hospital in the HCUP SID are included. Figure 2 consists of two bar charts showing the distribution of inpatient stays in 2016 across health systems by number of hospitals within the health system and number of stays (in thousands) at rural versus metro hospitals. Six million stays were at hospitals that were a part of 1 of 7 health systems. Data are provided in Supplemental Table 1. |
Table 1 presents the percentage of inpatient stays in 47 States and the District of Columbia that were at hospitals affiliated with a health system in 2016, overall and by census division of the patient's residence. Percentages are presented for hospitals in all locations and separately for those in rural and metro areas. |
| Table 1. Distribution of hospitals and of inpatient stays at hospitals affiliated with a health system, by U.S. census division, 2016 | ||||||
| Census region and division | All hospitals | Rural hospitals | Metro hospitals | |||
|---|---|---|---|---|---|---|
| Total, N† | System affiliated, % | Total, N† | System affiliated, % | Total, N† | System affiliated, % | |
| Hospitals, total N, and percent of hospitals that were system affiliated | ||||||
| Total, 47 States and the District of Columbia | 4,133 | 70.9 | 1,696 | 50.4 | 2,437 | 85.2 |
| Northeast | ||||||
| New England* | 139 | 85.6 | 37 | 67.6 | 102 | 92.2 |
| Middle Atlantic | 373 | 84.2 | 74 | 60.8 | 299 | 90.0 |
| Midwest | ||||||
| East North Central | 676 | 76.2 | 269 | 59.9 | 407 | 87.0 |
| West North Central | 618 | 59.5 | 424 | 48.3 | 194 | 84.0 |
| South | ||||||
| South Atlantic | 652 | 81.7 | 195 | 58.5 | 457 | 91.7 |
| East South Central* | 267 | 68.9 | 162 | 58.0 | 105 | 85.7 |
| West South Central | 604 | 57.5 | 274 | 35.8 | 330 | 75.5 |
| West | ||||||
| Mountain* | 306 | 65.7 | 154 | 41.6 | 152 | 90.1 |
| Pacific | 498 | 70.5 | 107 | 45.8 | 391 | 77.2 |
| Inpatient stays, total N, thousands, and percent of stays at system-affiliated hospitals | ||||||
| Total, 47 States and the District of Columbia | 33,437 | 92.3 | 3,008 | 66.6 | 30,429 | 94.8 |
| Northeast | ||||||
| New England* | 1,458 | 95.7 | 82 | 79.2 | 1,376 | 96.7 |
| Middle Atlantic | 4,804 | 95.5 | 213 | 67.4 | 4,591 | 96.8 |
| Midwest | ||||||
| East North Central | 5,308 | 93.1 | 573 | 71.1 | 4,735 | 95.8 |
| West North Central | 2,378 | 90.9 | 447 | 60.0 | 1,931 | 98.0 |
| South | ||||||
| South Atlantic | 7,238 | 95.4 | 530 | 72.3 | 6,707 | 97.2 |
| East South Central* | 1,611 | 88.7 | 418 | 71.6 | 1,194 | 94.7 |
| West South Central | 3,940 | 89.6 | 397 | 57.9 | 3,543 | 93.2 |
| West | ||||||
| Mountain* | 2,012 | 95.0 | 187 | 57.7 | 1,825 | 98.8 |
| Pacific | 4,689 | 85.3 | 161 | 62.1 | 4,527 | 86.1 |
| Note: Includes community nonrehabilitation general acute care hospitals. * Missing data from one State in the census division. † N for hospital-level data is the number of hospitals; N for inpatient stay-level data is the number of stays, in thousands. Source: Agency for Healthcare Research and Quality (AHRQ), Healthcare Cost and Utilization Project (HCUP), State Inpatient Databases (SID) from 47 States and the District of Columbia (all except Alabama, Idaho, and New Hampshire) and AHRQ Compendium of U.S. Health Systems, 2016 | ||||||
Table 2 shows the percentage of inpatient stays at health system-affiliated and unaffiliated hospitals by select characteristics of the patient and inpatient stay, overall and by rural/metro location of the hospital. |
| Table 2. Characteristics of inpatient stays at health system-affiliated and unaffiliated hospitals in rural and metro areas, 2016 | ||||||
| Characteristic | All hospitals | Rural hospitals | Metro hospitals | |||
|---|---|---|---|---|---|---|
| System affiliated | Unaffiliated | System affiliated | Unaffiliated | System affiliated | Unaffiliated | |
| Inpatient stays, N | 30,863,900 | 2,573,400 | 2,004,500 | 1,003,500 | 28,859,400 | 1,569,900 |
| Service line, % | ||||||
| Maternal/neonatal | 22.5 | 24.3 | 22.1 | 23.5 | 22.5 | 24.8 |
| Mental health | 5.3 | 6.3 | 5.8 | 4.8 | 5.3 | 7.2 |
| Injury | 4.7 | 4.1 | 3.8 | 3.6 | 4.7 | 4.4 |
| Surgical | 20.9 | 14.4 | 14.0 | 11.8 | 21.4 | 16.0 |
| General medical | 46.6 | 51.0 | 54.3 | 56.3 | 46.1 | 47.5 |
| Age group, years, % | ||||||
| <1 | 11.5 | 12.3 | 11.3 | 12.0 | 11.5 | 12.5 |
| 1-17 | 2.6 | 2.0 | 1.6 | 1.8 | 2.6 | 2.1 |
| 18-44 | 24.7 | 24.6 | 22.3 | 21.7 | 24.9 | 26.4 |
| 45-64 | 25.1 | 23.4 | 23.1 | 21.1 | 25.2 | 24.9 |
| 65+ | 36.1 | 37.7 | 41.7 | 43.4 | 35.7 | 34.1 |
| Sex, % | ||||||
| Male | 43.3 | 41.9 | 41.5 | 40.2 | 43.4 | 43.0 |
| Female | 56.7 | 58.0 | 58.4 | 59.7 | 56.6 | 56.9 |
| Expected payer, % | ||||||
| Medicare | 40.2 | 41.1 | 47.2 | 47.7 | 39.7 | 36.8 |
| Medicaid | 22.3 | 27.5 | 21.9 | 21.2 | 22.4 | 31.5 |
| Private insurance | 30.3 | 23.5 | 23.4 | 24.5 | 30.7 | 22.9 |
| Self-pay/No chargea | 4.2 | 4.5 | 4.0 | 3.9 | 4.2 | 4.9 |
| Other | 2.9 | 3.3 | 3.4 | 2.5 | 2.9 | 3.7 |
| Discharge disposition, % | ||||||
| Routine | 68.4 | 69.5 | 66.5 | 66.9 | 68.5 | 71.2 |
| Short-term hospital | 1.8 | 3.8 | 4.3 | 5.4 | 1.6 | 2.9 |
| Other type of facility | 14.2 | 14.4 | 15.5 | 16.1 | 14.1 | 13.3 |
| Home health care | 12.3 | 8.8 | 10.8 | 8.8 | 12.4 | 8.8 |
| AMA | 1.2 | 1.6 | 1.0 | 0.9 | 1.3 | 2.0 |
| Died | 1.9 | 1.8 | 1.8 | 1.8 | 2.0 | 1.8 |
| Admitted through ED, % | 52.0 | 50.2 | 49.3 | 42.6 | 52.2 | 55.1 |
| Mean cost per stay, $ | 11,400 | 10,300 | 8,800 | 8,900 | 11,600 | 11,300 |
| Abbreviation: AMA, against medical advice; ED, emergency department Note: Includes stays at community nonrehabilitation general acute care hospitals. Number of stays and costs were rounded to the nearest hundred. a Self-pay/No charge: includes self-pay, no charge, charity, and no expected payment. Source: Agency for Healthcare Research and Quality (AHRQ), Healthcare Cost and Utilization Project (HCUP), State Inpatient Databases (SID) from 47 States and the District of Columbia (all except Alabama, Idaho, and New Hampshire) and AHRQ Compendium of U.S. Health Systems, 2016 | ||||||
References 1 Henke RM, Karaca Z, Moore B, Cutler E, Liu H, Marder WD, et al. Impact of health system affiliation on hospital resource use intensity and quality of care. Health Services Research. 2018;53(1):63-86. 2 Oyeka O, Ullrich F, MacKinney AC, Lupica J, Mueller KJ. The Rural Hospital and Health System Affiliation Landscape - A Brief Review. RUPRI Center for Rural Health Policy Analysis, University of Iowa. 2018. https://rupri.public-health.uiowa.edu/publications/policypapers/Rural%20Hospital%20and%20Health%20System%20Affiliation.pdf. 3 Dafny LS, Lee TH. The good merger. The New England Journal of Medicine. 2015;372(22):2077-9. 4 O'Hanlon CE, Kranz AM, DeYoreo M, Mahmud A, Damberg CL, Timbie J. Access, quality, and financial performance of rural hospitals following health system affiliation. Health Affairs (Millwood). 2019;38(12):2095-104. 5 Furukawa MF, Machta RM, Barrett KA, Jones DJ, Shortell SM, Scanlon DP, et al. Landscape of health systems in the United States. Medical Care Research and Review. 2020;77(4):357-66. 6 Agency for Healthcare Research and Quality. Compendium of U.S. Health Systems. 2016. www.ahrq.gov/chsp/data-resources/compendium.html. Accessed April 3, 2020 About Statistical Briefs Healthcare Cost and Utilization Project (HCUP) Statistical Briefs provide basic descriptive statistics on a variety of topics using HCUP administrative healthcare data. Topics include hospital inpatient, ambulatory surgery, and emergency department use and costs, quality of care, access to care, medical conditions, procedures, and patient populations, among other topics. The reports are intended to generate hypotheses that can be further explored in other research; the reports are not designed to answer in-depth research questions using multivariate methods. Data Source The estimates in this Statistical Brief are based upon data from the HCUP 2016 State Inpatient Databases (SID) for 47 States and the District of Columbia: Alaska, Arizona, Arkansas, California, Colorado, Connecticut, Delaware, District of Columbia, Florida, Georgia, Hawaii, Illinois, Indiana, Iowa, Kansas, Kentucky, Louisiana, Maine, Maryland, Massachusetts, Michigan, Minnesota, Mississippi, Missouri, Montana, Nebraska, Nevada, New Jersey, New Mexico, New York, North Carolina, North Dakota, Ohio, Oklahoma, Oregon, Pennsylvania, Rhode Island, South Carolina, South Dakota, Tennessee, Texas, Utah, Vermont, Virginia, Washington, West Virginia, Wisconsin, and Wyoming. Information on whether a hospital was affiliated with a health system came from the Agency for Healthcare Research and Quality's (AHRQ's) 2016 Compendium of U.S. Health Systems.a Only health systems in 47 States and the District of Columbia that included at least one community nonrehabilitation general acute care hospital and that linked to a hospital in the SID are included in this Brief; thus, the results may differ from those presented in other studies.b Definitions Case definition A list of health systems and hospitals participating in those systems was obtained from the Agency for Healthcare Research and Quality's (AHRQ's) Compendium of U.S. Health Systems, which describes the working definition of a health system as "an organization that includes at least one hospital and at least one group of physicians that provides comprehensive care (including primary and specialty care) who are connected with each other and with the hospital through common ownership or joint management." Further technical documentation from this data source is available elsewhere.c,d Service line Service line definitions are consistent with those defined by the HCUP documentation beginning in 2019.e Types of hospitals included in HCUP State Inpatient Databases This analysis used State Inpatient Databases (SID) limited to data from community general acute care hospitals, which are defined as short-term, non-Federal, general, and other hospitals, excluding hospital units of other institutions (e.g., prisons). Excluded for this analysis are community specialty hospitals such as obstetrics and gynecology, otolaryngology, orthopedic, cancer, pediatric, public, and academic medical center hospitals. Also excluded for this analysis are long-term care facilities such as rehabilitation, psychiatric, and alcoholism and chemical dependency hospitals. However, if a patient received long-term care, rehabilitation, or treatment for a psychiatric or chemical dependency condition in a community general acute care hospital, the discharge record for that stay was included in the analysis. Unit of analysis This Statistical Brief examines units of analysis as the health system, the hospital, and the hospital discharge (i.e., the hospital stay), not a person or patient. This means that a person who is admitted to the hospital multiple times in 1 year will be counted each time as a separate discharge from the hospital. Cost and charges Total hospital charges were converted to costs using HCUP Cost-to-Charge Ratios based on hospital accounting reports from the Centers for Medicare & Medicaid Services (CMS).f Costs reflect the actual expenses incurred in the production of hospital services, such as wages, supplies, and utility costs; charges represent the amount a hospital billed for the case. For each hospital, a hospital-wide cost-to-charge ratio is used. Hospital charges reflect the amount the hospital billed for the entire hospital stay and do not include professional (physician) fees. For the purposes of this Statistical Brief, costs are reported to the nearest hundred. Hospital location Hospital location is based on the rural-urban continuum codes (RUCC) for U.S. counties developed by the United States Department of Agriculture (USDA).g For this Statistical Brief, we collapsed the RUCC codes into the following two categories: Metropolitan (metro) area:
To make coding uniform across all HCUP data sources, the primary expected payer for the hospital stay combines detailed categories into general groups:
For this Statistical Brief, when more than one payer is listed for a hospital discharge, the first-listed payer is used. Region and division Region is one of the four regions defined by the U.S. Census Bureau. Division corresponds to the location of the hospital and is one of the nine divisions defined by the U.S. Census Bureau.
Admission source (now known as the patient's point of origin) indicates where the patient was located prior to admission to the hospital. Emergency admission indicates that the patient was admitted to the hospital through the emergency department. Discharge status Discharge status reflects the disposition of the patient at discharge from the hospital and includes the following six categories: routine (to home); transfer to another short-term hospital; other transfers (including skilled nursing facility, intermediate care, and another type of facility such as a nursing home); home health care; against medical advice (AMA); or died in the hospital. About HCUP The Healthcare Cost and Utilization Project (HCUP, pronounced "H-Cup") is a family of healthcare databases and related software tools and products developed through a Federal-State-Industry partnership and sponsored by the Agency for Healthcare Research and Quality (AHRQ). HCUP databases bring together the data collection efforts of State data organizations, hospital associations, and private data organizations (HCUP Partners) and the Federal government to create a national information resource of encounter-level healthcare data. HCUP includes the largest collection of longitudinal hospital care data in the United States, with all-payer, encounter-level information beginning in 1988. These databases enable research on a broad range of health policy issues, including cost and quality of health services, medical practice patterns, access to healthcare programs, and outcomes of treatments at the national, State, and local market levels. HCUP would not be possible without the contributions of the following data collection Partners from across the United States: |
|
Alaska Department of Health and Social Services
Alaska State Hospital and Nursing Home Association Arizona Department of Health Services Arkansas Department of Health California Office of Statewide Health Planning and Development Colorado Hospital Association Connecticut Hospital Association Delaware Division of Public Health District of Columbia Hospital Association Florida Agency for Health Care Administration Georgia Hospital Association Hawaii Laulima Data Alliance Hawaii University of Hawai'i at Hilo Illinois Department of Public Health Indiana Hospital Association Iowa Hospital Association Kansas Hospital Association Kentucky Cabinet for Health and Family Services Louisiana Department of Health Maine Health Data Organization Maryland Health Services Cost Review Commission Massachusetts Center for Health Information and Analysis Michigan Health & Hospital Association Minnesota Hospital Association Mississippi State Department of Health Missouri Hospital Industry Data Institute |
Montana Hospital Association Nebraska Hospital Association Nevada Department of Health and Human Services New Hampshire Department of Health & Human Services New Jersey Department of Health New Mexico Department of Health New York State Department of Health North Carolina Department of Health and Human Services North Dakota (data provided by the Minnesota Hospital Association) Ohio Hospital Association Oklahoma State Department of Health Oregon Association of Hospitals and Health Systems Oregon Office of Health Analytics Pennsylvania Health Care Cost Containment Council Rhode Island Department of Health South Carolina Revenue and Fiscal Affairs Office South Dakota Association of Healthcare Organizations Tennessee Hospital Association Texas Department of State Health Services Utah Department of Health Vermont Association of Hospitals and Health Systems Virginia Health Information Washington State Department of Health West Virginia Department of Health and Human Resources, West Virginia Health Care Authority Wisconsin Department of Health Services Wyoming Hospital Association |
|
About the SID The HCUP State Inpatient Databases (SID) are hospital inpatient databases from data organizations participating in HCUP. The SID contain the universe of the inpatient discharge abstracts in the participating HCUP States, translated into a uniform format to facilitate multistate comparisons and analyses. Together, the SID encompass more than 95 percent of all U.S. community hospital discharges. The SID can be used to investigate questions unique to one State, to compare data from two or more States, to conduct market-area variation analyses, and to identify State-specific trends in inpatient care utilization, access, charges, and outcomes. For More Information For other information on hospital characteristics of inpatient stays, including health system affiliation, refer to the HCUP Statistical Briefs located at www.hcup-us.ahrq.gov/reports/statbriefs/sb_hospcharacteristics.jsp. For additional HCUP statistics, visit:
For a detailed description of HCUP and more information on the design of the State Inpatient Databases (SID), please refer to the following database documentation: Agency for Healthcare Research and Quality. Overview of the State Inpatient Databases (SID). Healthcare Cost and Utilization Project (HCUP). Rockville, MD: Agency for Healthcare Research and Quality. Updated November 2019 www.hcup-us.ahrq.gov/sidoverview.jsp. Accessed February 3, 2020. Suggested Citation Karaca Z (AHRQ), Fingar KR (IBM Watson Health). Health System Affiliation and Characteristics of Inpatient Stays at Rural and Metropolitan Hospitals, 2016. HCUP Statistical Brief #265. October 2020. Agency for Healthcare Research and Quality, Rockville, MD. www.hcup-us.ahrq.gov/reports/statbriefs/sb265-System-Affiliation-and-Inpatient-Stays-2016.pdf. Acknowledgments The authors would like to acknowledge the contributions of Minya Sheng of IBM Watson Health. *** AHRQ welcomes questions and comments from readers of this publication who are interested in obtaining more information about access, cost, use, financing, and quality of healthcare in the United States. We also invite you to tell us how you are using this Statistical Brief and other HCUP data and tools, and to share suggestions on how HCUP products might be enhanced to further meet your needs. Please email us at hcup@ahrq.gov or send a letter to the address below:Joel W. Cohen, Ph.D., Director Center for Financing, Access and Cost Trends Agency for Healthcare Research and Quality 5600 Fishers Lane Rockville, MD 20857 This Statistical Brief was posted online on October 6, 2020. a Agency for Healthcare Research and Quality. Compendium of U.S. Health Systems. 2016. www.ahrq.gov/chsp/data-resources/compendium.html. Accessed April 3, 2020. b Furukawa MF, Machta RM, Barrett KA, Jones DJ, Shortell SM, Scanlon DP, et al. Landscape of health systems in the United States. Medical Care Research and Review. 2020;77(4):357-66. c Comparative Health System Performance Initiative: Compendium of U.S. Health Systems, 2016, Technical Documentation. January 2019. www.ahrq.gov/sites/default/files/wysiwyg/chsp/compendium/techdocrpt_0.pdf. Accessed April 3, 2020. d Furukawa MF, Machta RM, Barrett KA, Jones DJ, Shortell SM, Scanlon DP, et al. Landscape of health systems in the United States. Medical Care Research Review. 2020;77(4):357-66. e Agency for Healthcare Research and Quality. HCUP Central Distributor SID Description of Data Elements - All States. Healthcare Cost and Utilization Project (HCUP). August 2008. www.hcup-us.ahrq.gov/db/vars/siddistnote.jsp?var=i10_serviceline. Accessed September 22, 2020. f Agency for Healthcare Research and Quality. HCUP Cost-to-Charge Ratio (CCR) Files. Healthcare Cost and Utilization Project (HCUP). 2001-2017. Agency for Healthcare Research and Quality. Updated December 2019. www.hcup-us.ahrq.gov/db/state/costtocharge.jsp. Accessed February 3, 2020. g United States Department of Agriculture. Rural-Urban Continuum Codes. www.ers.usda.gov/data-products/rural-urban-continuum-codes/. Accessed February 27, 2020. |
| Supplemental Table 1. Distribution of inpatient stays across health systems, by system size and rural/metro location of the hospital, 2016, for data presented in Figure 2 | |||
| Number of hospitals in system | Number of systems (N=574) | Number of stays, thousands (N=30.9 M) | |
|---|---|---|---|
| Rural | Metro | ||
| 1 | 230 | 188 | 3,802 |
| 2 | 114 | 176 | 2,546 |
| 3 | 57 | 101 | 2,171 |
| 4 | 30 | 72 | 1,413 |
| 5 | 28 | 103 | 1,255 |
| 6 | 14 | 57 | 864 |
| 7 | 20 | 104 | 1,254 |
| 8 | 10 | 41 | 1,042 |
| 9 | 7 | 63 | 562 |
| 10 | 8 | 82 | 717 |
| 11 | 6 | 17 | 679 |
| 12 | 9 | 72 | 1,010 |
| 13 | 6 | 81 | 765 |
| 14 | 3 | 43 | 262 |
| 15-19 | 7 | 51 | 929 |
| 20-29 | 10 | 175 | 1,931 |
| 30-49 | 8 | 108 | 2,128 |
| 50-137 | 7 | 472 | 5,529 |
| Internet Citation: Statistical Brief #265. Healthcare Cost and Utilization Project (HCUP). October 2020. Agency for Healthcare Research and Quality, Rockville, MD. hcup-us.ahrq.gov/reports/statbriefs/sb265-System-Affiliation-and-Inpatient-Stays-2016.jsp. |
| Are you having problems viewing or printing pages on this website? |
| If you have comments, suggestions, and/or questions, please contact hcup@ahrq.gov. |
| If you are experiencing issues related to Section 508 accessibility of information on this website, please contact hcup@ahrq.gov. |
| Privacy Notice, Viewers & Players |
| Last modified 10/5/20 |