|
STATISTICAL BRIEF #263
September 2020
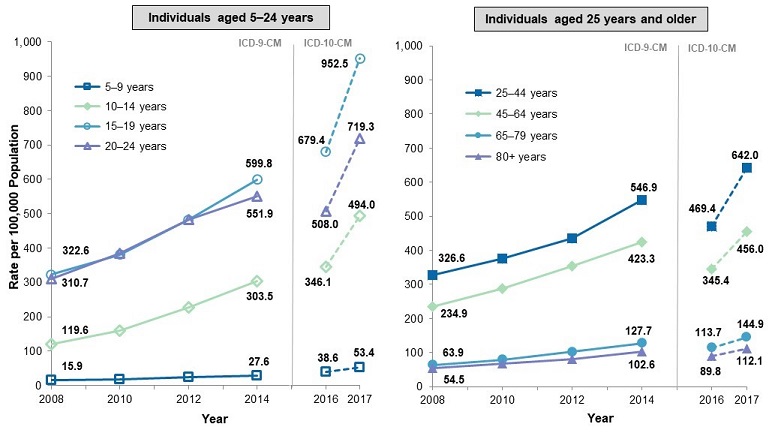
Pamela L. Owens, Ph.D., Kimberly W. McDermott, Ph.D., Rachel N. Lipari, Ph.D., and Megan M. Hambrick, M.S.W. If You Know Someone in Crisis Call the toll-free National Suicide Prevention Lifeline at 1-800-273-TALK (8255), 24 hours a day, 7 days a week. The service is available to everyone. All calls are confidential. You can also visit the National Suicide Prevention Lifeline's website at http://www.suicidepreventionlifeline.org. Introduction Suicide is a major and growing public health concern in the United States, ranking among the top 10 leading causes of death.1 From 2001 to 2017, the suicide rate increased 31 percent, from 10.7 to 14.0 per 100,000 population.2 In 2017, this equated to more than 47,000 deaths.2,3 Suicide is preventable. Suicidal thoughts or actions are indications of extreme distress and require immediate intervention. Emergency departments (EDs) are an important site of care to identify individuals at risk, to provide timely support and intervention, and, in some cases, to facilitate entry into more intensive treatment.4 Information on trends in ED utilization related to suicidal ideation or suicide attempt can help inform resource needs and target prevention efforts. This Healthcare Cost and Utilization Project (HCUP) Statistical Brief presents statistics on ED visits related to suicidal ideation or suicide attempt among individuals aged 5 years and older. The Brief uses the HCUP Nationwide Emergency Department Sample (NEDS) to examine 2008-2017 trends in the population rate of ED visits related to suicidal ideation or suicide attempt by age group. The 2017 NEDS is used to provide data on patient characteristics and outcomes. In addition, maps based on the 2017 State Inpatient Databases (SID) and 2017 State Emergency Department Databases (SEDD) present State-level rates of ED visits related to suicidal ideation or suicide attempt. Maps are also presented that illustrate the variation in the highest rates within the State by patient location (i.e., counties in large metropolitan, small/medium metropolitan, or rural areas). Because of the large sample size of the HCUP data, small differences can be statistically significant. Thus, only differences greater than or equal to 10 percent are discussed in the text. Findings Rate of ED visits related to suicidal ideation or suicide attempt, 2008-2017 Figure 1 presents the rate per 100,000 population of ED visits related to suicidal ideation or suicide attempt among individuals aged 5 years and older by age group between 2008 and 2017. The figure presents trends in ED visits for each group during 2008-2014 using International Classification of Diseases, Ninth Revision, Clinical Modification (ICD-9-CM)-coded data. There are known discontinuities between the ICD-9-CM and the International Classification of Diseases, Tenth Revision, Clinical Modification (ICD-10-CM) coding systems that affect the identification of cases, including a transition period in which the new codes were adopted. The figure presents estimates related to suicidal ideation or suicide attempt for 2016 and 2017 based on ICD-10-CM data, establishing new baseline estimates of such cases. It is expected that hospitals required a transition period in which to become more familiar with the ICD-10-CM coding system. Changes in rates between 2016 and 2017 may not reflect an actual change in rates and, therefore, are not intended for comparison. For this reason, the changes are symbolically represented as a dashed line, rather than a solid line, in the graph. |
|
Figure 1. Rate of ED visits related to suicidal ideation or suicide attempt, by age group, 2008-2017
Abbreviations: ED, emergency department; ICD-9-CM, International Classification of Diseases, Ninth Revision, Clinical Modification; ICD-10-CM, International Classification of Diseases, Tenth Revision, Clinical Modification Figure 1 consists of two line graphs that show the rate of emergency department visits related to suicidal relation or suicide attempt for individuals by age group from 2008 to 2017. The first graph provides data for individuals aged 5-24 years, and the second graph provides data for individuals aged 25 years and older. Both graphs include a gray vertical line that reflects the shift in diagnosis coding in 2015 to the updated International Classification of Diseases, Tenth Revision, Clinical Modification, system. Data are provided in Supplemental Table 1. |
Table 1 presents patient characteristics and discharge disposition of ED visits related to suicidal ideation or suicide attempt compared with all other ED visits in 2017. |
| Table 1. Patient characteristics and discharge disposition of ED visits related to suicidal ideation or suicide attempt, 2017 | ||||
| Characteristic or disposition | ED visits related to suicidal ideation or suicide attempt | All other ED visits | ||
|---|---|---|---|---|
| N | Percent | N | Percent | |
| Total | 1,482,402 | 100.0 | 132,074,873 | 100.0 |
| Age group, years | ||||
| 5-9 years | 10,880 | 0.7 | 5,951,528 | 4.5 |
| 10-14 years | 102,808 | 6.9 | 5,258,013 | 4.0 |
| 15-19 years | 207,915 | 14.0 | 7,815,897 | 5.9 |
| 20-24 years | 163,275 | 11.0 | 10,436,508 | 7.9 |
| 25-44 years | 543,776 | 36.7 | 39,108,538 | 29.6 |
| 45-64 years | 384,890 | 26.0 | 34,360,758 | 26.0 |
| 65-79 years | 55,209 | 3.7 | 18,425,668 | 14.0 |
| 80+ years | 13,649 | 0.9 | 10,717,964 | 8.1 |
| Sex | ||||
| Male | 790,761 | 53.3 | 57,679,665 | 43.7 |
| Female | 691,524 | 46.6 | 74,388,749 | 56.3 |
| Primary expected payer | ||||
| Medicare, 65+ years | 59,615 | 4.0 | 25,371,440 | 19.2 |
| Medicare, <65 years | 184,847 | 12.5 | 9,212,990 | 7.0 |
| Medicaid | 587,078 | 39.6 | 37,478,639 | 28.4 |
| Private insurance | 371,266 | 25.0 | 37,865,385 | 28.7 |
| Self-pay/No charge* | 224,898 | 15.2 | 16,656,051 | 12.6 |
| Patient location | ||||
| Large metropolitan | 745,269 | 50.3 | 66,705,345 | 50.5 |
| Medium/small metropolitan | 483,950 | 32.6 | 41,980,114 | 31.8 |
| Rural | 221,905 | 15.0 | 22,736,245 | 17.2 |
| Discharge disposition | ||||
| Routine, discharged to home, home health care | 513,182 | 34.6 | 106,439,904 | 80.6 |
| Admitted to the same hospital | 446,751 | 30.1 | 18,867,438 | 14.3 |
| Transfer to short-term hospital | 92,685 | 6.3 | 2,081,335 | 1.6 |
| Transfer to other facility | 414,648 | 28.0 | 1,545,671 | 1.2 |
| Against medical advice | 10,746 | 0.7 | 2,134,307 | 1.6 |
| Died in hospital or ED | 1,210 | 0.1 | 721,034 | 0.5 |
| Discharged alive, destination unknown | 0 | 0.0 | 1,183 | 0.0 |
| Abbreviation: ED, emergency department Note: Primary expected payer, patient location, and discharge disposition were missing for 3.7, 2.1, and 0.2 percent of ED visits related to suicidal ideation/suicide attempt, respectively, and for 4.2, 0.5, and 0.2 percent of all other ED visits, respectively. *Self-pay/No charge: includes self-pay, no charge, charity, and no expected payment. Source: Agency for Healthcare Research and Quality (AHRQ), Healthcare Cost and Utilization Project (HCUP), Nationwide Emergency Department Sample (NEDS), 2017 | ||||
|
|
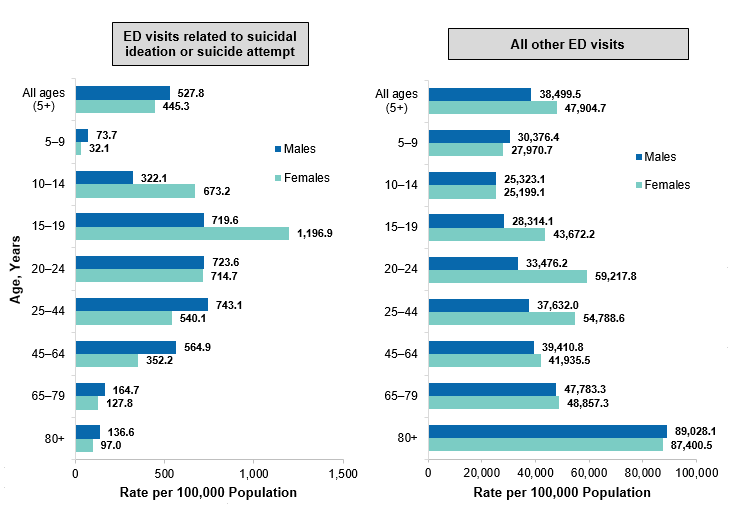
Figure 2. Rate of ED visits related to suicidal ideation or suicide attempt, by age group and sex, 2017
Abbreviation: ED, emergency department Figure 2 consists of two bar charts that show the rate of ED visits related to suicidal ideation or suicide attempt by age group and sex for 2017. The first chart shows ED visits related to suicidal ideation or suicide attempt, and the second chart shows all other ED visits. Data are provided in Supplemental Table 2. |
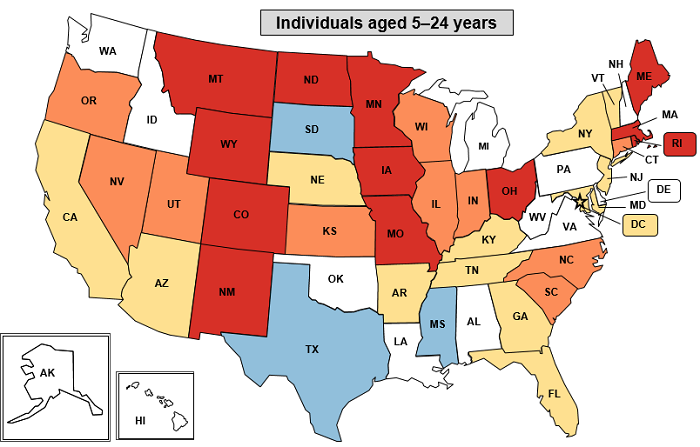
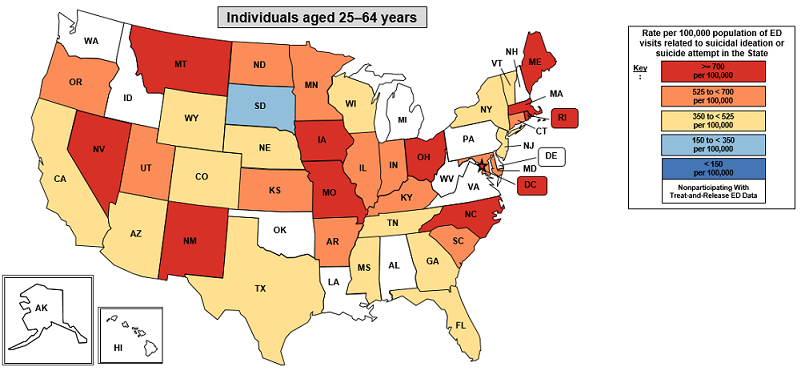
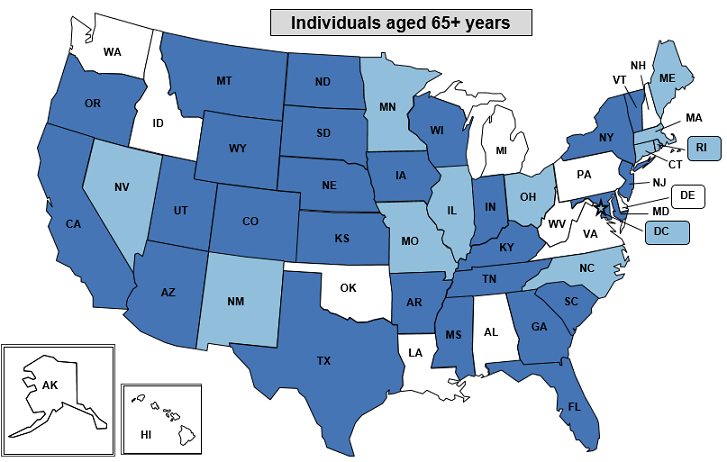
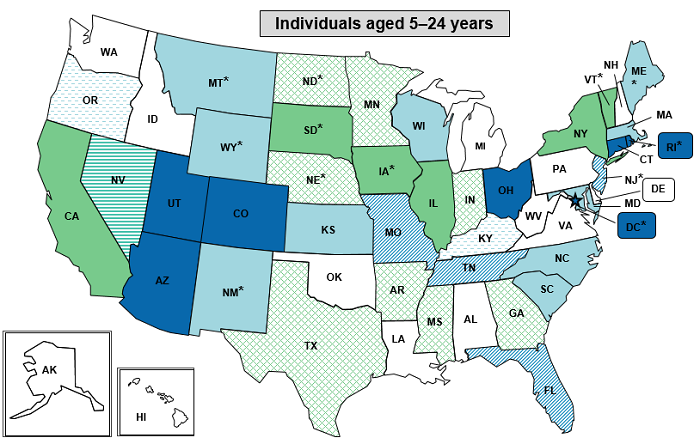
Figure 3 shows the 2017 State-level population rate of ED visits per 100,000 population related to suicidal ideation or suicide attempt.a The range of rates were classified into five categories of rates per 100,000 population (<150, 150 to <350, 350 to <525, 525 to <700, and <700) based on the quintile distribution of age -group -specific rates across the States. The top map shows rates for individuals aged 5-24 years, the middle map shows rates for individuals aged 25-64 years, and the bottom map shows rates for individuals aged 65+ years. Differences discussed in the text refer to differences in the rate category for the State and do not necessarily imply that the difference in specific State-level rates is 10 percent or greater. |
|
Figure 3. Rate of ED visits related to suicidal ideation or suicide attempt for three age groups, by State, 2017 |
|
Abbreviation: ED, emergency department Figure 3 consists of three maps of the United States showing the rate of suicidal ideation or suicide attempt by State. The first map displays rates for individuals aged 5-24 years, the second displays rates for individuals aged 25-64 years, and the third map displays rates for individuals aged 65+ years. Data are provided in Supplemental Table 3. |
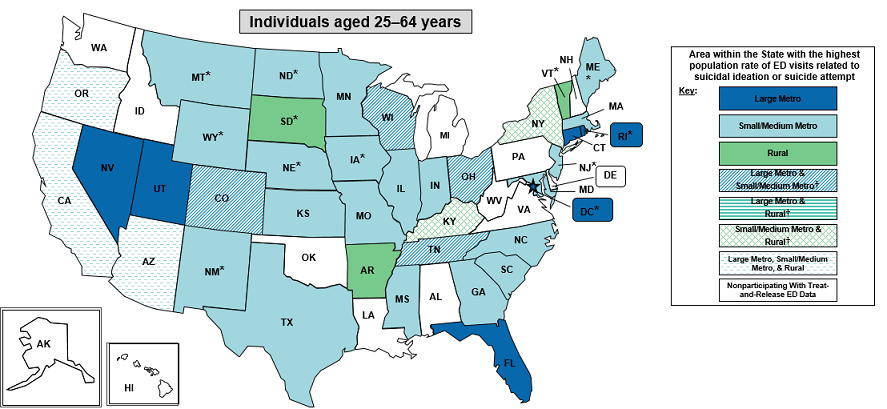
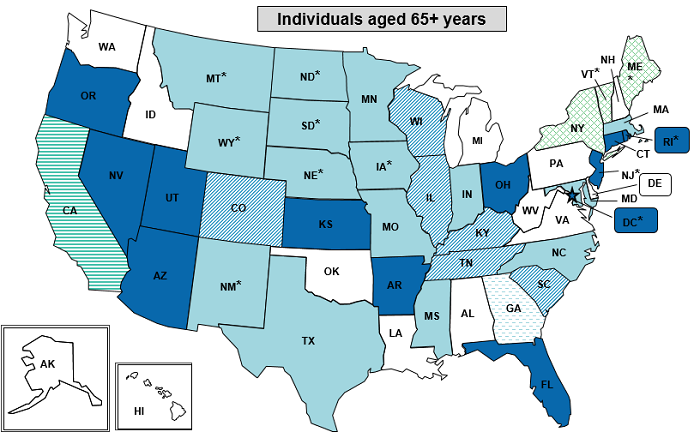
Rate of ED visits related to suicidal ideation or suicide attempt for three age groups, by urban-rural area within the State, 2017 Figure 4 shows the urban-rural area within the State, based on the residence of the patient, with the highest population rate of ED visits related to suicidal ideation or suicide attempt in 2017.b The colors in the maps indicate which geographic area in a State (large metropolitan, small/medium metropolitan, or rural) had the highest rate of suicidal ideation or suicide attempt. The top map shows areas with the highest population rates for individuals aged 5-24 years, the middle map shows areas with the highest population rates for individuals aged 25-64 years, and the bottom map shows areas with the highest population rates for individuals aged 65+ years. |
|
Figure 4. Urban-rural area with the highest rate of ED visits related to suicidal ideation or suicide attempt for three age groups, by State, 2017 |
|
Abbreviation: ED, emergency department; metro, metropolitan Figure 4 consists of three maps of the United States showing areas within each State with the highest population rate of ED visits related to suicidal ideation or suicide attempt. The first map is based on rates for individuals aged 5-24 years, the second map is based on rates for individuals aged 25-64 years, and the third map is based on rates for individuals aged 65+ years. Data are provided in Supplemental Table 4. |
References 1 Xu J, Murphy SL, Kochanek KD, Arias E. Mortality in the United States, 2018. NCHS Data Brief #355. January 2020. Centers for Disease Control and Prevention. www.cdc.gov/nchs/products/databriefs/db355.htm. Accessed August 10, 2020. 2 National Institute of Mental Health. Suicide Statistics. Last updated April 2019. www.nimh.nih.gov/health/statistics/suicide.shtml. Accessed June 28, 2020. 3 Zwald ML, Holland KM, Annor FB, Kite-Powell A, Sumner SA, Bowen DA, et al. Syndromic surveillance of suicidal ideation and self-directed violence — United States, January 2017-December 2018. Morbidity and Mortality Weekly Report. 2020;69:103-8. 4 Office of the Surgeon General, National Action Alliance for Suicide Prevention. 2012 National Strategy for Suicide Prevention: Goals and Objectives for Action. September 2012. www.surgeongeneral.gov/library/reports/national-strategy-suicide-prevention/. Accessed August 10, 2020. About Statistical Briefs Healthcare Cost and Utilization Project (HCUP) Statistical Briefs provide basic descriptive statistics on a variety of topics using HCUP administrative healthcare data. Topics include hospital inpatient, ambulatory surgery, and emergency department use and costs, quality of care, access to care, medical conditions, procedures, and patient populations, among other topics. The reports are intended to generate hypotheses that can be further explored in other research; the reports are not designed to answer in-depth research questions using multivariate methods. Data Source The estimates in this Statistical Brief are based upon data from the HCUP 2017 Nationwide Emergency Department Sample (NEDS) and from the HCUP 2017 State Inpatient Databases (SID) and State Emergency Department Databases (SEDD) from the 37 States and the District of Columbia that provided both types of data for HCUP in 2017: Arizona, Arkansas, California, Colorado, Connecticut, District of Columbia, Florida, Georgia, Illinois, Indiana, Iowa, Kansas, Kentucky, Maine, Maryland, Massachusetts, Minnesota, Mississippi, Missouri, Montana, Nebraska, Nevada, New Jersey, New Mexico, New York, North Carolina, North Dakota, Ohio, Oregon, Rhode Island, South Carolina, South Dakota, Tennessee, Texas, Utah, Vermont, Wisconsin, and Wyoming. Historical data were drawn from the 2008, 2010, 2012, 2014, and 2016 NEDS. Supplemental sources included population denominator data for use with HCUP databases, derived from information available from Claritas, a vendor that produces population estimates and projections based on data from the U.S. Census Bureau.c Definitions Diagnoses, ICD-9-CM, and ICD-10-CM For emergency department (ED) visits that are treated and released, the first-listed diagnosis represents the condition, symptom, or problem identified in the medical record to be chiefly responsible for the ED services provided. In cases where the first-listed diagnosis is a symptom or problem, a diagnosis has not been established (confirmed) by the provider. For ED visits that result in an inpatient admission, the first-listed diagnosis is the principal diagnosis, the condition established after study to be chiefly responsible for the patient's admission to the hospital. Secondary diagnoses are conditions that coexist at the time of the ED visit or inpatient admission, that require or affect patient care treatment received or management, or that develop during the inpatient stay. All-listed diagnoses include the first-listed (principal) diagnosis plus the secondary conditions. ICD-9-CM is the International Classification of Diseases, Ninth Revision, Clinical Modification, which assigns numeric codes to diagnoses. There are approximately 14,000 ICD-9-CM diagnosis codes. ICD-10-CM is the International Classification of Diseases, Tenth Revision, Clinical Modification. In October 2015, ICD-10-CM replaced the ICD-9-CM diagnosis coding system for most inpatient and outpatient medical encounters. There are over 70,000 ICD-10-CM diagnosis codes. Case definition Suicidal ideation or suicide attempt was defined as any ED visit (treat-and-release or admitted to the same hospital) with any-listed diagnosis code of:
The Nationwide Emergency Department Sample (NEDS) is based on ED data from community acute care hospitals, which are defined as short-term, non-Federal, general, and other specialty hospitals available to the public. Included among community hospitals are pediatric institutions and hospitals that are part of academic medical centers. Excluded are long-term care facilities such as rehabilitation, psychiatric, and alcoholism and chemical dependency hospitals. Hospitals included in the NEDS have EDs, and no more than 90 percent of their ED visits result in admission. Types of hospitals included in HCUP State Inpatient Databases This analysis used State Inpatient Databases (SID) limited to data from community hospitals, which are defined as short-term, non-Federal, general, and other hospitals, excluding hospital units of other institutions (e.g., prisons). Community hospitals include obstetrics and gynecology, otolaryngology, orthopedic, cancer, pediatric, public, and academic medical center hospitals. Excluded for this analysis are long-term care facilities such as rehabilitation, psychiatric, and alcoholism and chemical dependency hospitals. However, if a patient received long-term care, rehabilitation, or treatment for a psychiatric or chemical dependency condition in a community hospital, the discharge record for that stay was included in the analysis. Types of hospitals included in HCUP State Emergency Department Databases This analysis used State Emergency Department Databases (SEDD) limited to data from community hospitals with a hospital-owned emergency department. Community hospitals are defined as short-term, non-Federal, general, and other hospitals, excluding hospital units of other institutions (e.g., prisons). Community hospitals include specialty, pediatric, public, and academic medical center hospitals. Excluded for this analysis are long-term care facilities such as rehabilitation, psychiatric, and alcoholism and chemical dependency hospitals. Unit of analysis The unit of analysis is the ED visit, not a person or patient. This means that a person who is seen in the ED multiple times in 1 year will be counted each time as a separate visit in the ED. Population rates Rates of ED visits per 100,000 population were calculated using ED visit totals in the numerator and Claritase estimates of the corresponding U.S. population (e.g. the population for a specific age group) in the denominator. Individual patients seen in the ED multiple times are counted more than once in the numerator. Population rate of ED visits = number of ED visits among patients in group divided into number of U.S. residents in group times 100,000. Percentage difference Percentage differences between groups were calculated using the following formula: The percentage difference is equal to the absolute value of the difference between group 1 and group 2 values, divided by the average of group 1 and group 2 values, all multiplied by 100. Location of patients' residence Place of residence is based on the urban-rural classification scheme for U.S. counties developed by the National Center for Health Statistics (NCHS) and based on the Office of Management and Budget (OMB) definition of a metropolitan service area as including a city and a population of at least 50,000 residents. For this Statistical Brief, we collapsed the NCHS categories into the following categories:
To make coding uniform across all HCUP data sources, the primary expected payer for the ED visit combines detailed categories into general groups:
For this Statistical Brief, when more than one payer is listed for a hospital discharge, the first-listed payer is used. ED visits with an expected primary payer of Medicare were reported separately for patients aged <65 years and those aged 65+ years. Discharge status Discharge status reflects the disposition of the patient at discharge from the ED and includes the following categories: routine (to home or to home health care); admitted as an inpatient to the same hospital; transfer to another short-term hospital; other transfers (including skilled nursing facility, intermediate care, and another type of facility such as a nursing home); against medical advice (AMA); died in the hospital or ED; and discharged alive, destination unknown. About HCUP The Healthcare Cost and Utilization Project (HCUP, pronounced "H-Cup") is a family of healthcare databases and related software tools and products developed through a Federal-State-Industry partnership and sponsored by the Agency for Healthcare Research and Quality (AHRQ). HCUP databases bring together the data collection efforts of State data organizations, hospital associations, and private data organizations (HCUP Partners) and the Federal government to create a national information resource of encounter-level healthcare data. HCUP includes the largest collection of longitudinal hospital care data in the United States, with all-payer, encounter-level information beginning in 1988. These databases enable research on a broad range of health policy issues, including cost and quality of health services, medical practice patterns, access to healthcare programs, and outcomes of treatments at the national, State, and local market levels. HCUP would not be possible without the contributions of the following data collection Partners from across the United States: |
|
Alaska Department of Health and Social Services
Alaska State Hospital and Nursing Home Association Arizona Department of Health Services Arkansas Department of Health California Office of Statewide Health Planning and Development Colorado Hospital Association Connecticut Hospital Association Delaware Division of Public Health District of Columbia Hospital Association Florida Agency for Health Care Administration Georgia Hospital Association Hawaii Laulima Data Alliance Hawaii, University of Hawai'i at Hilo Illinois Department of Public Health Indiana Hospital Association Iowa Hospital Association Kansas Hospital Association Kentucky Cabinet for Health and Family Services Louisiana Department of Health Maine Health Data Organization Maryland Health Services Cost Review Commission Massachusetts Center for Health Information and Analysis Michigan Health & Hospital Association Minnesota Hospital Association Mississippi State Department of Health Missouri Hospital Industry Data Institute |
Montana Hospital Association Nebraska Hospital Association Nevada Department of Health and Human Services New Hampshire Department of Health & Human Services New Jersey Department of Health New Mexico Department of Health New York State Department of Health North Carolina Department of Health and Human Services North Dakota (data provided by the Minnesota Hospital Association) Ohio Hospital Association Oklahoma State Department of Health Oregon Association of Hospitals and Health Systems Oregon Office of Health Analytics Pennsylvania Health Care Cost Containment Council Rhode Island Department of Health South Carolina Revenue and Fiscal Affairs Office South Dakota Association of Healthcare Organizations Tennessee Hospital Association Texas Department of State Health Services Utah Department of Health Vermont Association of Hospitals and Health Systems Virginia Health Information Washington State Department of Health West Virginia Department of Health and Human Resources, West Virginia Health Care Authority Wisconsin Department of Health Services Wyoming Hospital Association |
|
About the NEDS
The HCUP Nationwide Emergency Department Database (NEDS) is a unique and powerful database that yields national estimates of emergency department (ED) visits. The NEDS was constructed using records from both the HCUP State Emergency Department Databases (SEDD) and the State Inpatient Databases (SID). The SEDD capture information on ED visits that do not result in an admission (i.e., patients who were treated in the ED and then released from the ED, or patients who were transferred to another hospital); the SID contain information on patients initially seen in the ED and then admitted to the same hospital. The NEDS was created to enable analyses of ED utilization patterns and support public health professionals, administrators, policymakers, and clinicians in their decision making regarding this critical source of care. The NEDS is produced annually beginning in 2006. Over time, the sampling frame for the NEDS has changed; thus, the number of States contributing to the NEDS varies from year to year. The NEDS is intended for national estimates only; no State-level estimates can be produced. The unweighted sample size for the 2008 NEDS is 28,447,148 (weighted, this represents 124,945,264 ED visits). The unweighted sample size for the 2017 NEDS is 33,506,645 (weighted, this represents 144,814,803 ED visits). About the SID The HCUP State Inpatient Databases (SID) are hospital inpatient databases from data organizations participating in HCUP. The SID contain the universe of the inpatient discharge abstracts in the participating HCUP States, translated into a uniform format to facilitate multistate comparisons and analyses. Together, the SID encompass more than 95 percent of all U.S. community hospital discharges. The SID can be used to investigate questions unique to one State, to compare data from two or more States, to conduct market-area variation analyses, and to identify State-specific trends in inpatient care utilization, access, charges, and outcomes. About the SEDD The HCUP State Emergency Department Databases (SEDD) include information from hospital-owned emergency departments (EDs) from data organizations participating in HCUP, translated into a uniform format to facilitate multistate comparisons and analyses. The SEDD capture the universe of records on ED visits in participating HCUP States that do not result in an admission to the same hospital (i.e., patients who are treated in the ED and then discharged, transferred to another hospital, left against medical advice, or died). The SEDD contain a core set of clinical and nonclinical information on all patients, including individuals covered by Medicare, Medicaid, or private insurance, as well as those whose stays were not expected to be covered by insurance. The SEDD can be used to investigate questions unique to one State, to compare data from two or more States, to conduct market-area variation analyses, and to identify State-specific trends in injury surveillance, emerging infections, and other conditions treated in the ED. For More Information For other information on mental and substance use disorders, including suicidal ideation, refer to the HCUP Statistical Briefs located at www.hcup-us.ahrq.gov/reports/statbriefs/sb_mhsa.jsp. For additional HCUP statistics, visit:
For a detailed description of HCUP and more information on the design of the Nationwide Emergency Department Sample (NEDS), State Inpatient Databases (SID), and State Emergency Department Databases (SEDD), please refer to the following database documentation: Agency for Healthcare Research and Quality. Overview of the Nationwide Emergency Department Sample (NEDS). Healthcare Cost and Utilization Project (HCUP). Rockville, MD: Agency for Healthcare Research and Quality. Updated December 2019. www.hcup-us.ahrq.gov/nedsoverview.jsp. Accessed February 3, 2020. Agency for Healthcare Research and Quality. Overview of the State Inpatient Databases (SID). Healthcare Cost and Utilization Project (HCUP). Rockville, MD: Agency for Healthcare Research and Quality. Updated November 2019. www.hcup-us.ahrq.gov/sidoverview.jsp. Accessed February 3, 2020. Agency for Healthcare Research and Quality. Overview of the State Emergency Department Databases (SEDD). Healthcare Cost and Utilization Project (HCUP). Rockville, MD: Agency for Healthcare Research and Quality. Updated January 2020. www.hcup-us.ahrq.gov/seddoverview.jsp. Accessed February 3, 2020. Suggested Citation Owens PL (AHRQ), McDermott KW (IBM Watson Health), Lipari RN (AHRQ), Hambrick MM (AHRQ). Emergency Department Visits Involving Suicidal Ideation or Suicide Attempt, 2008-2017. HCUP Statistical Brief #263. September 2020. Agency for Healthcare Research and Quality, Rockville, MD. www.hcup-us.ahrq.gov/reports/statbriefs/sb263-Suicide-ED-Visits-2008-2017.pdf. Acknowledgments The authors would like to acknowledge the contributions of Marguerite Barrett of M.L. Barrett, Inc. and Minya Sheng and Audrey Weiss of IBM Watson Health. *** AHRQ welcomes questions and comments from readers of this publication who are interested in obtaining more information about access, cost, use, financing, and quality of healthcare in the United States. We also invite you to tell us how you are using this Statistical Brief and other HCUP data and tools, and to share suggestions on how HCUP products might be enhanced to further meet your needs. Please email us at hcup@ahrq.gov or send a letter to the address below:Joel W. Cohen, Ph.D., Director Center for Financing, Access and Cost Trends Agency for Healthcare Research and Quality 5600 Fishers Lane Rockville, MD 20857 This Statistical Brief was posted online on September 8, 2020. a Population rates are presented for the 37 States and the District of Columbia that provided 2017 ED data (ED visits resulting in inpatient admission and treat-and-release ED visits) for HCUP. b Information is presented for the 37 States and the District of Columbia that provided 2017 ED data (ED visits resulting in inpatient admission and treat-and-release ED visits) for HCUP. c Claritas. Claritas Demographic Profile by ZIP Code. https://claritas360.claritas.com/mybestsegments/. d There are no separate codes for suicide attempt under the ICD-9-CM coding system. e Claritas. Claritas Demographic Profile by ZIP Code. https://claritas360.claritas.com/mybestsegments/. |
| Supplemental Table 1. Rate of ED visits related to suicidal ideation or suicide attempt, by age group, 2008-2017, for data presented in Figure 1 | ||||||
| Age Group, Years | Rate of ED Visits per 100,000 Population | |||||
|---|---|---|---|---|---|---|
| 2008 | 2010 | 2012 | 2014 | 2016 | 2017 | |
| 5-9 years | 15.9 | 18.5 | 24.9 | 27.6 | 38.6 | 53.4 |
| 10-14 years | 119.6 | 158.9 | 226.3 | 303.5 | 346.1 | 494.0 |
| 15-19 years | 322.6 | 380.6 | 482.6 | 599.8 | 679.4 | 952.5 |
| 20-24 years | 310.7 | 385.0 | 483.5 | 551.9 | 508.0 | 719.3 |
| 25-44 years | 326.6 | 375.5 | 435.8 | 546.9 | 469.4 | 642.0 |
| 45-64 years | 234.9 | 288.3 | 353.2 | 423.3 | 345.4 | 456.0 |
| 65-79 years | 63.9 | 79.1 | 102.6 | 127.7 | 113.7 | 144.9 |
| 80+ years | 54.5 | 67.8 | 79.5 | 102.6 | 89.8 | 112.1 |
| Supplemental Table 2. Rate of ED visits related to suicidal ideation or suicide attempt, by age group and sex, 2017, for data presented in Figure 2 | |||
| Age | Sex | ED Visit Rate per 100,000 Population | |
|---|---|---|---|
| ED Visit Involving Suicidal Ideation or Suicide Attempt | ED Visit Not Involving Suicidal Ideation or Suicide Attempt | ||
| All ages (5+ years) | Males | 527.8 | 38,499.5 |
| Females | 445.3 | 47,904.7 | |
| 5-9 years | Males | 73.7 | 30,376.4 |
| Females | 32.1 | 27,970.7 | |
| 10-14 years | Males | 322.1 | 25,323.1 |
| Females | 673.2 | 25,199.1 | |
| 15-19 years | Males | 719.6 | 28,314.1 |
| Females | 1,196.9 | 43,672.2 | |
| 20-24 years | Males | 723.6 | 33,476.2 |
| Females | 714.7 | 59,217.8 | |
| 25-44 years | Males | 743.1 | 37,632.0 |
| Females | 540.1 | 54,788.6 | |
| 45-64 years | Males | 564.9 | 39,410.8 |
| Females | 352.2 | 41,935.5 | |
| 65-79 years | Males | 164.7 | 47,783.3 |
| Females | 127.8 | 48,857.3 | |
| 80+ years | Males | 136.6 | 89,028.1 |
| Females | 97.0 | 87,400.5 | |
| Supplemental Table 3. Rate of ED visits related to suicidal ideation or suicide attempt for three age groups, by State, 2017, for data presented in Figure 3 | |||
| ED Visit Rate per 100,000 Population | Age Group, Years | ||
|---|---|---|---|
| 5-24 | 25-64 | 65+ | |
| >700 | CO, IA, MA, ME, MN, MO, MT, ND, NM, OH, RI, WY | DC, IA, MA, ME, MO, MT, NC, NM, NV, OH, RI | - |
| 525 to <700 | CT, IL, IN, KS, NC, NV, OR, SC, UT, WI | AR, CT, IL, IN, KS, KY, MD, MN, ND, OR, SC, UT | - |
| 350 to <525 | AR, AZ, CA, DC, FL, GA, KY, NE, NJ, MD, NY, TN, VT | AZ, CA, CO, FL, GA, MS, NE, NJ, NY, TN, TX, VT, WI, WY | - |
| 150 to <350 | MS, SD, TX | SD | CT, DC, IL, MA, ME, MN, MO, NC, NM, NV, OH, RI |
| <150 | - | - | AR, AZ, CA, CO, FL, GA, IA, IN, KS, KY, MD, MS, MT, ND, NE, NJ, NY, OR, SC, SD, TN, TX, UT, VT, WI, WY |
| Nonparticipating with treat-and-release ED data | AK, AL, DE, HI, ID, LA, MI, NH, OK, PA, VA, WA, WV | AK, AL, DE, HI, ID, LA, MI, NH, OK, PA, VA, WA, WV | AK, AL, DE, HI, ID, LA, MI, NH, OK, PA, VA, WA, WV |
| Supplemental Table 4. Urban-rural area with the highest rate of ED visits related to suicidal ideation or suicide attempt for three age groups, by State, 2017, for data presented in Figure 4 | |||
| Area Within the State With the Highest Population Rate of ED Visits Related to Suicidal Ideation or Suicide Attempt | Age Group, Years | ||
|---|---|---|---|
| 5-24 | 25-64 | 65+ | |
| Large metro | AZ, CO, CT, DC, OH, RI, UT | CT, DC, FL, NV, RI, UT | AR, AZ, CT, DC, FL, KS, NJ, NV, OH, OR, UT, RI |
| Small/medium metro | KS, MA, MD, ME, MT, NC, NM, SC, WI, WY | GA, IA, IL, IN, KS, MA, MD, ME, MT, MN, MO, MS, NC, ND, NE, NM, NJ, SC, TX, WY | IA, IN, MA, MD, MN, MO, MS, MT, NC, ND, NE, NM, SD, TX, WY |
| Rural | CA, IA, IL, NY, SD, VT | AR, SD, VT | - |
| Large metro and small/medium metro | FL, MO, NJ, TN | CO, OH, TN, WI | CO, IL, KY, SC, TN, WI |
| Large metro and rural | NV | - | CA |
| Small/medium metro and rural | AR, GA, IN, MN, MS, ND, NE, TX | KY, NY | ME, NY, VT |
| Large metro, small/medium metro, and rural | KY, OR | AZ, CA, OR | GA |
| Nonparticipating with treat-and-release ED data | AK, AL, DE, HI, ID, LA, MI, NH, OK, PA, VA, WA, WV | AK, AL, DE, HI, ID, LA, MI, NH, OK, PA, VA, WA, WV | AK, AL, DE, HI, ID, LA, MI, NH, OK, PA, VA, WA, WV |
| Internet Citation: Statistical Brief #263. Healthcare Cost and Utilization Project (HCUP). September 2020. Agency for Healthcare Research and Quality, Rockville, MD. hcup-us.ahrq.gov/reports/statbriefs/sb263-Suicide-ED-Visits-2008-2017.jsp. |
| Are you having problems viewing or printing pages on this website? |
| If you have comments, suggestions, and/or questions, please contact hcup@ahrq.gov. |
| If you are experiencing issues related to Section 508 accessibility of information on this website, please contact hcup@ahrq.gov. |
| Privacy Notice, Viewers & Players |
| Last modified 9/8/20 |