STATISTICAL BRIEF #261 |
July 2020
Lan Liang, Ph.D., Brian Moore, Ph.D., and Anita Soni, Ph.D. Introduction Healthcare spending in the United States increased 4.2 percent between 2016 and 2017 to $3.5 trillion, or $10,739 per person, and accounted for 17.9 percent of the Gross Domestic Product.1 Constituting nearly one-third of all healthcare expenditures, hospital spending rose 4.7 percent to $1.1 trillion during the same time period.2 Although this growth represented deceleration compared with the 5.8 percent increase between 2014 and 2015,3 the consistent year-to-year rise in hospital-related expenses remains a central concern among policymakers. In 2016, there were over 35 million hospital stays, equating to 104.2 stays per 100,000 population.4 The average cost per hospital stay was $11,700, making hospitalization one of the most expensive types of healthcare utilization.5 Higher costs are documented for stays among patients with an expected payer of Medicare compared with stays with other expected payers ($13,600 for Medicare vs. $9,300-$12,600 for other payers).6 This Statistical Brief presents data from the Healthcare Cost and Utilization Project (HCUP) on costs of hospital inpatient stays in the United States using the 2017 National Inpatient Sample (NIS). It describes the distribution of costs by primary expected payer and illustrates the conditions accounting for the largest percentage of each payer's hospital costs. Hospital charges were converted to costs using HCUP Cost-to-Charge Ratios.7 The expected payers examined are Medicare, Medicaid, private insurance, and self-pay/no charge. Because of the large sample size of the NIS data, small differences can be statistically significant. Thus, only differences greater than or equal to 10 percent are noted in the text. Hospital costs in this Statistical Brief represent the hospital's costs to produce the services—not the amount paid for services by payers—and they do not include separately billed physician fees associated with the hospitalization. Findings Aggregate hospital inpatient costs and stays by payer, 2017 Figure 1 presents the distribution by primary expected payer for aggregate hospital costs and total hospital inpatient stays in 2017. |
|
|
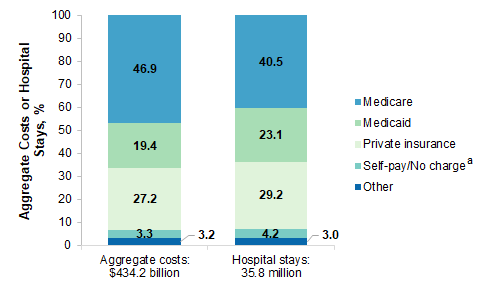
Figure 1. Aggregate hospital costs and hospital stays by primary expected payer, 2017
a Self-pay/No charge: includes self-pay, no charge, charity, and no expected payment. Figure 1 is a bar chart that shows the percentage of aggregate hospital costs and hospital stays that are covered by Medicare, Medicaid, private insurance, self-pay/no charge, and other. Aggregate costs ($434.2 billion): Medicare 46.9%, Medicaid 19.4%, Private insurance 27.2%, Self-pay/No charge 3.3%, Other 3.2%. Hospital stays (35.8 million): Medicare 40.5%, Medicaid 23.1%, Private insurance 29.2%, Self-pay/No charge 4.2%, Other 3.0%. |
Table 1 presents the top 20 most expensive conditions treated in U.S. hospitals across all payers in 2017. The conditions are ranked by aggregate hospital costs. Both the dollar amount and percentage of total aggregate costs associated with the condition are shown. The number and percentage of all hospital stays for each condition also are presented. |
| Table 1. The 20 most expensive conditions treated in U.S. hospitals, all payers, 2017 | |||||
| Rank | Clinical condition grouped by default CCSR category | Aggregate hospital costs, $, millions | Aggregate hospital costs, % | Number of hospital stays, thousands | Hospital stays, % |
|---|---|---|---|---|---|
| 1 | Septicemia | 38,239 | 8.8 | 2,086 | 5.8 |
| 2 | Osteoarthritis | 19,907 | 4.6 | 1,249 | 3.5 |
| 3 | Liveborn | 15,972 | 3.7 | 3,693 | 10.3 |
| 4 | Acute myocardial infarction | 14,342 | 3.3 | 662 | 1.8 |
| 5 | Heart failure | 13,583 | 3.1 | 1,091 | 3.0 |
| 6 | Spondylopathies/spondyloarthropathy (including infective) | 12,305 | 2.8 | 532 | 1.5 |
| 7 | Respiratory failure; insufficiency; arrest | 9,179 | 2.1 | 534 | 1.5 |
| 8 | Coronary atherosclerosis and other heart disease | 8,711 | 2.0 | 374 | 1.0 |
| 9 | Cerebral infarction | 7,402 | 1.7 | 525 | 1.5 |
| 10 | Diabetes mellitus with complication | 7,271 | 1.7 | 658 | 1.8 |
| 11 | Chronic obstructive pulmonary disease and bronchiectasis | 7,013 | 1.6 | 761 | 2.1 |
| 12 | Cardiac dysrhythmias | 6,971 | 1.6 | 613 | 1.7 |
| 13 | Pneumonia (except that caused by tuberculosis) | 6,452 | 1.5 | 637 | 1.8 |
| 14 | Fracture of the neck of the femur (hip), initial encounter | 5,628 | 1.3 | 323 | 0.9 |
| 15 | Complication of other surgical or medical care, injury, initial encounter | 5,608 | 1.3 | 325 | 0.9 |
| 16 | Nonrheumatic and unspecified valve disorders | 5,434 | 1.3 | 124 | 0.3 |
| 17 | Acute and unspecified renal failure | 5,140 | 1.2 | 542 | 1.5 |
| 18 | Biliary tract disease | 4,550 | 1.0 | 357 | 1.0 |
| 19 | Complication of cardiovascular device, implant or graft, initial encounter | 4,455 | 1.0 | 170 | 0.5 |
| 20 | Fracture of the lower limb (except hip), initial encounter | 4,368 | 1.0 | 226 | 0.6 |
| Total for top 20 conditions | 202,529 | 46.6 | 15,484 | 43.3 | |
| Total for all stays | 434,186 | 100.0 | 35,798 | 100.0 | |
| Abbreviations: CCSR, Clinical Classifications Software Refined; ICD-10-CM, International Classification of Diseases, Tenth Revision, Clinical Modification Notes: Diagnosis groups are defined using the CCSR for ICD-10-CM Diagnoses. Conditions were identified using the CCSR default category assignment(s) for the principal diagnosis code of the hospital stay. The CCSR includes multiple category assignments for some diagnosis codes. The default CCSR category assignments facilitate analyses requiring a mutually exclusive diagnosis categorization scheme by selecting a single CCSR category for each hospital encounter based on clinical coding guidelines, clinical input on the etiology and pathology of diseases, coding input on the use of and ordering of ICD-10-CM codes on a billing record, and standards set by other Federal agencies. Source: Agency for Healthcare Research and Quality (AHRQ), Healthcare Cost and Utilization Project (HCUP), National Inpatient Sample (NIS), 2017 | |||||
Most expensive conditions by primary expected payer, 2017 Tables 2 through 5 list the 20 most expensive conditions in 2017 for stays expected to be paid by Medicare, Medicaid, or private insurance, or that were expected to be self-pay/no charge. In summary, similarities across the expected payer categories are described below:
|
| Table 2. The 20 most expensive conditions with an expected payer of Medicare, 2017 | |||||
| Rank | Clinical condition grouped by default CCSR category | Aggregate hospital costs, $, millions | Aggregate hospital costs, % | Number of hospital stays, thousands | Hospital stays, % |
|---|---|---|---|---|---|
| 1 | Septicemia | 22,795 | 11.2 | 1,291 | 8.9 |
| 2 | Osteoarthritis | 11,290 | 5.5 | 713 | 4.9 |
| 3 | Heart failure | 9,397 | 4.6 | 806 | 5.6 |
| 4 | Acute myocardial infarction | 8,007 | 3.9 | 381 | 2.6 |
| 5 | Spondylopathies/spondyloarthropathy (including infective) | 5,791 | 2.8 | 250 | 1.7 |
| 6 | Respiratory failure; insufficiency; arrest | 5,182 | 2.5 | 334 | 2.3 |
| 7 | Coronary atherosclerosis and other heart disease | 5,066 | 2.5 | 217 | 1.5 |
| 8 | Chronic obstructive pulmonary disease and bronchiectasis | 4,981 | 2.4 | 537 | 3.7 |
| 9 | Cardiac dysrhythmias | 4,764 | 2.3 | 417 | 2.9 |
| 10 | Cerebral infarction | 4,607 | 2.3 | 344 | 2.4 |
| 11 | Fracture of the neck of the femur (hip), initial encounter | 4,530 | 2.2 | 267 | 1.8 |
| 12 | Nonrheumatic and unspecified valve disorders | 4,017 | 2.0 | 92 | 0.6 |
| 13 | Pneumonia (except that caused by tuberculosis) | 3,922 | 1.9 | 383 | 2.6 |
| 14 | Diabetes mellitus with complication | 3,637 | 1.8 | 280 | 1.9 |
| 15 | Acute and unspecified renal failure | 3,480 | 1.7 | 373 | 2.6 |
| 16 | Complication of cardiovascular device, implant or graft, initial encounter | 2,774 | 1.4 | 111 | 0.8 |
| 17 | Complication of other surgical or medical care, injury, initial encounter | 2,658 | 1.3 | 151 | 1.0 |
| 18 | Urinary tract infections | 2,560 | 1.3 | 345 | 2.4 |
| 19 | Gastrointestinal hemorrhage | 2,477 | 1.2 | 230 | 1.6 |
| 20 | Complication of internal orthopedic device or implant, initial encounter | 2,369 | 1.2 | 111 | 0.8 |
| Total for top 20 conditions | 114,305 | 56.2 | 7,632 | 52.6 | |
| Total for all stays | 203,533 | 100.0 | 14,514 | 100.0 | |
| Abbreviations: CCSR, Clinical Classifications Software Refined; ICD-10-CM, International Classification of Diseases, Tenth Revision, Clinical Modification Notes: Diagnosis groups are defined using the CCSR for ICD-10-CM Diagnoses. Conditions were identified using the CCSR default category assignment(s) for the principal diagnosis code of the hospital stay. The CCSR includes multiple category assignments for some diagnosis codes. The default CCSR category assignments facilitate analyses requiring a mutually exclusive diagnosis categorization scheme by selecting a single CCSR category for each hospital encounter based on clinical coding guidelines, clinical input on the etiology and pathology of diseases, coding input on the use of and ordering of ICD-10-CM codes on a billing record, and standards set by other Federal agencies. Source: Agency for Healthcare Research and Quality (AHRQ), Healthcare Cost and Utilization Project (HCUP), National Inpatient Sample (NIS), 2017 | |||||
|
| Table 3. The 20 most expensive conditions with an expected payer of Medicaid, 2017 | |||||
| Rank | Clinical condition grouped by default CCSR category | Aggregate hospital costs, $, millions | Aggregate hospital costs, % | Number of hospital stays, thousands | Hospital stays, % |
|---|---|---|---|---|---|
| 1 | Liveborn | 8,177 | 9.7 | 1,704 | 20.6 |
| 2 | Septicemia | 6,687 | 7.9 | 303 | 3.7 |
| 3 | Respiratory failure; insufficiency; arrest | 1,977 | 2.3 | 89 | 1.1 |
| 4 | Complications specified during childbirth | 1,627 | 1.9 | 350 | 4.2 |
| 5 | Diabetes mellitus with complication | 1,620 | 1.9 | 166 | 2.0 |
| 6 | Heart failure | 1,613 | 1.9 | 112 | 1.4 |
| 7 | Schizophrenia spectrum and other psychotic disorders | 1,489 | 1.8 | 165 | 2.0 |
| 8 | Acute myocardial infarction | 1,435 | 1.7 | 62 | 0.8 |
| 9 | Previous C-section | 1,218 | 1.4 | 211 | 2.6 |
| 10 | Cardiac and circulatory congenital anomalies | 1,141 | 1.4 | 14 | 0.2 |
| 11 | Complication of other surgical or medical care, injury, initial encounter | 1,113 | 1.3 | 59 | 0.7 |
| 12 | Pneumonia (except that caused by tuberculosis) | 1,042 | 1.2 | 102 | 1.2 |
| 13 | Spondylopathies/spondyloarthropathy (including infective) | 1,018 | 1.2 | 48 | 0.6 |
| 14 | Skin and subcutaneous tissue infections | 1,000 | 1.2 | 134 | 1.6 |
| 15 | Depressive disorders | 975 | 1.2 | 187 | 2.3 |
| 16 | Hypertension and hypertensive-related conditions complicating pregnancy; childbirth; and the puerperium | 951 | 1.1 | 144 | 1.7 |
| 17 | Traumatic brain injury (TBI); concussion, initial encounter | 944 | 1.1 | 29 | 0.3 |
| 18 | Chronic obstructive pulmonary disease and bronchiectasis | 943 | 1.1 | 103 | 1.2 |
| 19 | Osteoarthritis | 940 | 1.1 | 55 | 0.7 |
| 20 | Alcohol-related disorders | 901 | 1.1 | 121 | 1.5 |
| Total for top 20 conditions | 36,809 | 43.6 | 4,157 | 50.3 | |
| Total for all stays | 84,441 | 100.0 | 8,271 | 100.0 | |
| Abbreviations: CCSR, Clinical Classifications Software Refined; C-section, caesarean section; ICD-10-CM, International Classification of Diseases, Tenth Revision, Clinical Modification Notes: Diagnosis groups are defined using the CCSR for ICD-10-CM Diagnoses. Conditions were identified using the CCSR default category assignment(s) for the principal diagnosis code of the hospital stay. The CCSR includes multiple category assignments for some diagnosis codes. The default CCSR category assignments facilitate analyses requiring a mutually exclusive diagnosis categorization scheme by selecting a single CCSR category for each hospital encounter based on clinical coding guidelines, clinical input on the etiology and pathology of diseases, coding input on the use of and ordering of ICD-10-CM codes on a billing record, and standards set by other Federal agencies. Source: Agency for Healthcare Research and Quality (AHRQ), Healthcare Cost and Utilization Project (HCUP), National Inpatient Sample (NIS), 2017 | |||||
|
| Table 4. The 20 most expensive conditions with an expected payer of private insurance, 2017 | |||||
| Rank | Clinical condition grouped by default CCSR category | Aggregate hospital costs, $, millions | Aggregate hospital costs, % | Number of hospital stays, thousands | Hospital stays, % |
|---|---|---|---|---|---|
| 1 | Osteoarthritis | 6,962 | 5.9 | 437 | 4.2 |
| 2 | Liveborn | 6,747 | 5.7 | 1,702 | 16.3 |
| 3 | Septicemia | 6,644 | 5.6 | 364 | 3.5 |
| 4 | Spondylopathies/spondyloarthropathy (including infective) | 4,491 | 3.8 | 190 | 1.8 |
| 5 | Acute myocardial infarction | 3,774 | 3.2 | 167 | 1.6 |
| 6 | Coronary atherosclerosis and other heart disease | 2,348 | 2.0 | 95 | 0.9 |
| 7 | Heart failure | 1,941 | 1.6 | 121 | 1.2 |
| 8 | Complications specified during childbirth | 1,640 | 1.4 | 347 | 3.3 |
| 9 | Benign neoplasms | 1,575 | 1.3 | 108 | 1.0 |
| 10 | Respiratory failure; insufficiency; arrest | 1,531 | 1.3 | 81 | 0.8 |
| 11 | Complication of other surgical or medical care, injury, initial encounter | 1,510 | 1.3 | 95 | 0.9 |
| 12 | Diabetes mellitus with complication | 1,432 | 1.2 | 143 | 1.4 |
| 13 | Cerebral infarction | 1,428 | 1.2 | 98 | 0.9 |
| 14 | Fracture of the lower limb (except hip), initial encounter | 1,419 | 1.2 | 68 | 0.7 |
| 15 | Cardiac dysrhythmias | 1,393 | 1.2 | 125 | 1.2 |
| 16 | Obesity | 1,374 | 1.2 | 115 | 1.1 |
| 17 | Biliary tract disease | 1,346 | 1.1 | 113 | 1.1 |
| 18 | Previous C-section | 1,314 | 1.1 | 227 | 2.2 |
| 19 | Encounter for antineoplastic therapies | 1,209 | 1.0 | 66 | 0.6 |
| 20 | Cardiac and circulatory congenital anomalies | 1,201 | 1.0 | 20 | 0.2 |
| Total for top 20 conditions | 51,280 | 43.4 | 4,682 | 44.8 | |
| Total for all stays | 118,026 | 100.0 | 10,448 | 100.0 | |
| Abbreviations: CCSR, Clinical Classifications Software Refined; C-section, caesarean section; ICD-10-CM, International Classification of Diseases, Tenth Revision, Clinical Modification Notes: Diagnosis groups are defined using the CCSR for ICD-10-CM Diagnoses. Conditions were identified using the CCSR default category assignment(s) for the principal diagnosis code of the hospital stay. The CCSR includes multiple category assignments for some diagnosis codes. The default CCSR category assignments facilitate analyses requiring a mutually exclusive diagnosis categorization scheme by selecting a single CCSR category for each hospital encounter based on clinical coding guidelines, clinical input on the etiology and pathology of diseases, coding input on the use of and ordering of ICD-10-CM codes on a billing record, and standards set by other Federal agencies. Source: Agency for Healthcare Research and Quality (AHRQ), Healthcare Cost and Utilization Project (HCUP), National Inpatient Sample (NIS), 2017 | |||||
|
| Table 5. The 20 most expensive conditions with an expected payer of self-pay/no chargea, 2017 | |||||
| Rank | Clinical condition grouped by default CCSR category | Aggregate hospital costs, $, millions | Aggregate hospital costs, % | Number of hospital stays, thousands | Hospital stays, % |
|---|---|---|---|---|---|
| 1 | Septicemia | 1,265 | 8.9 | 81 | 5.4 |
| 2 | Acute myocardial infarction | 677 | 4.8 | 32 | 2.1 |
| 3 | Diabetes mellitus with complication | 403 | 2.8 | 52 | 3.4 |
| 4 | Liveborn | 381 | 2.7 | 179 | 11.9 |
| 5 | Heart failure | 338 | 2.4 | 32 | 2.1 |
| 6 | Cerebral infarction | 307 | 2.2 | 22 | 1.4 |
| 7 | Fracture of the lower limb (except hip), initial encounter | 293 | 2.1 | 15 | 1.0 |
| 8 | Skin and subcutaneous tissue infections | 291 | 2.0 | 47 | 3.1 |
| 9 | Biliary tract disease | 286 | 2.0 | 26 | 1.8 |
| 10 | Traumatic brain injury (TBI); concussion, initial encounter | 248 | 1.7 | 12 | 0.8 |
| 11 | Pancreatic disorders (excluding diabetes) | 243 | 1.7 | 30 | 2.0 |
| 12 | Alcohol-related disorders | 237 | 1.7 | 42 | 2.8 |
| 13 | Coronary atherosclerosis and other heart disease | 234 | 1.6 | 12 | 0.8 |
| 14 | Respiratory failure; insufficiency; arrest | 228 | 1.6 | 15 | 1.0 |
| 15 | Acute hemorrhagic cerebrovascular disease | 216 | 1.5 | 7 | 0.4 |
| 16 | Internal organ injury, initial encounter | 210 | 1.5 | 9 | 0.6 |
| 17 | Pneumonia (except that caused by tuberculosis) | 173 | 1.2 | 20 | 1.3 |
| 18 | Depressive disorders | 153 | 1.1 | 42 | 2.8 |
| 19 | Appendicitis and other appendiceal conditions | 153 | 1.1 | 15 | 1.0 |
| 20 | Chronic obstructive pulmonary disease and bronchiectasis | 147 | 1.0 | 20 | 1.3 |
| Total for top 20 conditions | 6,483 | 45.6 | 711 | 47.3 | |
| Total for all stays | 14,214 | 100.0 | 1,503 | 100.0 | |
| Abbreviations: CCSR, Clinical Classifications Software Refined; ICD-10-CM, International Classification of Diseases, Tenth Revision, Clinical Modification Notes: Diagnosis groups are defined using the CCSR for ICD-10-CM Diagnoses. Conditions were identified using the CCSR default category assignment(s) for the principal diagnosis code of the hospital stay. The CCSR includes multiple category assignments for some diagnosis codes. The default CCSR category assignments facilitate analyses requiring a mutually exclusive diagnosis categorization scheme by selecting a single CCSR category for each hospital encounter based on clinical coding guidelines, clinical input on the etiology and pathology of diseases, coding input on the use of and ordering of ICD-10-CM codes on a billing record, and standards set by other Federal agencies. a Self-pay/No charge: includes self-pay, no charge, charity, and no expected payment. Source: Agency for Healthcare Research and Quality (AHRQ), Healthcare Cost and Utilization Project (HCUP), National Inpatient Sample (NIS), 2017 | |||||
About Statistical Briefs Healthcare Cost and Utilization Project (HCUP) Statistical Briefs provide basic descriptive statistics on a variety of topics using HCUP administrative healthcare data. Topics include hospital inpatient, ambulatory surgery, and emergency department use and costs, quality of care, access to care, medical conditions, procedures, and patient populations, among other topics. The reports are intended to generate hypotheses that can be further explored in other research; the reports are not designed to answer in-depth research questions using multivariate methods. Data Source The estimates in this Statistical Brief are based upon data from the HCUP 2017 National Inpatient Sample (NIS). Definitions Diagnoses, ICD-10-CM, Clinical Classifications Software Refined (CCSR) for ICD-10-CM Diagnoses The principal diagnosis is that condition established after study to be chiefly responsible for the patient's admission to the hospital. ICD-10-CM is the International Classification of Diseases, Tenth Revision, Clinical Modification. In October 2015, ICD-10-CM replaced the International Classification of Diseases, Ninth Revision, Clinical Modification (ICD-9-CM) diagnosis coding system with the ICD-10-CM diagnosis coding system for most inpatient and outpatient medical encounters. There are over 70,000 ICD-10-CM diagnosis codes. The CCSR aggregates ICD-10-CM diagnosis codes into a manageable number of clinically meaningful categories.8 The CCSR is intended to be used analytically to examine patterns of healthcare in terms of cost, utilization, and outcomes; rank utilization by diagnoses; and risk-adjust by clinical condition. The CCSR capitalizes on the specificity of the ICD-10-CM coding scheme and allows ICD-10-CM codes to be classified in more than one category. Approximately 10 percent of diagnosis codes are associated with more than one CCSR category because the diagnosis code documents either multiple conditions or a condition along with a common symptom or manifestation. For this Statistical Brief, the principal diagnosis code is assigned to a single default CCSR based on clinical coding guidelines, etiology and pathology of diseases, and standards set by other Federal agencies. The assignment of the default CCSR for the principal diagnosis is available starting with version v2020.2 of the software tool. ICD-10-CM coding definitions for each CCSR category presented in this Statistical Brief can be found in the CCSR reference file, available at www.hcup-us.ahrq.gov/toolssoftware/ccsr/ccs_refined.jsp#user. Types of hospitals included in the HCUP National (Nationwide) Inpatient Sample The National (Nationwide) Inpatient Sample (NIS) is based on data from community hospitals, which are defined as short-term, non-Federal, general, and other hospitals, excluding hospital units of other institutions (e.g., prisons). The NIS includes obstetrics and gynecology, otolaryngology, orthopedic, cancer, pediatric, public, and academic medical center hospitals. Excluded are long-term care facilities such as rehabilitation, psychiatric, and alcoholism and chemical dependency hospitals. Beginning in 2012, long-term acute care hospitals are also excluded. However, if a patient received long-term care, rehabilitation, or treatment for a psychiatric or chemical dependency condition in a community hospital, the discharge record for that stay will be included in the NIS. Unit of analysis The unit of analysis is the hospital discharge (i.e., the hospital stay), not a person or patient. This means that a person who is admitted to the hospital multiple times in 1 year will be counted each time as a separate discharge from the hospital. Costs and charges Total hospital charges were converted to costs using HCUP Cost-to-Charge Ratios based on hospital accounting reports from the Centers for Medicare & Medicaid Services (CMS).9 Costs reflect the actual expenses incurred in the production of hospital services, such as wages, supplies, and utility costs; charges represent the amount a hospital billed for the case. For each hospital, a hospital-wide cost-to-charge ratio is used. Hospital charges reflect the amount the hospital billed for the entire hospital stay and do not include professional (physician) fees. For the purposes of this Statistical Brief, costs are reported to the nearest hundred. How HCUP estimates of costs differ from National Health Expenditure Accounts There are a number of differences between the costs cited in this Statistical Brief and spending as measured in the National Health Expenditure Accounts (NHEA), which are produced annually by CMS.10 The largest source of difference comes from the HCUP coverage of inpatient treatment only in contrast to the NHEA inclusion of outpatient costs associated with emergency departments and other hospital-based outpatient clinics and departments as well. The outpatient portion of hospitals' activities has been growing steadily and may exceed half of all hospital revenue in recent years. On the basis of the American Hospital Association Annual Survey, 2017 outpatient gross revenues (or charges) were about 49 percent of total hospital gross revenues.11 Smaller sources of differences come from the inclusion in the NHEA of hospitals that are excluded from HCUP. These include Federal hospitals (Department of Defense, Veterans Administration, Indian Health Services, and Department of Justice [prison] hospitals) as well as psychiatric, substance abuse, and long-term care hospitals. A third source of difference lies in the HCUP reliance on billed charges from hospitals to payers, adjusted to provide estimates of costs using hospital-wide cost-to-charge ratios, in contrast to the NHEA measurement of spending or revenue. HCUP costs estimate the amount of money required to produce hospital services, including expenses for wages, salaries, and benefits paid to staff as well as utilities, maintenance, and other similar expenses required to run a hospital. NHEA spending or revenue measures the amount of income received by the hospital for treatment and other services provided, including payments by insurers, patients, or government programs. The difference between revenues and costs includes profit for for-profit hospitals or surpluses for nonprofit hospitals. Expected payer To make coding uniform across all HCUP data sources, the primary expected payer for the hospital stay combines detailed categories into general groups:
About HCUP The Healthcare Cost and Utilization Project (HCUP, pronounced "H-Cup") is a family of healthcare databases and related software tools and products developed through a Federal-State-Industry partnership and sponsored by the Agency for Healthcare Research and Quality (AHRQ). HCUP databases bring together the data collection efforts of State data organizations, hospital associations, and private data organizations (HCUP Partners) and the Federal government to create a national information resource of encounter-level healthcare data. HCUP includes the largest collection of longitudinal hospital care data in the United States, with all-payer, encounter-level information beginning in 1988. These databases enable research on a broad range of health policy issues, including cost and quality of health services, medical practice patterns, access to healthcare programs, and outcomes of treatments at the national, State, and local market levels. HCUP would not be possible without the contributions of the following data collection Partners from across the United States: Alaska Department of Health and Social Services Alaska State Hospital and Nursing Home Association Arizona Department of Health Services Arkansas Department of Health California Office of Statewide Health Planning and Development Colorado Hospital Association Connecticut Hospital Association Delaware Division of Public Health District of Columbia Hospital Association Florida Agency for Health Care Administration Georgia Hospital Association Hawaii, University of Hawaii, Hilo, Center for Rural Health Hawaii Laulima Data Alliance Illinois Department of Public Health Indiana Hospital Association Iowa Hospital Association Kansas Hospital Association Kentucky Cabinet for Health and Family Services Louisiana Department of Health Maine Health Data Organization Maryland Health Services Cost Review Commission Massachusetts Center for Health Information and Analysis Michigan Health & Hospital Association Minnesota Hospital Association Mississippi State Department of Health Missouri Hospital Industry Data Institute Montana Hospital Association Nebraska Hospital Association Nevada Department of Health and Human Services New Hampshire Department of Health & Human Services New Jersey Department of Health New Mexico Department of Health New York State Department of Health North Carolina Department of Health and Human Services North Dakota (data provided by the Minnesota Hospital Association) Ohio Hospital Association Oklahoma State Department of Health Oregon Association of Hospitals and Health Systems Oregon Office of Health Analytics Pennsylvania Health Care Cost Containment Council Rhode Island Department of Health South Carolina Revenue and Fiscal Affairs Office South Dakota Association of Healthcare Organizations Tennessee Hospital Association Texas Department of State Health Services Utah Department of Health Vermont Association of Hospitals and Health Systems Virginia Health Information Washington State Department of Health West Virginia Department of Health and Human Resources, West Virginia Health Care Authority Wisconsin Department of Health Services Wyoming Hospital Association About the NIS The HCUP National (Nationwide) Inpatient Sample (NIS) is a nationwide database of hospital inpatient stays. The NIS is nationally representative of all community hospitals (i.e., short-term, non-Federal, nonrehabilitation hospitals). The NIS includes all payers. It is drawn from a sampling frame that contains hospitals comprising more than 95 percent of all discharges in the United States. The vast size of the NIS allows the study of topics at the national and regional levels for specific subgroups of patients. In addition, NIS data are standardized across years to facilitate ease of use. Over time, the sampling frame for the NIS has changed; thus, the number of States contributing to the NIS varies from year to year. The NIS is intended for national estimates only; no State-level estimates can be produced. The unweighted sample size for the 2017 NIS is 7,159,694 (weighted, this represents 35,798,453 inpatient stays). For More Information For other information on costs and charges of hospital stays in the United States, refer to the HCUP Statistical Briefs located at www.hcup-us.ahrq.gov/reports/statbriefs/sb_costs.jsp. For additional HCUP statistics, visit:
For a detailed description of HCUP and more information on the design of the National Inpatient Sample (NIS), please refer to the following database documentation: Agency for Healthcare Research and Quality. Overview of the National (Nationwide) Inpatient Sample (NIS). Healthcare Cost and Utilization Project (HCUP). Rockville, MD: Agency for Healthcare Research and Quality. Updated December 2019. www.hcup-us.ahrq.gov/nisoverview.jsp. Accessed February 3, 2020. Suggested Citation Liang L (AHRQ), Moore B (IBM Watson Health), Soni A (AHRQ). National Inpatient Hospital Costs: The Most Expensive Conditions by Payer, 2017. HCUP Statistical Brief #261. Month 2020. Agency for Healthcare Research and Quality, Rockville, MD. www.hcup-us.ahrq.gov/reports/statbriefs/sb261-Most-Expensive-Hospital-Conditions-2017.pdf. *** AHRQ welcomes questions and comments from readers of this publication who are interested in obtaining more information about access, cost, use, financing, and quality of healthcare in the United States. We also invite you to tell us how you are using this Statistical Brief and other HCUP data and tools, and to share suggestions on how HCUP products might be enhanced to further meet your needs. Please e-mail us at hcup@ahrq.gov or send a letter to the address below:Joel W. Cohen, Ph.D., Director Center for Financing, Access and Cost Trends Agency for Healthcare Research and Quality 5600 Fishers Lane Rockville, MD 20857 This Statistical Brief was posted online on July 14, 2020. 1 Centers for Medicare & Medicaid Services. NHE Fact Sheet. Updated December 5, 2019.www.cms.gov/Research-Statistics-Data-and-Systems/Statistics-Trends-and-Reports/NationalHealthExpendData/NHE-Fact-Sheet. Accessed December 7, 2019. 2 Ibid. 3 Ibid. 4 Freeman WJ, Weiss AJ, Heslin KC. Overview of U.S. Hospital Stays in 2016: Variation by Geographic Region. HCUP Statistical Brief #246. December 2018. Agency for Healthcare Research and Quality, Rockville, MD. www.hcup-us.ahrq.gov/reports/statbriefs/sb246-Geographic-Variation-Hospital-Stays.pdf. Accessed November 27, 2019. 5 Ibid. 6 Ibid. 7 Agency for Healthcare Research and Quality. HCUP Cost-to-Charge Ratio (CCR) Files. Healthcare Cost and Utilization Project (HCUP). 2001-2017. Agency for Healthcare Research and Quality. Updated December 2019. www.hcup-us.ahrq.gov/db/state/costtocharge.jsp. Accessed February 3, 2020. 8 Agency for Healthcare Research and Quality. HCUP Clinical Classifications Software Refined (CCSR) for ICD-10-CM Diagnoses. Healthcare Cost and Utilization Project (HCUP). Agency for Healthcare Research and Quality. Updated January 2020. www.hcup-us.ahrq.gov/toolssoftware/ccsr/ccs_refined.jsp. Accessed February 27, 2020. 9 Agency for Healthcare Research and Quality. HCUP Cost-to-Charge Ratio (CCR) Files. Healthcare Cost and Utilization Project (HCUP). 2001-2017. Agency for Healthcare Research and Quality. Updated December 2019. www.hcup-us.ahrq.gov/db/state/costtocharge.jsp. Accessed February 3, 2020. 10 For additional information about the NHEA, see Centers for Medicare & Medicaid Services (CMS). National Health Expenditure Data. CMS website. Updated December 17, 2019. www.cms.gov/Research-Statistics-Data-and-Systems/Statistics-Trends-and-Reports/NationalHealthExpendData/index.html?redirect=/NationalHealthExpendData/. Accessed February 3, 2020. 11 American Hospital Association. TrendWatch Chartbook, 2019. Table 4.2. Distribution of Inpatient vs. Outpatient Revenues, 1995-2017. www.aha.org/system/files/media/file/2019/11/TrendwatchChartbook-2019-Appendices.pdf. |