STATISTICAL BRIEF #260 |
June 2020
Pamela L. Owens, Ph.D., Audrey J. Weiss, Ph.D., Marguerite L. Barrett, M.S., and Lawrence D. Reid, Ph.D., M.P.H. Introduction Increased use of prescription and nonprescription opioids in the past 20 years has led to substantial increases in opioid-related deaths and hospitalizations. During this time, the number of opioid-related overdose deaths has increased nearly sixfold, from 8,048 in 1999 to 46,802 in 2018.1 Between 2005 and 2017, the rate of opioid-related emergency department (ED) visits nearly tripled from 89.1 to 249.1 per 100,000 population and the rate of opioid-related inpatient stays (IP) more than doubled from 136.8 to 299.7 per 100,000 population.2 In 2017, the U.S. Department of Health and Human Services declared the opioid crisis to be a public health emergency.3 To better understand how and where to target interventions for the opioid crisis, policymakers need to assess the impact of social determinants of health (SDOH) at the community level. SDOH comprise the conditions in which people live that may affect their health.4 From a community context, SDOH can be classified into three key areas:5
This Healthcare Cost and Utilization Project (HCUP) Statistical Brief presents characteristics of U.S. counties based on population rates of opioid-related inpatient stays and treat-and-release ED visits for patients aged 15 years and older using comprehensive information from the 2016 State Inpatient Databases (SID) and State Emergency Department Databases (SEDD) from 35 States and the District of Columbia. County was defined based on patient ZIP Code of residence. |
|
Each county's population rate of opioid-related hospital utilization was compared with the national average: 369.7 inpatient stays per 100,000 population (95% confidence interval [CI]: 357.2, 382.2) and 304.9 ED visits per 100,000 population (95% CI: 278.7, 331.1). Based on whether the county population rates were statistically significantly higher than, lower than, or similar to (i.e., not statistically significantly different from) the national average, counties were categorized into five opioid-related hospital utilization groups: High IP &ED, High IP & Low ED, Low IP & High ED, Low IP & ED, and similar to the average. Additional details are provided under "County groups" in the Definitions section.
Table 1 summarizes the county groups in this analysis, including the region and population estimates. HCUP IP and ED data were available for 2,214 (70.5 percent) of the 3,142 counties in the United States in 2016. Of the 2,214 counties, 8.7 percent had higher-than-average population rates of opioid-related inpatient stays and treat-and-release ED visits (High IP & ED) and nearly half (48.4 percent) had lower-than-average population rates of opioid-related inpatient stays and ED visits (Low IP & ED). |
| Table 1. Population and region of counties with high and low population rates of opioid-related inpatient stays and treat-and-release ED visits across 35 States and the District of Columbia, 2016 | ||||||
| Characteristic | All counties | County group based on population rates of opioid-related IP stays & ED visits | ||||
|---|---|---|---|---|---|---|
| High IP & ED | High IP & Low ED | Low IP & High ED | Low IP & ED | Similar to average | ||
| Counties included in analysis (row percentages) | ||||||
| Number of counties | 2,214 | 193 | 27 | 50 | 1,071 | 873 |
| Counties, % | 100.0 | 8.7 | 1.2 | 2.3 | 48.4 | 39.4 |
| Total population aged 15+ years, no.a | 200,348,800 | 43,568,600 | 6,318,700 | 5,092,000 | 90,676,300 | 54,693,200 |
| Population aged 15+ years, % | 100.0 | 21.7 | 3.2 | 2.5 | 45.3 | 27.3 |
| Counties included in analysis, by region, % (column percentages) | ||||||
| Northeast | 6.3 | 23.8 | 0.0 | 14.0 | 1.6 | 8.0 |
| Midwest | 43.9 | 29.5 | 11.1 | 42.0 | 47.2 | 44.1 |
| South | 39.0 | 36.3 | 74.1 | 30.0 | 43.0 | 34.1 |
| West | 10.7 | 10.4 | 14.8 | 14.0 | 8.1 | 13.7 |
| Abbreviations: ED, emergency department; IP, inpatient a Population counts are rounded to the nearest hundred. Sources: Agency for Healthcare Research and Quality (AHRQ), Healthcare Cost and Utilization Project (HCUP), State Inpatient Databases (SID) and State Emergency Department Databases (SEDD) for 35 States and the District of Columbia, 2016; U.S. Census Bureau American Community Survey for U.S. county and population data, 2016 | ||||||
The purpose of this Statistical Brief is to describe how counties that have high versus low population rates of opioid-related hospital use differ with regard to SDOH. Thus, differences are presented only for counties with high population rates of opioid-related inpatient stays and ED visits (High IP & ED) compared with counties with low population rates of opioid-related inpatient stays and ED visits (Low IP & ED) for the three community SDOH areas: social, educational, and economic characteristics; physical infrastructure; and healthcare characteristics. The High IP & ED and Low IP & ED groups (shaded columns in Table 1) are the only groups further addressed in this Statistical Brief. As noted in the tables, data values presented for each SDOH characteristic represent either the average value across counties or the percentage of counties with the characteristic. All differences between estimates noted in the text are statistically significant at the .05 level or better.
Findings Social, educational, and economic characteristics of counties with high and low population rates of opioid-related inpatient stays and ED visits across 35 States and the District of Columbia, 2016 Table 2 presents the social, educational, and economic characteristics of counties with high and low population rates of opioid-related inpatient stays and treat-and-release ED visits in 2016. |
| Table 2. Social, educational, and economic characteristics of counties with high and low population rates of opioid-related inpatient stays and treat-and-release ED visits across 35 States and the District of Columbia, 2016 | ||
| Characteristic | County group based on population rates of opioid-related inpatient stays and ED visits | |
|---|---|---|
| High IP & ED (N=193) | Low IP & ED (N=1,071) | |
| Demographics | ||
| Age, years, % of population aged 15+ years | ||
| 15-17 | 4.7 | 5.0 |
| 18-44 | 40.7 | 40.4 |
| 45-64 | 34.1 | 33.2 |
| 65+ | 20.5 | 21.4 |
| Female, % of population | 50.7 | 49.8 |
| Race, % of population | ||
| White | 84.8 | 84.5 |
| Black | 7.4 | 8.3 |
| American Indian, Alaska Native | 1.5 | 1.4 |
| Asian, Pacific Islander | 1.8 | 1.5 |
| Other, 2+ races | 4.5 | 4.3 |
| Ethnicity: Hispanic, Latino, % of population | 6.6 | 11.7 |
| Education | ||
| Associate's degree or higher in population aged 25+ years, % of population | 32.0 | 29.9 |
| Poverty/income | ||
| County population in poverty, % of population | 16.8 | 15.6 |
| Occupied units with housing costs at 30+% of household income, % of occupied units | 30.6 | 24.0 |
| Employment | ||
| Unemployment rate, aged 16+ years | 5.4 | 4.8 |
| Social factors | ||
| Children living in single parent households, % of children | 35.6 | 30.9 |
| Affiliated with a religious congregation, % of population | 44.8 | 56.2 |
| Community safety | ||
| Property crime rate per 1,000 population | 23.5 | 16.5 |
| Violent crime rate per 1,000 population | 2.8 | 2.1 |
| Abbreviations: ED, emergency department; IP, inpatient Note: Data values are presented as the average value across the counties in the High IP & ED or Low IP & ED group. Source: Agency for Healthcare Research and Quality (AHRQ), Healthcare Cost and Utilization Project (HCUP), 2016 State Inpatient Databases (SID) and State Emergency Department Databases (SEDD) from 35 States and the District of Columbia; supplemental data sources (see Appendix A.1) | ||
Table 3 presents the physical infrastructure characteristics of counties with high and low opioid-related population rates of inpatient stays and treat-and-release ED visits in 2016. |
| Table 3. Physical infrastructure of counties with high and low population rates of opioid-related inpatient stays and treat-and-release ED visits across 35 States and the District of Columbia, 2016 | ||
| Characteristic | County group based on population rates of opioid-related inpatient stays and ED visits | |
|---|---|---|
| High IP & ED (N=193) | Low IP & ED (N=1,071) | |
| Population | ||
| Population density per square mile | 789.1 | 152.8 |
| Urban/rural designation, % of counties | ||
| Metro | 65.3 | 32.8 |
| Rural-adjacent to metro | 24.4 | 31.3 |
| Rural-remote | 10.4 | 35.9 |
| Residential segregation index, % of counties | ||
| Low segregation (index value 0.6-23.9) | 11.9 | 23.3 |
| Moderate segregation (index value 24.0-40.4) | 38.9 | 44.9 |
| High segregation (index value 40.5-89.1) | 48.7 | 17.6 |
| Segregation index not calculateda | 0.5 | 14.1 |
| Food access | ||
| Food environment index, 0 (worst) to 10 (best) | 7.1 | 7.0 |
| Housing | ||
| Severe housing problems, % of households | 16.7 | 13.7 |
| Abbreviations: ED, emergency department; IP, inpatient Note: Unless otherwise noted, data values are presented as the average value across the counties in the High IP & ED or Low IP & ED group. a No index value is calculated for counties with too little variation in the race of the population (i.e., fewer than 100 non-White people in the county in the time frame). Source: Agency for Healthcare Research and Quality (AHRQ), Healthcare Cost and Utilization Project (HCUP), 2016 State Inpatient Databases (SID) and State Emergency Department Databases (SEDD) from 35 States and the District of Columbia; supplemental data sources (see Appendix A.1) | ||
|
|
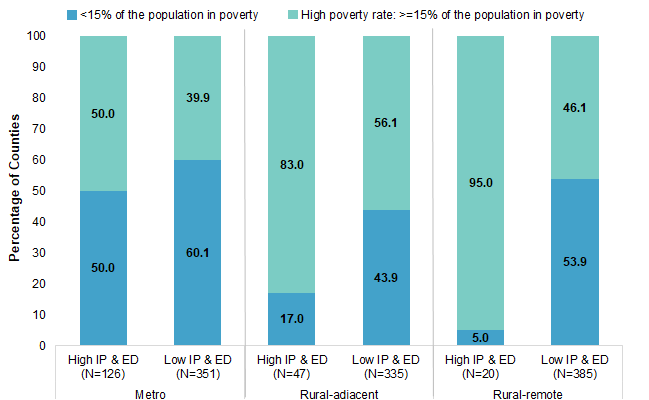
Figure 1. Urban-rural location and poverty level in counties with high and low population rates of opioid-related inpatient stays and treat-and-release ED visits across 35 States and the District of Columbia, 2016
Abbreviations: ED, emergency department; IP, inpatient Bar chart that shows the percentage of counties with high and low population rates of opioid-related inpatient stays and treat-and-release emergency department visits in metro, rural-adjacent, and rural-remote areas by poverty level in 2016. Data are provided in Supplemental Table 1. |
Table 4 describes the availability of and access to healthcare in counties with high and low population rates of opioid-related inpatient stays and treat-and-release ED visits in 2016. |
| Table 4. Availability of and access to healthcare in counties with high and low population rates of opioid-related inpatient stays and treat-and-release ED visits across 35 States and the District of Columbia, 2016 | ||
| Characteristic | County group based on population rates of opioid-related IP stays & ED visits | |
|---|---|---|
| High IP & ED (N=193) | Low IP & ED (N=1,071) | |
| Availability of services | ||
| Total beds per 100,000 population | 231.5 | 222.5 |
| Federally Qualified Health Centers, no. | 7.1 | 2.0 |
| Primary care physicians per 100,000 population | 57.5 | 42.9 |
| Psychiatrists per 100,000 population | 8.2 | 3.3 |
| Psychiatric beds per 100,000 population | 13.3 | 7.5 |
| Buprenorphine providers per 100,000 populationa | 11.8 | 2.9 |
| Pharmacy density per 100 square miles | 15.0 | 2.4 |
| Access to care: insurance, % of population | ||
| Medicare enrollment | 19.8 | 19.5 |
| Medicaid enrollment | 22.2 | 18.2 |
| Private insurance coverage | 64.6 | 66.3 |
| Uninsured | 10.1 | 12.3 |
| Abbreviations: ED, emergency department; IP, inpatient Note: Data values are presented as the average value across the counties in the High IP & ED or Low IP & ED group. a Buprenorphine is an opioid used to treat opioid use disorder, acute pain, and chronic pain. Source: Agency for Healthcare Research and Quality (AHRQ), Healthcare Cost and Utilization Project (HCUP), 2016 State Inpatient Databases (SID) and State Emergency Department Databases (SEDD) from 35 States and the District of Columbia; supplemental data sources (see Appendix A.1) | ||
|
| Table 5. Opioid-related activities, policies, prescribing rate, and mortality in counties with high and low population rates of opioid-related inpatient stays and treat-and-release ED visits across 35 States and the District of Columbia, 2016 | ||
| Characteristic | County group based on population rates of opioid-related IP stays & ED visits | |
|---|---|---|
| High IP & ED (N=193) | Low IP & ED (N=1,071) | |
| State-level opioid-related activity and healthcare policies | ||
| Law enforcement seizures of fentanyl, no. | 1,852.2 | 336.3 |
| Naloxone prescriptions permitted for third parties, % of countiesa | 92.2 | 82.7 |
| Prescription drug monitoring program (PDMP) permitted to share data with other PDMPs, % of counties | 86.0 | 79.6 |
| Prescribers required to check PDMP before prescribing controlled substances, % of counties | 58.5 | 10.6 |
| Medicaid expansion State, % of counties | 73.1 | 39.4 |
| County-level opioid prescribing rate | ||
| Opioid prescribing rate per 100 residents per year | 89.8 | 61.6 |
| State-level opioid prescribing rate | ||
| Opioid mortality rate per 100,000 population | 19.8 | 8.9 |
| Abbreviations: ED, emergency department; IP, inpatient Note: Unless otherwise noted, data values are presented as the average value across the counties in the High IP & ED or Low IP & ED group. a Naloxone is an opioid antagonist and is designed to rapidly reverse the effects of an opioid overdose. Source: Agency for Healthcare Research and Quality (AHRQ), Healthcare Cost and Utilization Project (HCUP), 2016 State Inpatient Databases (SID) and State Emergency Department Databases (SEDD) from 35 States and the District of Columbia; supplemental data sources (see Appendix A.1) | ||
About Statistical Briefs Healthcare Cost and Utilization Project (HCUP) Statistical Briefs provide basic descriptive statistics on a variety of topics using HCUP administrative healthcare data. Topics include hospital inpatient, ambulatory surgery, and emergency department use and costs, quality of care, access to care, medical conditions, procedures, and patient populations, among other topics. The reports are intended to generate hypotheses that can be further explored in other research; the reports are not designed to answer in-depth research questions using multivariate methods. Data Source The estimates in this Statistical Brief are based upon data from the HCUP 2016 State Inpatient Databases (SID) and State Emergency Department Databases (SEDD) from 35 States and the District of Columbia: Arkansas, Arizona, California, Connecticut, District of Columbia, Florida, Hawaii, Illinois, Indiana, Iowa, Kansas, Kentucky, Maine, Maryland, Massachusetts, Minnesota, Mississippi, Missouri, Montana, North Carolina, North Dakota, Nebraska, Nevada, New Jersey, New York, Ohio, Oregon, Rhode Island, South Carolina, South Dakota, Tennessee, Texas, Utah, Vermont, Wisconsin, and Wyoming. Supplemental data sources used for the county characteristics, including detailed descriptions of each county characteristic and data source websites, are presented in Appendix A.1, available as a separate, supplemental file associated with this Statistical Brief on the HCUP-US website at www.hcup-us.ahrq.gov/reports/statbriefs/sb260-appendix.pdf. Whenever possible, data from 2016 was used. In some cases, only data from an earlier or later time period were available. Definitions Diagnoses and ICD-10-CM The principal diagnosis is that condition established after study to be chiefly responsible for the patient's admission to the hospital. Secondary diagnoses are concomitant conditions that coexist at the time of admission or develop during the stay. All-listed diagnoses include the principal diagnosis plus these additional secondary conditions. ICD-10-CM is the International Classification of Diseases, Tenth Revision, Clinical Modification. In October 2015, ICD-10-CM replaced the ICD-9-CM diagnosis with the ICD-10-CM diagnosis coding system for most inpatient and outpatient medical encounters. There are over 70,000 ICD-10-CM diagnosis codes. Case definition The following ICD-10-CM diagnosis codes were used to define opioid-related inpatient stays and ED visits:
The opioid diagnosis could be either a principal or secondary diagnosis. A full list of the individual ICD-10-CM codes used in the definition of opioid-related inpatient stays and ED visits is provided in Appendix A.2, available as a separate, supplemental file associated with this Statistical Brief on the HCUP-US website at www.hcup-us.ahrq.gov/reports/statbriefs/sb260-appendix.pdf. County assignment Patient county was assigned based on the ZIP Code of the patient's residence using the SAS function for ZIP Code to county assignment. For ZIP Codes that cross county boundaries, the SAS function used the geographic centroid of the ZIP Code to assign the county.7 If the patient's ZIP Code indicated that the patient was homeless (HCUP data element ZIP = "H"), then the patient county was assigned to be the same as the hospital county. Records for patients with a ZIP Code that was missing, invalid, or indicated that the person was from a foreign country were excluded from the tabulated counts. This exclusion dropped less than 1 percent of records. County groups Counties were classified into five opioid-related hospital utilization population rate groups based on comparison of the 95 percent confidence interval around each county's population rate of opioid-related inpatient stays and emergency department (ED) visits compared with the 95 percent confidence interval around the national average rate (inpatient: 369.7 per 100,000 population; ED: 304.9 per 100,000 population), (see Table 6). Statistical significance was conservatively defined as nonoverlapping 95 percent confidence intervals. The focus of this Statistical Brief was the comparisons of counties described by the bolded text (High IP & ED and Low IP & ED groups).
|
| Table 6. Distribution of counties based on population rates of opioid-related inpatient stays and treat-and-release ED visits compared with the national average across 35 States and the District of Columbia, 2016 | ||||
| Number of counties based on comparison of opioid-related inpatient stay population rate to national average | Number of counties based on comparison of opioid-related ED visit population rate to national average | |||
|---|---|---|---|---|
| Above U.S. average | Similar to U.S. average | Below U.S. average | Total | |
| Above U.S. average | 193a | 80e | 27b | 300 |
| Similar to U.S. average | 102e | 209e | 173e | 484 |
| Below U.S. average | 50c | 309e | 1,071d | 1,430 |
| Total | 345 | 598 | 1,271 | 2,214 |
| Abbreviations: ED, emergency department; IP, inpatient Note: Classification was based on comparison of county-level population rates to the U.S. average rate. Counties with population rates that were statistically significantly above the U.S. average rate were classified as "above U.S. average." Counties with population rates that were statistically significantly below the U.S. average rate were classified as "below U.S. average." Counties that were not statistically significantly different from the national average were classified as "similar to U.S. average." a These counties were classified as having high population rates of opioid-related inpatient stays and ED visits (High IP & ED county group). b These counties were classified as having high population rates of opioid-related inpatient stays and low population rates of opioid-related ED visits (High IP & Low ED county group). c These counties were classified as having low population rates of opioid-related inpatient stays and high population rates of opioid-related ED visits (Low IP & High ED county group). d These counties were classified as having low population rates of opioid-related inpatient stays and ED visits (Low IP & ED county group). e These counties were classified as having population rates of opioid-related inpatient stays and/or ED visits that were similar to the U.S. national average population rates (similar to average county group). Source: Agency for Healthcare Research and Quality (AHRQ), Healthcare Cost and Utilization Project (HCUP), State Inpatient Databases (SID) and State Emergency Department Databases (SEDD) for 35 States and the District of Columbia, 2016 | ||||
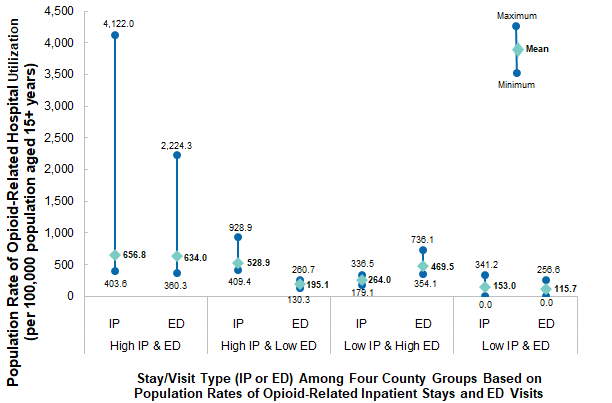
Figure 2 provides the county-level mean and range of the population rates of opioid-related inpatient stays and ED visits in the four county groups classified as having high and/or low opioid-related hospitalization. Counties with extreme outliers were not removed from this analysis in order to include all counties; however, it is important to note that the high-end outliers may increase the overall mean.
|
|
Figure 2. County-level mean and range of the population rates of opioid-related inpatient stays and treat-and-release ED visits among counties with high and low population rates of opioid-related hospital utilization across 35 States and the District of Columbia, 2016
Abbreviations: ED, emergency department; IP, inpatient Line chart that shows the maximum, minimum, and mean of the population rate of opioid-related hospital utilization per 100,000 population aged 15+ years for inpatient stays and emergency department visits in counties with high and low population rates across 35 States and the District of Columbia in 2016. Data are provided in Supplemental Table 2. |
Types of hospitals included in HCUP State Inpatient Databases This analysis used State Inpatient Databases (SID) limited to data from community hospitals, which are defined as short-term, non-Federal, general, and other hospitals, excluding hospital units of other institutions (e.g., prisons). Community hospitals include obstetrics and gynecology, otolaryngology, orthopedic, cancer, pediatric, public, and academic medical center hospitals. Excluded for this analysis are long-term care facilities such as rehabilitation, psychiatric, and alcoholism and chemical dependency hospitals. However, if a patient received long-term care, rehabilitation, or treatment for a psychiatric or chemical dependency condition in a community hospital, the discharge record for that stay was included in the analysis. Types of hospitals included in HCUP State Emergency Department Databases This analysis used State Emergency Department Databases (SEDD) limited to data from community hospitals with a hospital-owned emergency department. Community hospitals are defined as short-term, non-Federal, general, and other hospitals, excluding hospital units of other institutions (e.g., prisons). Community hospitals include specialty, pediatric, public, and academic medical center hospitals. Excluded for this analysis are long-term care facilities such as rehabilitation, psychiatric, and alcoholism and chemical dependency hospitals. Unit of analysis The unit of analysis in this Statistical Brief is the county. The county groups, defined by population rates of opioid-related hospital utilization, are based on the hospital discharge (i.e., the hospital stay) or emergency department (ED) visit, not individual patients. A patient admitted to the hospital multiple times in 1 year will be counted each time as a separate discharge from the hospital, and a patient seen in the ED multiple times in 1 year will be counted each time as a separate ED visit. Region Region is one of the four regions defined by the U.S. Census Bureau:
About HCUP The Healthcare Cost and Utilization Project (HCUP, pronounced "H-Cup") is a family of healthcare databases and related software tools and products developed through a Federal-State-Industry partnership and sponsored by the Agency for Healthcare Research and Quality (AHRQ). HCUP databases bring together the data collection efforts of State data organizations, hospital associations, and private data organizations (HCUP Partners) and the Federal government to create a national information resource of encounter-level healthcare data. HCUP includes the largest collection of longitudinal hospital care data in the United States, with all-payer, encounter-level information beginning in 1988. These databases enable research on a broad range of health policy issues, including cost and quality of health services, medical practice patterns, access to healthcare programs, and outcomes of treatments at the national, State, and local market levels. HCUP would not be possible without the contributions of the following data collection Partners from across the United States: Alaska Department of Health and Social Services Alaska State Hospital and Nursing Home Association Arizona Department of Health Services Arkansas Department of Health California Office of Statewide Health Planning and Development Colorado Hospital Association Connecticut Hospital Association Delaware Division of Public Health District of Columbia Hospital Association Florida Agency for Health Care Administration Georgia Hospital Association University of Hawaii, Hilo, Center for Rural Health Science Hawaii Laulima Data Alliance Illinois Department of Public Health Indiana Hospital Association Iowa Hospital Association Kansas Hospital Association Kentucky Cabinet for Health and Family Services Louisiana Department of Health Maine Health Data Organization Maryland Health Services Cost Review Commission Massachusetts Center for Health Information and Analysis Michigan Health & Hospital Association Minnesota Hospital Association Mississippi State Department of Health Missouri Hospital Industry Data Institute Montana Hospital Association Nebraska Hospital Association Nevada Department of Health and Human Services New Hampshire Department of Health & Human Services New Jersey Department of Health New Mexico Department of Health New York State Department of Health North Carolina Department of Health and Human Services North Dakota (data provided by the Minnesota Hospital Association) Ohio Hospital Association Oklahoma State Department of Health Oregon Association of Hospitals and Health Systems Oregon Office of Health Analytics Pennsylvania Health Care Cost Containment Council Rhode Island Department of Health South Carolina Revenue and Fiscal Affairs Office South Dakota Association of Healthcare Organizations Tennessee Hospital Association Texas Department of State Health Services Utah Department of Health Vermont Association of Hospitals and Health Systems Virginia Health Information Washington State Department of Health West Virginia Department of Health and Human Resources, West Virginia Health Care Authority Wisconsin Department of Health Services Wyoming Hospital Association About the SID The HCUP State Inpatient Databases (SID) are hospital inpatient databases from data organizations participating in HCUP. The SID contain the universe of the inpatient discharge abstracts in the participating HCUP States, translated into a uniform format to facilitate multistate comparisons and analyses. Together, the SID encompass more than 95 percent of all U.S. community hospital discharges. The SID can be used to investigate questions unique to one State, to compare data from two or more States, to conduct market-area variation analyses, and to identify State-specific trends in inpatient care utilization, access, charges, and outcomes. About the SEDD The HCUP State Emergency Department Databases (SEDD) include information from hospital-owned emergency departments (EDs) from data organizations participating in HCUP, translated into a uniform format to facilitate multistate comparisons and analyses. The SEDD capture the universe of records on ED visits in participating HCUP States that do not result in an admission to the same hospital (i.e., patients who are treated in the ED and then discharged, transferred to another hospital, left against medical advice, or died). The SEDD contain a core set of clinical and nonclinical information on all patients, including individuals covered by Medicare, Medicaid, or private insurance, as well as those whose stays were not expected to be covered by insurance. The SEDD can be used to investigate questions unique to one State, to compare data from two or more States, to conduct market-area variation analyses, and to identify State-specific trends in injury surveillance, emerging infections, and other conditions treated in the ED. For More Information For other information on mental and substance use disorders, including opioids, refer to the HCUP Statistical Briefs located at www.hcup-us.ahrq.gov/reports/statbriefs/sb_mhsa.jsp. For additional HCUP statistics, visit:
For a detailed description of HCUP and more information on the design of the State Inpatient Databases (SID) and State Emergency Department Databases (SEDD), please refer to the following database documentation: Agency for Healthcare Research and Quality. Overview of the State Inpatient Databases (SID). Healthcare Cost and Utilization Project (HCUP). Rockville, MD: Agency for Healthcare Research and Quality. Updated November 2019. www.hcup-us.ahrq.gov/sidoverview.jsp. Accessed February 3, 2020. Agency for Healthcare Research and Quality. Overview of the State Emergency Department Databases (SEDD). Healthcare Cost and Utilization Project (HCUP). Rockville, MD: Agency for Healthcare Research and Quality. Updated January 2020. www.hcup-us.ahrq.gov/seddoverview.jsp. Accessed February 3, 2020. Suggested Citation Owens PL (AHRQ), Weiss AJ (IBM Watson Health), Barrett ML (M.L. Barrett, Inc.), Reid LD (AHRQ). Social Determinants of Health and County Population Rates of Opioid-Related Inpatient Stays and Emergency Department Visits, 2016. HCUP Statistical Brief #260. June 2020. Agency for Healthcare Research and Quality, Rockville, MD. www.hcup-us.ahrq.gov/reports/statbriefs/sb260-Social-Determinants-County-Opioid-Rates-Hospital-Use-2016.pdf. Acknowledgments The authors would like to acknowledge the contributions of Kim McDermott and Minya Sheng of IBM Watson Health. *** AHRQ welcomes questions and comments from readers of this publication who are interested in obtaining more information about access, cost, use, financing, and quality of healthcare in the United States. We also invite you to tell us how you are using this Statistical Brief and other HCUP data and tools, and to share suggestions on how HCUP products might be enhanced to further meet your needs. Please e-mail us at hcup@ahrq.gov or send a letter to the address below:Joel W. Cohen, Ph.D., Director Center for Financing, Access and Cost Trends Agency for Healthcare Research and Quality 5600 Fishers Lane Rockville, MD 20857 This Statistical Brief was posted online on June 30, 2020. 1 National Institute on Drug Abuse. Overdose Death Rates. Revised March 2020. www.drugabuse.gov/related-topics/trends-statistics/overdose-death-rates. Accessed May 15, 2020. 2 Healthcare Cost and Utilization Project. HCUP Fast Stats - Opioid-Related Hospital Use. www.hcup-us.ahrq.gov/faststats/OpioidUseServlet?setting1=IP. Accessed May 15, 2020. 3 U.S. Department of Health and Human Services. What Is the U.S. Opioid Epidemic? Updated September 4, 2019. www.hhs.gov/opioids/about-the-epidemic/index.html. Accessed October 14, 2019. 4 World Health Organization. About Social Determinants of Health. www.who.int/social_determinants/sdh_definition/en/. 5 Agency for Healthcare Research and Quality. Social Determinants of Health (SDOH). www.ahrq.gov/sdoh/index.html. Accessed February 25, 2020. 6 Percentage of the county population in poverty was obtained from the American Community Survey, U.S. Census Bureau, 2016. The national average poverty rate in 2016 was obtained from the U.S. Census Bureau Report #P60-259, Income and Poverty in the United States: 2016, published September 12, 2017. www.census.gov/library/publications/2017/demo/p60-259.html. Accessed May 5, 2020. 7 Additional information from SAS on the geocode procedure is available at SAS. Understanding ZIP Code Geocoding. support.sas.com/documentation/cdl/en/graphref/65389/HTML/default/viewer.htm#n1cqwrpowwd4l6n1lmw39ughjpuh.htm. Accessed January 25, 2020. |
| Supplemental Table 1. Urban-rural location and poverty level in counties with high and low population rates of opioid-related inpatient stays and treat-and-release ED visits across 35 States and the District of Columbia, 2016, for data presented in Figure 1 | ||
| Location | <15% of the population in poverty | High poverty rate: >15% of the population in poverty |
|---|---|---|
| Metro | ||
| High IP and ED (N=126) | 50.0 | 50.0 |
| Low IP and ED (N=351) | 60.1 | 39.9 |
| Rural-adjacent | ||
| High IP and ED (N=47) | 17.0 | 83.0 |
| Low IP and ED (N=335) | 43.9 | 56.1 |
| Rural-remote | ||
| High IP and ED (N=20) | 5.0 | 95.0 |
| Low IP and ED (N=385) | 53.9 | 46.1 |
| Abbreviations: ED, emergency department; IP, inpatient | ||
| Supplemental Table 2. County-level mean and range of the population rates of opioid-related inpatient stays and treat-and-release ED visits among counties with high and low population rates of opioid-related hospital utilization across 35 States and the District of Columbia, 2016, for data presented in Figure 2 | ||||||||
| Measure | High IP and ED | High IP and low ED | Low IP and high ED | Low IP and ED | ||||
|---|---|---|---|---|---|---|---|---|
| IP | ED | IP | ED | IP | ED | IP | ED | |
| Max | 4122.0 | 2224.3 | 928.9 | 260.7 | 336.5 | 736.1 | 341.2 | 256.6 |
| Mean | 656.8 | 634.0 | 528.9 | 195.1 | 264.0 | 469.5 | 153.0 | 115.7 |
| Min | 403.6 | 360.3 | 409.4 | 130.3 | 179.1 | 354.1 | 0.0 | 0.0 |
| Abbreviations: ED, emergency department; IP, inpatient | ||||||||