STATISTICAL BRIEF #257 |
May 2020
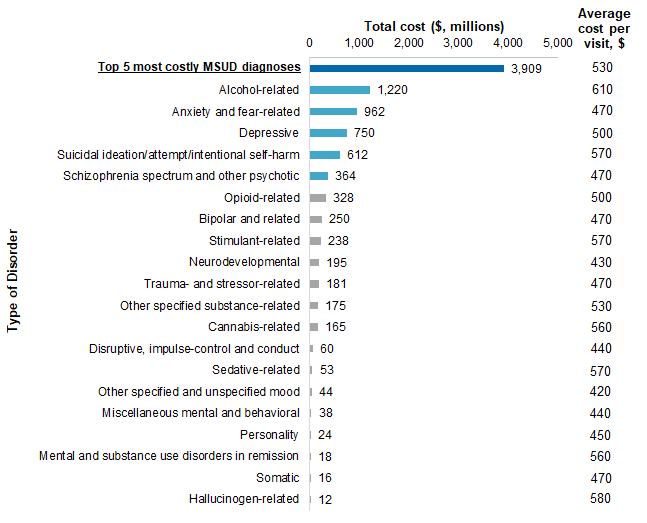
(Revised October 2020)* Zeynal Karaca, Ph.D., and Brian J. Moore, Ph.D. Introduction Hospital emergency department (ED) visits have been growing rapidly, with the rate of increase exceeding that for hospital inpatient care.1 The rate of ED visits for mental health and substance abuse diagnoses increased 44.1 percent from 2006 to 2014, to a rate of 20.3 visits per 1,000 population.2 According to a 2016 study, ED episodes of care payments represented 12.5 percent of national health expenditures in 2010.3 Therefore, service delivery costs associated with ED visits are an important health policy concern. Service delivery costs specific to hospital ED use can now be estimated using newly developed Cost-to-Charge Ratios (CCRs) for ED data from the Healthcare Cost and Utilization Project (HCUP). This HCUP Statistical Brief presents statistics on the costs of ED visits with diagnoses of mental and substance use disorders (MSUDs) in the United States using the 2017 Nationwide Emergency Department Sample (NEDS). ED visits include patients treated and released from the ED as well as those admitted to the same hospital through the ED. Total (aggregate) and average costs for MSUD ED visits are presented by MSUD diagnosis category. Total and average costs for MSUD ED visits are also presented by select patient and hospital characteristics compared with costs for all ED visits. The distribution of total ED visit costs for the five most costly MSUD diagnoses is presented by patient age group and primary expected payer. Because of the large sample size of the NEDS data, small differences can be statistically significant. Thus, only percentage differences in estimates or proportions greater than or equal to 10 percent are discussed in the text. Findings Costs for MSUD ED visits by most costly diagnoses, 2017 Figure 1 presents total and average emergency department (ED) visit costs for the 20 highest cost mental and substance use disorder (MSUD) diagnoses in 2017. Bars in Figure 1 represent the total ED visit cost associated with the diagnosis; the column to the right in the figure provides the average ED visit cost for each diagnosis group. The first- and second-listed diagnoses were used for this analysis; therefore, a single MSUD ED visit can be counted in more than one MSUD diagnosis group (e.g., depressive disorders and alcohol-related disorders) if the ED visit record indicated more than one type of MSUD diagnosis. Thus, the sum of MSUD ED visit costs across diagnoses will not agree with total ED visit costs reported in Tables 1 and 2 because some ED visits are counted in more than one diagnosis category in Figure 1. |
|
|
Figure 1. Total and average ED visit costs for the most costly MSUD diagnoses, 2017
Abbreviations: ED, emergency department; ICD-10-CM, International Classification of Diseases, Tenth Revision, Clinical Modification; MSUD, mental and substance use disorder Horizontal bar chart that shows the total and average costs for mental and substance use disorder emergency department visits for 20 diagnoses in 2017. Data are provided in Supplemental Table 1. |
Table 1 presents the distribution of total costs and the average cost per visit for MSUD ED visits and all ED visits by select patient characteristics in 2017. |
| Table 1. Percentage of total costs and average costs for MSUD ED visits by patient characteristics, 2017 | ||||
| Patient characteristic | Mental and substance use disorder ED visits (N=10.7 million visits; $5.6 billion total costs) | Total ED visits (N=144.8 million visits; $76.3 billion total costs) | ||
|---|---|---|---|---|
| Total costs, % | Average cost per visit, $ | Total costs, % | Average cost per visit, $ | |
| Total | 100.0 | 520 | 100.0 | 530 |
| Age group, years | ||||
| 0-9 | 1.1 | 340 | 5.6 | 250 |
| 10-14 | 3.2 | 440 | 2.4 | 340 |
| 15-17 | 4.5 | 490 | 2.3 | 420 |
| 18-44 | 50.4 | 500 | 35.0 | 490 |
| 45-64 | 31.8 | 570 | 28.6 | 630 |
| 65+ | 9.1 | 630 | 26.4 | 690 |
| Sex | ||||
| Male | 52.3 | 520 | 44.1 | 520 |
| Female | 47.7 | 530 | 55.9 | 530 |
| Primary expected payer | ||||
| Medicare | 18.5 | 560 | 30.1 | 660 |
| Medicaid | 36.0 | 500 | 25.0 | 420 |
| Private insurance | 26.1 | 550 | 30.3 | 560 |
| Self-pay/No chargea | 15.7 | 500 | 10.6 | 460 |
| Other | 3.4 | 540 | 3.7 | 510 |
| Discharge from ED | ||||
| Routine | 70.3 | 530 | 80.8 | 530 |
| Transfer to short-term hospital | 3.3 | 800 | 3.5 | 1,160 |
| Transfer to other facility | 10.2 | 680 | 2.7 | 1,030 |
| Home health care | 0.4 | 1,190 | 0.8 | 1,930 |
| Against medical advice | 2.0 | 500 | 1.3 | 450 |
| Inpatient admission | 12.5 | 360 | 9.4 | 360 |
| Died in ED | 0.1 | 1,030 | 0.3 | 1,190 |
| Destination unknown | 0.4 | 750 | 0.4 | 1,060 |
| Abbreviation: ED, emergency department; MSUD, mental and substance use disorder Notes: Statistics for ED visits with missing or invalid patient characteristics are not presented. In 2017, about 13% of all ED visits (weighted) in the NEDS are missing information about ED charges and therefore ED cost cannot be estimated. Estimates of the total cost use the product of the number of cases and the average estimated cost to account for records with missing information. The share of total costs is calculated with unrounded numbers. Total cost decompositions among different descriptive statistics or utilizing multiple levels of aggregation in a single computation could lead to slightly different total cost estimates due to the use of slightly different and more specific estimates of the missing information. Therefore, the share of total cost across characteristic values may not sum to 100. Average cost estimates are rounded to the nearest $10. a Self-pay/No charge: includes self-pay, no charge, charity, and no expected payment. Source: Agency for Healthcare Research and Quality (AHRQ), Healthcare Cost and Utilization Project (HCUP), Nationwide Emergency Department Sample (NEDS), 2017 | ||||
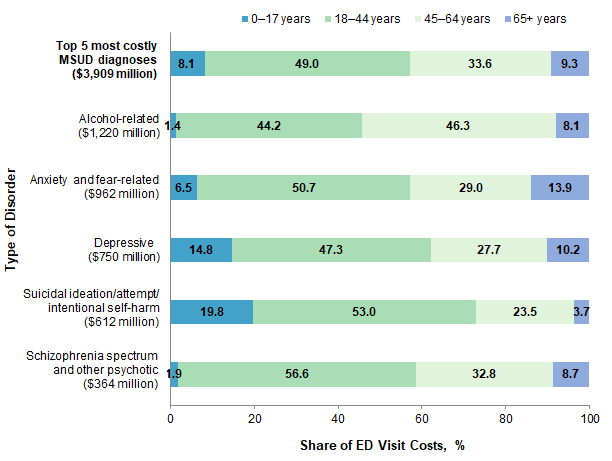
Figure 2 presents the distribution of ED visit costs by age group for the five most costly MSUD diagnoses in 2017. |
|
Figure 2. Distribution of total ED visit costs for the five most costly MSUD diagnoses, by age group, 2017
Abbreviations: ED, emergency department; ICD-10-CM, International Classification of Diseases, Tenth Revision, Clinical Modification; MSUD, mental and substance use disorder Horizontal bar chart that shows the distribution of emergency department visit costs by age group for the five most expensive mental and substance use disorder diagnoses in 2017. Data are provided in Supplemental Table 2. |
|
|
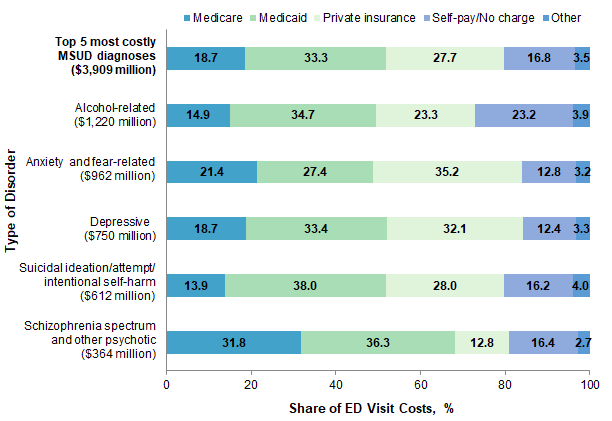
Figure 3. Distribution of total ED visit costs for the five most costly MSUD diagnoses, by primary expected payer, 2017
Abbreviations: ED, emergency department; ICD-10-CM, International Classification of Diseases, Tenth Revision, Clinical Modification; MSUD, mental and substance use disorder Horizontal bar chart that shows the distribution of emergency department visit costs by primary payer for the five most expensive mental and substance use disorder diagnoses in 2017. Data are provided in Supplemental Table 3. |
Table 2 presents the distribution of total costs and the average cost per visit for MSUD ED visits and all ED visits by select hospital characteristics in 2017. |
| Table 2. Percentage of total costs and average costs for MSUD ED visits by hospital characteristics, 2017 | ||||
| Hospital characteristic | Mental and substance use disorder ED visits (N=10.7 million visits; $5.6 billion total costs) | Total ED visits (N=144.8 million visits; $76.3 billion total costs) | ||
|---|---|---|---|---|
| Total costs, % | Average cost per visit, $ | Total costs, % | Average cost per visit, $ | |
| Total | 100.0 | 520 | 100.0 | 530 |
| Region | ||||
| Northeast | 23.1 | 520 | 18.8 | 550 |
| Midwest | 23.4 | 560 | 24.3 | 560 |
| South | 31.0 | 480 | 36.1 | 480 |
| West | 25.3 | 640 | 23.5 | 650 |
| Location | ||||
| Large metropolitan | 55.9 | 540 | 52.8 | 540 |
| Small metropolitan | 31.1 | 500 | 32.2 | 510 |
| Micropolitan | 8.8 | 490 | 9.7 | 490 |
| Rural | 4.3 | 590 | 5.4 | 560 |
| Ownership | ||||
| Public | 17.7 | 530 | 16.4 | 550 |
| Private, nonprofit | 71.3 | 540 | 72.0 | 540 |
| Private, for-profit | 11.0 | 440 | 11.5 | 420 |
| Teaching status/location | ||||
| Metropolitan nonteaching | 22.1 | 500 | 24.2 | 500 |
| Metropolitan teaching | 64.9 | 530 | 60.7 | 540 |
| Nonmetropolitan | 13.1 | 520 | 15.1 | 510 |
| Trauma level designation | ||||
| Level I | 23.8 | 570 | 18.3 | 600 |
| Level II | 16.3 | 510 | 15.7 | 520 |
| Level III | 13.0 | 530 | 13.4 | 530 |
| Not a trauma center | 46.7 | 510 | 52.5 | 510 |
| Abbreviations: ED, emergency department; MSUD, mental and substance use disorder Notes: Statistics for ED visits with missing or invalid patient characteristics are not presented. In 2017, about 13% of all ED visits (weighted) in the NEDS are missing information about ED charges and therefore ED cost cannot be estimated. Estimates of the total cost use the product of the number of cases and the average estimated cost to account for records with missing information. The share of total costs is calculated with unrounded numbers. Total cost decompositions among different descriptive statistics or utilizing multiple levels of aggregation in a single computation could lead to slightly different total cost estimates due to the use of slightly different and more specific estimates of the missing information. Therefore, the share of total cost across characteristic values may not sum to 100. Average cost estimates are rounded to the nearest $10. Source: Agency for Healthcare Research and Quality (AHRQ), Healthcare Cost and Utilization Project (HCUP), Nationwide Emergency Department Sample (NEDS), 2017 | ||||
Healthcare Cost and Utilization Project (HCUP) Statistical Briefs provide basic descriptive statistics on a variety of topics using HCUP administrative healthcare data. Topics include hospital inpatient, ambulatory surgery, and emergency department use and costs, quality of care, access to care, medical conditions, procedures, and patient populations, among other topics. The reports are intended to generate hypotheses that can be further explored in other research; the reports are not designed to answer in-depth research questions using multivariate methods. Data Source The estimates in this Statistical Brief are based upon data from the HCUP 2017 Nationwide Emergency Department Sample (NEDS). Definitions Diagnoses, ICD-10-CM, and Clinical Classifications Software Refined (CCSR) for ICD-10-CM Diagnoses For emergency department (ED) visits that are treated and released, the first-listed diagnosis represents the condition, symptom, or problem identified in the medical record to be chiefly responsible for the ED services provided. In cases where the first-listed diagnosis is a symptom or problem, a diagnosis has not been established (confirmed) by the provider. For ED visits that result in an inpatient admission, the first-listed diagnosis is the principal diagnosis, the condition established after study to be chiefly responsible for the patient's admission to the hospital. Secondary diagnoses are conditions that coexist at the time of the ED visit or inpatient admission, that require or affect patient care treatment received or management, or that develop during the inpatient stay. All-listed diagnoses include the first-listed (principal) diagnosis plus the secondary conditions. ICD-10-CM is the International Classification of Diseases, Tenth Revision, Clinical Modification. In October 2015, ICD-10-CM replaced the International Classification of Diseases, Ninth Revision, Clinical Modification (ICD-9-CM) diagnosis coding system for most inpatient and outpatient medical encounters. There are over 70,000 ICD-10-CM diagnosis codes. The CCSR aggregates ICD-10-CM diagnosis codes into a manageable number of clinically meaningful categories.5 The CCSR is intended to be used analytically to examine patterns of healthcare in terms of cost, utilization and outcomes, rank utilization by diagnoses, and risk-adjust by clinical condition. The CCSR capitalizes on the specificity of the ICD-10-CM coding scheme and allows ICD-10-CM codes to be classified in more than one category. Approximately 10 percent of diagnosis codes are associated with more than one CCSR category because the diagnosis code documents either multiple conditions or a condition along with a common symptom or manifestation. ICD-10-CM coding definitions for each CCSR category presented in this Statistical Brief can be found in the CCSR Reference File, available at www.hcup-us.ahrq.gov/toolssoftware/ccsr/ccs_refined.jsp#download. For this Statistical Brief, ED visits were categorized using first- and second-listed diagnosis codes. The combination of first- and second-listed diagnosis codes was determined to be a more appropriate method to estimate emergency department (ED) resource use, as ED coding practices may not always use the first-listed diagnosis to capture conditions accountable for the majority of resource use. All-listed diagnoses may be more suitable if the focus of the analysis is ED visit utilization or disease prevalence. ED visits classified in the same diagnosis category were counted only once, but ED visits that were classified into more than one CCSR diagnosis category were counted separately in each diagnosis category. Therefore, the figures providing costs by diagnosis are not mutually exclusive. Costs for the diagnoses presented in the figures should not be added together. Case definition The mental and substance use disorder (MSUD) diagnoses used in this Statistical Brief were defined using diagnosis categories in the CCSR.6 ED visits for MSUD were identified by scanning the first- and second-listed diagnosis codes on the visit record, assigning CCSR categories to each, and then retaining those codes falling into the mental, behavioral, and neurodevelopmental disorders chapter (i.e., CCSR categories starting with "MBD"). One category in the chapter, MBD024: Tobacco-related disorders, was excluded from consideration. Types of hospitals included in the HCUP Nationwide Emergency Department Sample The Nationwide Emergency Department Sample (NEDS) is based on emergency department (ED) data from community acute care hospitals, which are defined as short-term, non-Federal, general, and other specialty hospitals available to the public. Included among community hospitals are pediatric institutions and hospitals that are part of academic medical centers. Excluded are long-term care facilities such as rehabilitation, psychiatric, and alcoholism and chemical dependency hospitals. Hospitals included in the NEDS have EDs, and no more than 90 percent of their ED visits result in admission. Unit of analysis The unit of analysis is the emergency department (ED) visit, not a person or patient. This means that a person who is seen in the ED multiple times in 1 year will be counted each time as a separate visit in the ED. Costs and charges Total ED charges were converted to costs using HCUP Cost-to-Charge Ratios based on hospital accounting reports from the Centers for Medicare & Medicaid Services (CMS).7 Costs reflect the actual expenses incurred in the production of hospital services, such as wages, supplies, and utility costs; charges represent the amount a hospital billed for the case. For each hospital, a cost-to-charge ratio constructed specifically for the hospital ED is used. Hospital charges reflect the amount the hospital billed for the entire ED visit and do not include professional (physician) fees. Total ED charges were not available on all NEDS records. For this Statistical Brief, aggregate costs were estimated as the product of weighted number of visits and average cost in each reporting category. How HCUP estimates of costs differ from National Health Expenditure Accounts There are a number of differences between the costs cited in this Statistical Brief and spending as measured in the National Health Expenditure Accounts (NHEA), which are produced annually by CMS.8 The largest source of difference comes from the HCUP coverage of ED treatment only in contrast to the NHEA inclusion of inpatient and other outpatient costs associated with other hospital-based outpatient clinics and departments as well. The outpatient portion of hospitals' activities has been growing steadily and may exceed half of all hospital revenue in recent years. On the basis of the American Hospital Association Annual Survey, 2017 outpatient gross revenues (or charges) were about 49 percent of total hospital gross revenues.9 Smaller sources of differences come from the inclusion in the NHEA of hospitals that are excluded from HCUP. These include Federal hospitals (Department of Defense, Veterans Administration, Indian Health Services, and Department of Justice [prison] hospitals) as well as psychiatric, substance abuse, and long-term care hospitals. A third source of difference lies in the HCUP reliance on billed charges from hospitals to payers, adjusted to provide estimates of costs using hospital-wide cost-to-charge ratios, in contrast to the NHEA measurement of spending or revenue. HCUP costs estimate the amount of money required to produce hospital services, including expenses for wages, salaries, and benefits paid to staff as well as utilities, maintenance, and other similar expenses required to run a hospital. NHEA spending or revenue measures the amount of income received by the hospital for treatment and other services provided, including payments by insurers, patients, or government programs. The difference between revenues and costs includes profit for for-profit hospitals or surpluses for nonprofit hospitals. Expected payer To make coding uniform across all HCUP data sources, the primary expected payer for the ED visit combines detailed categories into general groups:
For this Statistical Brief, when more than one payer is listed for an ED visit, the first-listed payer is used. Region Region is one of the four regions defined by the U.S. Census Bureau:
Discharge status reflects the disposition of the patient at discharge from the ED and includes the following seven categories: routine (to home); transfer to another short-term hospital; other transfers (including skilled nursing facility, intermediate care, and another type of facility such as a nursing home); home health care; against medical advice (AMA); admitted as an inpatient to the same hospital; or died in the hospital; or destination unknown. Hospital characteristics Data on hospital ownership and status as a teaching hospital was obtained from the American Hospital Association (AHA) Annual Survey of Hospitals. Hospital ownership/control includes categories for government nonfederal (public), private not-for-profit (voluntary), and private investor-owned (proprietary). Teaching hospital is defined as having a residency program approved by the American Medical Association, being a member of the Council of Teaching Hospitals, or having a ratio of full-time equivalent interns and residents to beds of 0.25 or higher. Hospital location is based on a simplified adaptation of the Urban Influence Codes (UIC) developed by the United States Department of Agriculture (USDA) Economic Research Service (ERS). Starting with 2014 data, the categorization is based on the 2013 version of the UIC. Prior to 2014, the categorization was based on the 2003 version of the UIC. The 12 categories of the UIC are combined into four broader categories that differentiate between large metropolitan (1 million residents or more), small metropolitan (fewer than 1 million residents), micropolitan, and non-urban residual (rural). Trauma designation for trauma centers treating adults and children was identified through the Trauma Information Exchange Program (TIEP) database, a national inventory of trauma centers in the United States.10 A trauma center is a hospital that is equipped to provide comprehensive emergency medical services 24 hours a day, 365 days per year to patients with traumatic injuries. In 1976, the American College of Surgeons Committee on Trauma (ACS/COT) defined five levels of trauma centers:11
About HCUP The Healthcare Cost and Utilization Project (HCUP, pronounced "H-Cup") is a family of healthcare databases and related software tools and products developed through a Federal-State-Industry partnership and sponsored by the Agency for Healthcare Research and Quality (AHRQ). HCUP databases bring together the data collection efforts of State data organizations, hospital associations, and private data organizations (HCUP Partners) and the Federal government to create a national information resource of encounter-level healthcare data. HCUP includes the largest collection of longitudinal hospital care data in the United States, with all-payer, encounter-level information beginning in 1988. These databases enable research on a broad range of health policy issues, including cost and quality of health services, medical practice patterns, access to healthcare programs, and outcomes of treatments at the national, State, and local market levels. HCUP would not be possible without the contributions of the following data collection Partners from across the United States: Alaska Department of Health and Social Services Alaska State Hospital and Nursing Home Association Arizona Department of Health Services Arkansas Department of Health California Office of Statewide Health Planning and Development Colorado Hospital Association Connecticut Hospital Association Delaware Division of Public Health District of Columbia Hospital Association Florida Agency for Health Care Administration Georgia Hospital Association Hawaii Laulima Data Alliance Hawaii University of Hawai'i at Hilo Illinois Department of Public Health Indiana Hospital Association Iowa Hospital Association Kansas Hospital Association Kentucky Cabinet for Health and Family Services Louisiana Department of Health Maine Health Data Organization Maryland Health Services Cost Review Commission Massachusetts Center for Health Information and Analysis Michigan Health & Hospital Association Minnesota Hospital Association Mississippi State Department of Health Missouri Hospital Industry Data Institute Montana Hospital Association Nebraska Hospital Association Nevada Department of Health and Human Services New Hampshire Department of Health & Human Services New Jersey Department of Health New Mexico Department of Health New York State Department of Health North Carolina Department of Health and Human Services North Dakota (data provided by the Minnesota Hospital Association) Ohio Hospital Association Oklahoma State Department of Health Oregon Association of Hospitals and Health Systems Oregon Office of Health Analytics Pennsylvania Health Care Cost Containment Council Rhode Island Department of Health South Carolina Revenue and Fiscal Affairs Office South Dakota Association of Healthcare Organizations Tennessee Hospital Association Texas Department of State Health Services Utah Department of Health Vermont Association of Hospitals and Health Systems Virginia Health Information Washington State Department of Health West Virginia Department of Health and Human Resources, West Virginia Health Care Authority Wisconsin Department of Health Services Wyoming Hospital Association About the NEDS The HCUP Nationwide Emergency Department Database Sample (NEDS) is a unique and powerful database that yields national estimates of emergency department (ED) visits. The NEDS was constructed using records from both the HCUP State Emergency Department Databases (SEDD) and the State Inpatient Databases (SID). The SEDD capture information on ED visits that do not result in an admission (i.e., patients who were treated in the ED and then released from the ED, or patients who were transferred to another hospital); the SID contain information on patients initially seen in the ED and then admitted to the same hospital. The NEDS was created to enable analyses of ED utilization patterns and support public health professionals, administrators, policymakers, and clinicians in their decision making regarding this critical source of care. The NEDS is produced annually beginning in 2006. Over time, the sampling frame for the NEDS has changed; thus, the number of States contributing to the NEDS varies from year to year. The NEDS is intended for national estimates only; no State-level estimates can be produced. The unweighted sample size for the 2017 NEDS is 33,506,645 visits (weighted, this represents 144,814,803 ED visits). For More Information For other information on emergency department visits, refer to the HCUP Statistical Briefs located at www.hcup-us.ahrq.gov/reports/statbriefs/sb_ed.jsp. For additional HCUP statistics, visit:
For a detailed description of HCUP and more information on the design of the Nationwide Emergency Department Sample (NEDS), please refer to the following database documentation: Agency for Healthcare Research and Quality. Overview of the Nationwide Emergency Department Sample (NEDS). Healthcare Cost and Utilization Project (HCUP). Rockville, MD: Agency for Healthcare Research and Quality. Updated December 2019. www.hcup-us.ahrq.gov/nedsoverview.jsp. Accessed February 3, 2020. Suggested Citation Karaca Z (AHRQ), Moore BJ (IBM Watson Health). Costs of Emergency Department Visits for Mental and Substance Use Disorders in the United States, 2017. HCUP Statistical Brief #257. May 2020. Agency for Healthcare Research and Quality, Rockville, MD. www.hcup-us.ahrq.gov/reports/statbriefs/sb257-ED-Costs-Mental-Substance-Use-Disorders-2017.pdf. Acknowledgments The authors would like to acknowledge the contributions of Gary Pickens and Cory Pack of IBM Watson Health. *** AHRQ welcomes questions and comments from readers of this publication who are interested in obtaining more information about access, cost, use, financing, and quality of healthcare in the United States. We also invite you to tell us how you are using this Statistical Brief and other HCUP data and tools, and to share suggestions on how HCUP products might be enhanced to further meet your needs. Please e-mail us at hcup@ahrq.gov or send a letter to the address below:Joel W. Cohen, Ph.D., Director Center for Financing, Access and Cost Trends Agency for Healthcare Research and Quality 5600 Fishers Lane Rockville, MD 20857 This Statistical Brief was posted online on May 12, 2020. The revised version of this Statistical Brief was posted online on October 12, 2020. * The authors have revised this Statistical Brief to use the first- and second-listed diagnosis codes instead of all-listed diagnoses for the purpose of estimating the costs per visit. The combination of first- and second-listed diagnosis codes appears to be plausible for estimating emergency department (ED) resource use, as ED coding practices may not always use the first-listed diagnosis to capture conditions accountable for the majority of resource use. All-listed diagnoses may be more suitable if the focus of the analysis is ED visit utilization or disease prevalence. 1 Dieleman JL, Squires E, Bui AL, Campbell M, Chapin A, Hamavid H, et al. Factors associated with increases in US health care spending, 1996-2013. JAMA. 2017;318(17):1668-78. 2 Moore BJ, Stocks C, Owens PL. Trends in Emergency Department Visits, 2006-2014. HCUP Statistical Brief #227. September 2017. Agency for Healthcare Research and Quality, Rockville, MD. www.hcup-us.ahrq.gov/reports/statbriefs/sb227-Emergency-Department-Visit-Trends.pdf. Accessed March 18, 2020. 3 Galarraga JE, Pines JM. Costs of ED episodes of care in the United States. The American Journal of Emergency Medicine. 2016;34(3):357-65. 4 The sum of MSUD ED visit costs and percentages of total MSUD ED visit costs across diagnoses will not match costs for ED visits with at least one of the top five MSUD diagnoses because some ED visits are counted in more than one diagnosis category. A separate analysis was run to deduplicate these results when reporting the combined total for the top five most costly MSUD diagnoses in the ED. In addition, total cost for the five most costly MSUD ED visit diagnoses was calculated from values that were not rounded. 5 Agency for Healthcare Research and Quality. HCUP Clinical Classifications Software Refined (CCSR) for ICD-10-CM Diagnoses. Healthcare Cost and Utilization Project (HCUP). Agency for Healthcare Research and Quality. Updated January 2020. www.hcup-us.ahrq.gov/toolssoftware/ccsr/ccs_refined.jsp. Accessed February 27, 2020. 6 Ibid. 7 The HCUP Cost-to-Charge Ratios (CCRs) for Emergency Department Files were not publicly available at the time of publication, so an internal version was used in this Statistical Brief. 8 For additional information about the NHEA, see Centers for Medicare & Medicaid Services (CMS). National Health Expenditure Data. CMS website. Updated December 17, 2019. www.cms.gov/Research-Statistics-Data-and-Systems/Statistics-Trends-and-Reports/NationalHealthExpendData/index.html?redirect=/NationalHealthExpendData/. Accessed February 3, 2020. 9 American Hospital Association. TrendWatch Chartbook, 2019. Table 4.2. Distribution of Inpatient vs. Outpatient Revenues, 1995-2017. www.aha.org/system/files/media/file/2019/11/TrendwatchChartbook-2019-Appendices.pdf. 10American Trauma Society. Trauma Information Exchange Program (TIEP). www.amtrauma.org/page/TIEP. 11 MacKenzie EJ, Hoyt DB, Sacra JC, et al. National inventory of hospital trauma centers. JAMA. 2003;289:1515-1522. 12 American College of Surgeons Committee on Trauma, Verification, Review, and Consultation Program for Hospitals. Additional details are available at www.facs.org/quality-programs/trauma/vrc. |
| Supplemental Table 1. Total and average ED visit costs for the most costly MSUD diagnoses, 2017, for data presented in Figure 1 | ||
| Disorder | Total costs, $ millions | Average cost per visit, $ |
|---|---|---|
| Top 5 most costly MSUD diagnoses | 3,909 | 530 |
| Alcohol-related | 1,220 | 610 |
| Anxiety and fear-related | 962 | 470 |
| Depressive | 750 | 500 |
| Suicidal ideation/attempt/intentional self-harm | 612 | 570 |
| Schizophrenia spectrum and other psychotic | 364 | 470 |
| Opioid-related | 328 | 500 |
| Bipolar and related | 250 | 470 |
| Stimulant-related | 238 | 570 |
| Neurodevelopmental | 195 | 430 |
| Trauma- and stressor-related | 181 | 470 |
| Other specified substance-related | 175 | 530 |
| Cannabis-related | 165 | 560 |
| Disruptive, impulse-control and conduct | 60 | 440 |
| Sedative-related | 53 | 570 |
| Other specified and unspecified mood | 44 | 400 |
| Miscellaneous mental and behavioral | 38 | 440 |
| Personality | 24 | 450 |
| Mental and substance use disorders in remission | 18 | 560 |
| Somatic | 16 | 470 |
| Hallucinogen-related | 12 | 580 |
| Abbreviations: ED, emergency department; MSUD, mental and/or substance use disorder | ||
| Supplemental Table 2. Distribution of total ED visit costs for the five most costly MSUD diagnoses, by age group, 2017, for data presented in Figure 2 | ||||
| Type of disorder | Share of ED visit costs, % | |||
|---|---|---|---|---|
| 0-17 years | 18-44 years | 45-64 years | 65+ years | |
| Top 5 most costly MSUD diagnoses ($3,909 million) | 8.1 | 49.0 | 33.6 | 9.3 |
| Alcohol-related ($1,220 million) | 1.4 | 44.2 | 46.3 | 8.1 |
| Anxiety and fear-related ($962 million) | 6.5 | 50.7 | 29.0 | 13.9 |
| Depressive ($750 million) | 14.8 | 47.3 | 27.7 | 10.2 |
| Suicidal ideation/attempt/intentional self-harm ($612 million) | 19.8 | 53.0 | 23.5 | 3.7 |
| Schizophrenia spectrum and other psychotic ($364 million) | 1.9 | 56.6 | 32.8 | 8.7 |
| Abbreviations: ED, emergency department; MSUD, mental and/or substance use disorder | ||||
| Supplemental Table 3. Distribution of total ED visit costs for the five most costly MSUD diagnoses, by primary expected payer, 2017, for data presented in Figure 3 | |||||
| Type of disorder | Share of ED visit costs, % | ||||
|---|---|---|---|---|---|
| Medicare | Medicaid | Private insurance | Self-pay/no chargea | Other | |
| Top 5 most costly MSUD diagnoses ($3,909 million) | 18.7 | 33.3 | 27.7 | 16.8 | 3.5 |
| Alcohol-related ($1,220 million) | 14.9 | 34.7 | 23.3 | 23.2 | 3.9 |
| Anxiety and fear-related ($962 million) | 21.4 | 27.4 | 35.2 | 12.8 | 3.2 |
| Depressive ($750 million) | 18.7 | 33.4 | 32.1 | 12.4 | 3.3 |
| Suicidal ideation/attempt/intentional self-harm ($612 million) | 13.9 | 38.0 | 28.0 | 16.2 | 4.0 |
| Schizophrenia spectrum and other psychotic ($364 million) | 31.8 | 36.3 | 12.8 | 16.4 | 2.7 |
| Abbreviations: ED, emergency department; MSUD, mental and/or substance use disorder a Self-pay/No charge: includes self-pay, no charge, charity, and no expected payment. | |||||