STATISTICAL BRIEF #253 |
October 2019
Kathryn R. Fingar, Ph.D., M.P.H., Lan Liang, Ph.D., and Carol Stocks, Ph.D., R.N. Introduction Influenza, also known as the flu, is a contagious respiratory viral infection that may cause mild to severe symptoms and at times lead to death. The flu season generally peaks between December and February, but the timing and severity of the flu and its distribution across regions and populations may vary from year to year.1 Nevertheless, each year influenza contributes to tens of thousands of inpatient stays and emergency department (ED) visits in the United States,2,3 some of which may be prevented through better access to primary care and vaccination.4 The Centers for Disease Control and Prevention (CDC) recommend that everyone 6 months of age or older receive a yearly flu vaccine, which ideally should be administered by the end of October, before most flu seasons start.5 Between the 2010-2011 and 2016-2017 flu seasons, vaccination rates increased from 51.0 to 59.0 percent among children aged 6 months to 17 years and from 40.5 to 43.3 percent among adults aged 18 years and older.6 Despite these increases, disparities in vaccination rates persist for certain populations. In 2015, the percentage of individuals who received the flu vaccine in the past year was lower for younger adults aged 18-44 years (30.9 percent) than for those aged 45-64 years (45.1 percent) and 65 years and older (69.1 percent); was lower for males than for females (39.2 vs. 46.8 percent, respectively); was lower for Hispanics and Blacks than for Whites (31.2 and 36.0 vs. 46.9 percent, respectively); and was lower for individuals in poverty than for those with incomes at 400 percent of the federal poverty level or higher (33.6 vs. 50.4 percent respectively).7 Vaccination rates were highest in the Northeast (46.6 percent) and lowest in the West (41.8 percent).8 Vaccination is particularly important for populations who are at greater risk of influenza and flu-related complications.9 These populations include adults aged 65 years and older, children younger than 5 years of age, pregnant women, and individuals with chronic conditions, such as asthma and other lung conditions, diabetes, cancer, human immunodeficiency virus/acquired immunodeficiency syndrome (HIV/AIDS), obesity, sickle cell disease,10 and potentially opioid-related disorders.11 This HCUP Statistical Brief presents statistics on inpatient stays and treat-and-release ED visits (i.e., those that do not result in admission to the same hospital) with an influenza diagnosis from the 2006-2007 flu season through the 2015-2016 flu season using the 2006-2016 National (Nationwide) Inpatient Sample (NIS) and Nationwide Emergency Department Sample (NEDS). Flu seasons were defined as the 12-month period from August through July of the next year, except for 2015-2016. The 2015-2016 flu season was defined as the 12-month period from October 2015 through September 2016 because of the transition of the International Classification of Diseases coding system from the ninth to the tenth revision in October 2015. Because the 2015-2016 flu season started later than most years,12 this definition captured most cases. |
|
First, trends in the number of inpatient stays and treat-and-release ED visits are presented over time. Second, characteristics of inpatient stays and ED visits involving influenza are presented for four high-volume flu seasons: 2009-2010, during which the H1N1 or "swine flu" virus predominated infections13; 2012-2013; 2014-2015; and 2015-2016. Finally, inpatient costs, length of stay, and in-hospital mortality are shown for the most recent flu season for which data were available (2015-2016), overall and by patient characteristics, including select co-occurring conditions that place individuals at greater risk for flu-related complications. All differences between estimates noted in the text are 10 percent or greater.
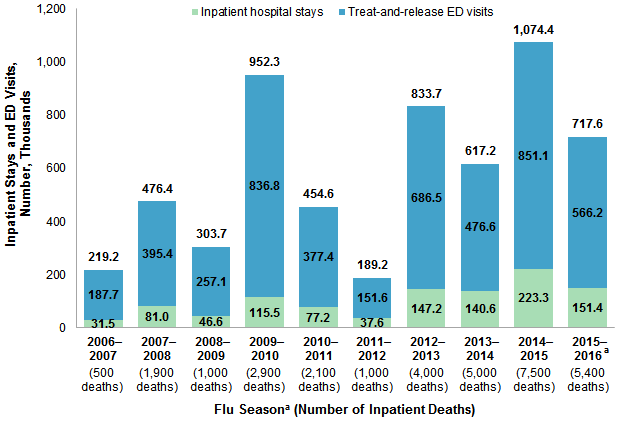
Findings Trends in inpatient stays and ED visits involving influenza, 2006-2016 Figure 1 displays the number, in thousands, of inpatient stays, treat-and-release ED visits, and stays and visits combined, with any-listed diagnosis of influenza from 10 flu seasons between 2006 and 2016. |
|
Figure 1. Number (in thousands) of influenza-related inpatient stays and treat-and-release ED visits from 10 flu seasons, a 2006-2016
Abbreviation: ED, emergency department Bar chart that shows the number (in thousands) of inpatient stays and treat-and-release emergency department visits related to influenza during 10 flu seasons from 2006 to 2016. Data are provided in Supplemental Table 1.
|
|
|
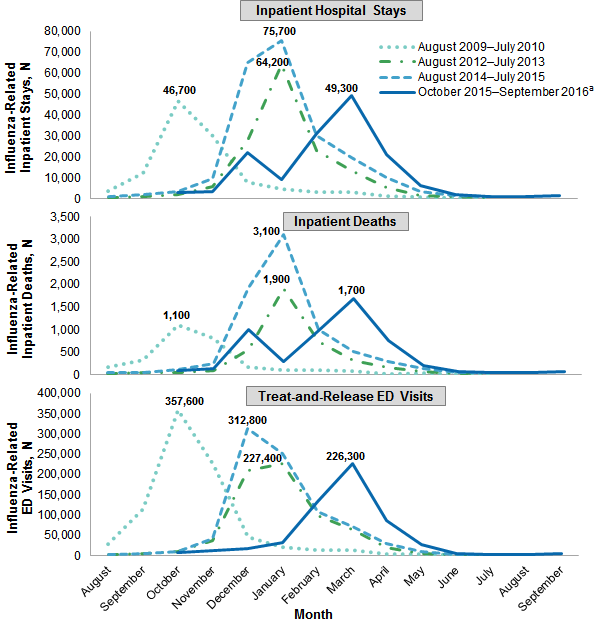
Figure 2. Number of inpatient stays, inpatient deaths, and treat-and-release ED visits from four high-volume flu seasons, a by month of admission, 2009-2016
Abbreviation: ED, emergency department; N, number Three line graphs that show for four high-volume flu seasons by month of admission the number of influenza-related inpatient stays, the number of influenza-related inpatient deaths, and the number of influenza-related treat-and-release emergency department visits. Asterisks indicate the month with the highest number of influenza cases for that influenza season. Data are provided in Supplemental Table 2.
|
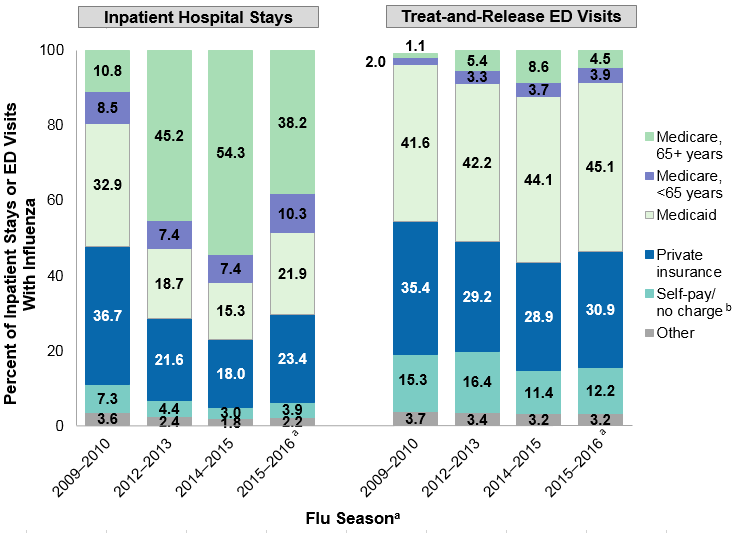
Figure 3 displays the percentage of inpatient stays and treat-and-release ED visits involving influenza by expected payer during four high-volume flu seasons between 2009 and 2016. |
|
Figure 3. Percentage of influenza-related inpatient stays and treat-and-release ED visits for four high-volume flu seasons,a by expected payer, 2009-2016
Abbreviation: ED, emergency department Two bar charts that show for four high-volume influenza seasons the percentage of influenza-related inpatient stays and treat-and-release emergency department visits for 2009 to 2016 by expected payer. Data are provided in Supplemental Table 3.
|
|
| Table 1. Rates of influenza-related inpatient stays and treat-and-release ED visits for four high-volume flu seasons,a by patient characteristics, 2009-2016 | ||||||||
| Patient characteristic | Rate of influenza-related stays per 100,000 population | Rate of influenza-related treat-and-release ED visits per 100,000 population | ||||||
|---|---|---|---|---|---|---|---|---|
| 2009-2010 | 2012-2013 | 2014-2015 | 2015-2016 | 2009-2010 | 2012-2013 | 2014-2015 | 2015-2016 | |
| Total | 37.5 | 46.9 | 70.1 | 47.1 | 271.7 | 218.6 | 267.2 | 176.0 |
| Age, years | ||||||||
| 0-4 | 111.3 | 83.8 | 76.6 | 67.3 | 779.8 | 710.8 | 877.4 | 593.3 |
| 5-17 | 33.2 | 17.7 | 16.9 | 14.1 | 536.7 | 316.6 | 393.3 | 244.4 |
| 18-49 | 27.5 | 16.0 | 20.8 | 21.3 | 243.1 | 192.9 | 220.5 | 166.3 |
| 50-64 | 38.1 | 41.8 | 59.5 | 58.6 | 72.7 | 97.2 | 126.8 | 92.4 |
| 65-84 | 36.4 | 132.4 | 213.9 | 114.6 | 30.6 | 96.7 | 169.4 | 64.0 |
| 85+ | 37.6 | 426.6 | 785.1 | 260.1 | 16.0 | 125.4 | 269.5 | 56.2 |
| Sex | ||||||||
| Male | 34.9 | 43.5 | 63.8 | 45.1 | 252.6 | 203.3 | 243.8 | 165.7 |
| Female | 39.7 | 50.1 | 76.2 | 48.9 | 289.1 | 233.4 | 289.8 | 186.0 |
| Community income | ||||||||
| Quartile 1 (lowest) | 48.5 | 56.4 | 80.7 | 58.3 | 377.0 | 326.8 | 406.9 | 258.9 |
| Quartile 2 | 37.6 | 47.8 | 71.5 | 48.1 | 309.1 | 241.7 | 290.1 | 191.9 |
| Quartile 3 | 32.1 | 41.9 | 66.0 | 42.5 | 231.4 | 172.5 | 216.3 | 138.6 |
| Quartile 4 (highest) | 27.4 | 37.8 | 57.3 | 35.9 | 147.6 | 120.1 | 137.8 | 103.8 |
| Patient location | ||||||||
| Metro area | 35.4 | 44.4 | 67.8 | 46.6 | 242.3 | 185.2 | 230.8 | 164.7 |
| Rural, adjacent to metro area | 44.5 | 57.8 | 79.2 | 48.8 | 418.1 | 396.2 | 490.9 | 230.7 |
| Rural, remote area | 53.2 | 61.3 | 89.0 | 47.7 | 405.4 | 367.5 | 453.9 | 259.1 |
| Region of patient's residence | ||||||||
| Northeast | 32.3 | 56.6 | 78.8 | 53.2 | 224.0 | 177.0 | 163.4 | 157.5 |
| Midwest | 39.9 | 53.9 | 87.5 | 51.9 | 358.2 | 260.8 | 339.7 | 170.4 |
| South | 35.1 | 46.3 | 69.6 | 44.5 | 255.2 | 261.5 | 339.3 | 195.7 |
| West | 42.6 | 33.6 | 48.1 | 41.7 | 249.0 | 140.7 | 162.6 | 161.6 |
| Abbreviation: ED, emergency department Note: Numbers are based on all-listed diagnoses of influenza. a Flu seasons were defined from August through July of the next year, except for 2015-2016, which was defined from October 2015 through September 2016 because of the transition of the International Classification of Diseases coding system from the ninth to the tenth revision in October 2015. Source: Agency for Healthcare Research and Quality (AHRQ), Healthcare Cost and Utilization Project (HCUP), National (Nationwide) Inpatient Sample (NIS) and Nationwide Emergency Department Sample (NEDS), 2009-2016 | ||||||||
|
|
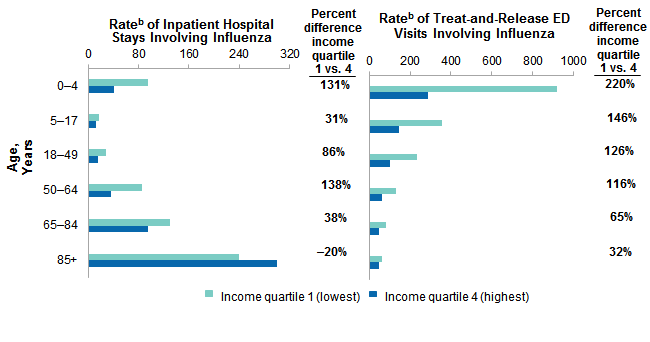
Figure 4. Differences in rates of inpatient stays and treat-and-release ED visits involving influenza, by community income and age, 2015-2016 flu seasona
Abbreviation: ED, emergency department Two bar charts that show for the 2015-2016 influenza season the rate of influenza-related inpatient stays and treat-and-release emergency department visits by community income and age and the percent difference between the first and fourth income quartile. Data are provided in Supplemental Table 4.
|
Table 2 presents the mean cost and length, admission source, and in-hospital mortality rate of influenza-related inpatient stays during the 2015-2016 flu season. |
| Table 2. Utilization characteristics of influenza-related inpatient hospital stays by patient characteristics, 2015-2016 flu seasona | |||||
| Patient characteristic | Influenza-related inpatient hospital stays | ||||
|---|---|---|---|---|---|
| Inpatient Stays, N | Mean cost per stay, $ | Mean length of stay, days | Admitted from the ED, % | In-hospital death, % | |
| Total | 151,400 | 16,000 | 6.3 | 78.4 | 3.6 |
| Age, years | |||||
| 0-4 | 13,500 | 12,500 | 4.7 | 63.0 | 0.3 |
| 5-17 | 7,600 | 17,500 | 4.8 | 63.1 | 1.1 |
| 18-49 | 29,000 | 18,100 | 6.2 | 77.1 | 2.5 |
| 50-64 | 39,600 | 18,500 | 6.8 | 81.1 | 3.9 |
| 65-84 | 48,100 | 14,900 | 6.6 | 82.1 | 4.3 |
| 85+ | 16,100 | 12,300 | 6.5 | 83.8 | 6.3 |
| Sex | |||||
| Male | 71,400 | 17,300 | 6.4 | 78.6 | 3.9 |
| Female | 79,900 | 14,900 | 6.2 | 78.3 | 3.2 |
| Community income | |||||
| Quartile 1 (lowest) | 48,000 | 15,100 | 6.3 | 77.2 | 3.6 |
| Quartile 2 | 37,100 | 15,000 | 6.2 | 76.6 | 3.4 |
| Quartile 3 | 34,800 | 17,000 | 6.3 | 79.5 | 3.5 |
| Quartile 4 (highest) | 28,800 | 17,800 | 6.4 | 81.6 | 3.6 |
| Expected payerb | |||||
| Medicare, 65+ years | 57,800 | 14,100 | 6.5 | 82.6 | 4.8 |
| Medicare, <65 years | 15,500 | 17,500 | 7.0 | 79.8 | 3.5 |
| Medicaid | 33,100 | 17,200 | 6.1 | 73.2 | 2.4 |
| Private insurance | 35,500 | 17,600 | 5.9 | 74.9 | 2.8 |
| Self-pay/no charge | 5,900 | 14,000 | 5.6 | 87.6 | 2.7 |
| Other | 3,400 | 18,400 | 6.5 | 74.1 | 4.0 |
| Patient location | |||||
| Metro area | 128,500 | 16,300 | 6.3 | 81.1 | 3.5 |
| Rural, adjacent to metro area | 14,800 | 14,300 | 6.1 | 66.2 | 4.3 |
| Rural, remote area | 7,600 | 15,000 | 5.9 | 56.8 | 3.6 |
| Region of patient's residence | |||||
| Northeast | 30,000 | 16,600 | 6.5 | 86.7 | 3.8 |
| Midwest | 35,300 | 15,500 | 6.3 | 63.4 | 3.0 |
| South | 53,900 | 14,000 | 6.4 | 84.1 | 3.5 |
| West | 31,700 | 19,400 | 5.8 | 77.7 | 4.0 |
| Abbreviations: ED, emergency department Notes: Numbers are based on all-listed diagnoses of influenza. Numbers of stays and costs are rounded to the nearest hundred. a The 2015-2016 flu season was defined from October 2015 through September 2016 because of the transition of the International Classification of Diseases coding system from the ninth to the tenth revision in October of 2015. b Self-pay/no charge includes self-pay, no charge, charity, and no expected payment. Source: Agency for Healthcare Research and Quality (AHRQ), Healthcare Cost and Utilization Project (HCUP), National Inpatient Sample (NIS), 2015-2016 | |||||
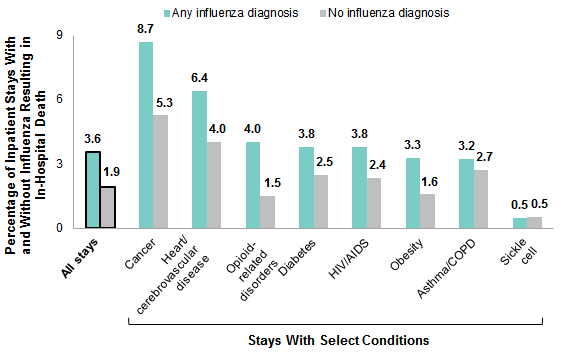
Figure 5 displays in-hospital mortality rates among inpatient stays involving influenza during the 2015-2016 flu season (most recent available data). For comparison, the in-hospital mortality rate for stays without influenza also is shown. The rate is shown for stays overall and for stays with select conditions that may place individuals at a higher risk of flu-related complications.16,17 |
|
Figure 5. Inpatient deaths among stays with and without influenza, overall and among stays with select conditions, 2015-2016 flu seasona
Abbreviations: COPD, chronic obstructive pulmonary disease; HIV/AIDS, human immunodeficiency virus/acquired immunodeficiency syndrome Bar chart that shows the percentage of inpatient deaths influenza-related inpatient stays during the 2015-2016 influenza season, overall and among stays with select conditions. Data are provided in Supplemental Table 5.
|
About Statistical Briefs Healthcare Cost and Utilization Project (HCUP) Statistical Briefs provide basic descriptive statistics on a variety of topics using HCUP administrative health care data. Topics include hospital inpatient, ambulatory surgery, and emergency department use and costs, quality of care, access to care, medical conditions, procedures, and patient populations, among other topics. The reports are intended to generate hypotheses that can be further explored in other research; the reports are not designed to answer in-depth research questions using multivariate methods. Data Source The estimates in this Statistical Brief are based upon data from the HCUP 2006-2016 National (Nationwide) Inpatient Sample (NIS) and Nationwide Emergency Department Sample (NEDS). Supplemental sources included population denominator data for use with HCUP databases, derived from information available from Claritas, a vendor that produces population estimates and projections based on data from the U.S. Census Bureau.18 Definitions Diagnoses, ICD-9-CM, ICD-10-CM/PCS, and Clinical Classifications Software (CCS) The principal diagnosis is that condition established after study to be chiefly responsible for the patient's admission to the hospital. Secondary diagnoses are concomitant conditions that coexist at the time of admission or develop during the stay. All-listed diagnoses include the principal diagnosis plus these additional secondary conditions. ICD-9-CM is the International Classification of Diseases, Ninth Revision, Clinical Modification, which assigns numeric codes to diagnoses. There are approximately 14,000 ICD-9-CM diagnosis codes. ICD-10-CM the International Classification of Diseases, Tenth Revision, Clinical Modification. In October 2015, ICD-10-CM replaced the ICD-9-CM diagnosis coding system with the ICD-10-CM diagnosis coding system for most inpatient and outpatient medical encounters. There are over 70,000 ICD-10-CM diagnosis codes. CCS categorizes ICD-10-CM diagnosis codes into a manageable number of clinically meaningful categories.19,20 This clinical grouper makes it easier to quickly understand patterns of diagnoses. Case definition The ICD-9-CM and ICD-10-CM codes defining influenza include diagnosis codes in Table 3. |
| Table 3. Diagnosis codes defining influenza | |
| ICD-9-CM code | Description |
|---|---|
| 487.0 | Influenza with pneumonia |
| 487.1 | Influenza with other respiratory manifestations |
| 487.8 | Influenza with other manifestations |
| 488.01 | Influenza due to identified avian flu virus with pneumonia |
| 488.02 | Influenza due to identified avian flu virus with other respiratory manifestations |
| 488.09 | Influenza due to identified avian flu virus with other manifestations |
| 488.11 | Influenza due to identified 2009 H1N1 influenza virus with pneumonia |
| 488.12 | Influenza due to identified 2009 H1N1 influenza virus with other respiratory manifestations |
| 488.19 | Influenza due to identified 2009 H1N1 influenza virus with other manifestations |
| 488.81 | Influenza due to identified novel influenza A virus with pneumonia |
| 488.82 | Influenza due to identified novel influenza A virus with other respiratory manifestations |
| 488.89 | Influenza due to identified novel influenza A virus with other manifestations |
| ICD-10-CM code | Description |
| J09.X1 | Influenza due to identified novel influenza A virus with other manifestations |
| J09.X2 | Influenza due to identified novel influenza A virus with other respiratory manifestations |
| J09.X3 | Influenza due to identified novel influenza A virus with gastrointestinal manifestations |
| J09.X9 | Influenza due to identified novel influenza A virus with other manifestations |
| J10.00 | Influenza due to other identified influenza virus with unspecified type of pneumonia |
| J10.01 | Influenza due to other identified influenza virus with the same other identified influenza virus pneumonia |
| J10.08 | Influenza due to other identified influenza virus with other specified pneumonia |
| J10.1 | Influenza due to other identified influenza virus with other respiratory manifestations |
| J10.2 | Influenza due to other identified influenza virus with gastrointestinal manifestations |
| J10.81 | Influenza due to other identified influenza virus with encephalopathy |
| J10.82 | Influenza due to other identified influenza virus with myocarditis |
| J10.83 | Influenza due to other identified influenza virus with otitis media |
| J10.89 | Influenza due to other identified influenza virus with other manifestations |
| J11.00 | Influenza due to unidentified influenza virus with unspecified type of pneumonia |
| J11.08 | Influenza due to unidentified influenza virus with specified pneumonia |
| J11.1 | Influenza due to unidentified influenza virus with other respiratory manifestations |
| J11.2 | Influenza due to unidentified influenza virus with gastrointestinal manifestations |
| J11.81 | Influenza due to unidentified influenza virus with encephalopathy |
| J11.82 | Influenza due to unidentified influenza virus with myocarditis |
| J11.83 | Influenza due to unidentified influenza virus with otitis media |
| J11.89 | Influenza due to unidentified influenza virus with other manifestations |
| Abbreviations: ICD-9-CM, International Classification of Diseases, Ninth Revision, Clinical Modification; ICD-10-CM, International Classification of Diseases, Tenth Revision, Clinical Modification | |
The CCS and ICD-10-CM codes defining co-occurring conditions are provided in Table 4.
|
| Table 4. CCS codes defining co-occurring conditions | |
| CCS code | Description |
|---|---|
| Asthma/chronic obstructive pulmonary disease | |
| RSP008 | Chronic obstructive pulmonary disease and bronchiectasis |
| RSP009 | Asthma |
| Cancer | |
| NEO002 | Head and neck cancers - lip and oral cavity |
| NEO004 | Head and neck cancers - salivary gland |
| NEO009 | Head and neck cancers - tonsils |
| NEO003 | Head and neck cancers - throat |
| NEO005 | Head and neck cancers - nasopharyngeal |
| NEO006 | Head and neck cancers - hypopharyngeal |
| NEO007 | Head and neck cancers - pharyngeal |
| NEO010 | Head and neck cancers - all other types |
| NEO012 | Head and neck cancers - esophagus |
| NEO013 | Head and neck cancers - stomach |
| NEO014 | Head and neck cancers - small intestine |
| NEO015 | Head and neck cancers - colorectal |
| NEO016 | Head and neck cancers - anus |
| NEO017 | Head and neck cancers - liver |
| NEO018 | Head and neck cancers - bile duct |
| NEO019 | Head and neck cancers - gallbladder |
| NEO021 | Head and neck cancers - all other types |
| NEO051 | Endocrine system cancers - pancreas |
| NEO008 | Head and neck cancers - laryngeal |
| NEO022 | Respiratory cancers |
| NEO052 | Endocrine system cancers - thymus |
| NEO011 | Cardiac cancers |
| NEO023 | Bone cancer |
| NEO025 | Skin cancers - melanoma |
| NEO028 | Skin cancers - all other types |
| NEO026 | Skin cancers - basal cell carcinoma |
| NEO027 | Skin cancers - squamous cell carcinoma |
| NEO067 | Mesothelioma |
| NEO024 | Sarcoma |
| NEO049 | Nervous system cancers - all other types |
| NEO020 | Gastrointestinal cancers - peritoneum |
| NEO030 | Breast cancer - all other types |
| NEO038 | Female reproductive system cancers - all other types |
| NEO036 | Female reproductive system cancers - vulva |
| NEO037 | Female reproductive system cancers - vagina |
| NEO032 | Female reproductive system cancers - cervix |
| NEO031 | Female reproductive system cancers - uterus |
| NEO035 | Female reproductive system cancers - endometrium |
| NEO033 | Female reproductive system cancers - ovary |
| NEO034 | Female reproductive system cancers - fallopian tube |
| NEO041 | Male reproductive system cancers - penis |
| NEO039 | Male reproductive system cancers - prostate |
| NEO040 | Male reproductive system cancers - testis |
| NEO042 | Male reproductive system cancers - all other types |
| NEO045 | Urinary system cancers - kidney |
| NEO044 | Urinary system cancers - ureter and renal pelvis |
| NEO043 | Urinary system cancers - bladder |
| NEO046 | Urinary system cancers - urethra |
| NEO047 | Urinary system cancers - all other types |
| NEO001 | Head and neck cancers - eye |
| NEO048 | Nervous system cancers - brain |
| NEO050 | Endocrine system cancers - thyroid |
| NEO053 | Endocrine system cancers - adrenocortical |
| NEO056 | Endocrine system cancers - all other types |
| NEO054 | Endocrine system cancers - parathyroid |
| NEO055 | Endocrine system cancers - pituitary gland |
| NEO069 | Cancer of other sites |
| NEO070 | Secondary malignancies |
| NEO066 | Malignant neuroendocrine tumors |
| NEO071 | Malignant neoplasm, unspecified |
| NEO057 | Hodgkin lymphoma |
| NEO058 | Non-Hodgkin lymphoma |
| NEO065 | Multiple myeloma |
| NEO059 | Leukemia - acute lymphoblastic leukemia (ALL) |
| NEO061 | Leukemia - chronic lymphocytic leukemia (CLL) |
| NEO064 | Leukemia - all other types |
| NEO063 | Leukemia - hairy cell |
| NEO060 | Leukemia - acute myeloid leukemia (AML) |
| NEO062 | Leukemia - chronic myeloid leukemia (CML) |
| NEO029 | Breast cancer - ductal carcinoma in situ (DCIS) |
| NEO072 | Neoplasms of unspecified nature or uncertain behavior |
| NEO068 | Myelodysplastic syndrome (MDS) |
| NEO074 | Conditions due to neoplasm or the treatment of neoplasm |
| FAC006 | Encounter for antineoplastic therapies |
| Diabetes | |
| END003 | Diabetes mellitus with complication |
| END002 | Diabetes mellitus without complication |
| END006 | Diabetes mellitus, due to underlying condition, drug or chemical induced, or other specified type |
| END004 | Diabetes mellitus, Type 1 |
| END005 | Diabetes mellitus, Type 2 |
| Heart/cerebrovascular disease | |
| CIR004 | Endocarditis and endocardial disease |
| CIR005 | Myocarditis and cardiomyopathy |
| CIR006 | Pericarditis and pericardial disease |
| CIR032 | Other specified and unspecified circulatory disease |
| CIR029 | Aortic; peripheral; and visceral artery aneurysms |
| CIR024 | Other and ill-defined cerebrovascular disease |
| CIR037 | Vasculitis |
| CIR020 | Cerebral infarction |
| NVS012 | Transient cerebral ischemia |
| CIR002 | Acute rheumatic heart disease |
| CIR001 | Chronic rheumatic heart disease |
| CIR019 | Heart failure |
| CIR011 | Coronary atherosclerosis and other heart disease |
| CIR009 | Acute myocardial infarction |
| CIR010 | Complications of acute myocardial infarction |
| CIR015 | Other and ill-defined heart disease |
| CIR027 | Arterial dissections |
| CIR013 | Acute pulmonary embolism |
| CIR014 | Pulmonary heart disease |
| CIR003 | Nonrheumatic and unspecified valve disorders |
| CIR016 | Conduction disorders |
| CIR018 | Cardiac arrest and ventricular fibrillation |
| CIR017 | Cardiac dysrhythmias |
| CIR021 | Acute hemorrhagic cerebrovascular disease |
| CIR023 | Occlusion or stenosis of precerebral or cerebral arteries without infarction |
| CIR022 | Sequela of hemorrhagic cerebrovascular disease |
| CIR025 | Sequela of cerebral infarction and other cerebrovascular disease |
| CIR026 | Peripheral and visceral vascular disease |
| CIR030 | Aortic and peripheral arterial embolism or thrombosis |
| CIR033 | Acute phlebitis; thrombophlebitis and thromboembolism |
| CIR034 | Chronic phlebitis; thrombophlebitis and thromboembolism |
| CIR036 | Postthrombotic syndrome and venous insufficiency/hypertension |
| Human immunodeficiency virus (HIV) | |
| INF006 | HIV infection |
| Obesity | |
| END009 | Obesity |
| Opioid-related disorders | |
| MBD018 | Opioid-related disorders |
| MBD028 | Opioid-related disorders; subsequent encounter |
| ICD-10-CM code | Description |
| Sickle cell disease | |
| D57.00 | Hb-SS disease with crisis, unspecified |
| D57.01 | Hb-SS disease with acute chest syndrome |
| D57.02 | Hb-SS disease with splenic sequestration |
| D57.1 | Sickle-cell disease without crisis |
| D57.20 | Sickle-cell/Hb-C disease without crisis |
| D57.211 | Sickle-cell/Hb-C disease with acute chest syndrome |
| D57.212 | Sickle-cell/Hb-C disease with splenic sequestration |
| D57.219 | Sickle-cell/Hb-C disease with crisis, unspecified |
| D57.40 | Sickle-cell thalassemia without crisis |
| D57.411 | Sickle-cell thalassemia with acute chest syndrome |
| D57.412 | Sickle-cell thalassemia with splenic sequestration |
| D57.419 | Sickle-cell thalassemia with crisis, unspecified |
| D57.80 | Other sickle-cell without crisis |
| D57.811 | Other sickle-cell disorders with acute chest syndrome |
| D57.812 | Other sickle-cell disorders with splenic sequestration |
| D57.819 | Other sickle-cell disorders with crisis, unspecified |
| Abbreviation: CCS, Clinical Classifications Software; HB-SS, hemoglobin SS disease; HB-C, hemoglobin C disease. | |
Types of hospitals included in the HCUP National (Nationwide) Inpatient Sample The National (Nationwide) Inpatient Sample (NIS) is based on data from community hospitals, which are defined as short-term, non-Federal, general, and other hospitals, excluding hospital units of other institutions (e.g., prisons). The NIS includes obstetrics and gynecology, otolaryngology, orthopedic, cancer, pediatric, public, and academic medical hospitals. Excluded are long-term care facilities such as rehabilitation, psychiatric, and alcoholism and chemical dependency hospitals. Beginning in 2012, long-term acute care hospitals are also excluded. However, if a patient received long-term care, rehabilitation, or treatment for a psychiatric or chemical dependency condition in a community hospital, the discharge record for that stay will be included in the NIS. Types of hospitals included in the HCUP Nationwide Emergency Department Sample The Nationwide Emergency Department Sample (NEDS) is based on data from community hospitals, which are defined as short-term, non-Federal, general, and other hospitals, excluding hospital units of other institutions (e.g., prisons). The NEDS includes specialty, pediatric, public, and academic medical hospitals. Excluded are long-term care facilities such as rehabilitation, psychiatric, and alcoholism and chemical dependency hospitals. Hospitals included in the NEDS have hospital-owned emergency departments (EDs) and no more than 90 percent of their ED visits resulting in admission. Unit of analysis The unit of analysis for the NIS is the hospital discharge (i.e., the hospital stay), not a person or patient. This means that a person who is admitted to the hospital multiple times in 1 year will be counted each time as a separate discharge from the hospital. The unit of analysis for the NEDS is the ED visit, not a person or patient. This means that a person who is seen in the ED multiple times in 1 year will be counted each time as a separate visit in the ED. Costs and charges Total hospital charges were converted to costs using HCUP Cost-to-Charge Ratios based on hospital accounting reports from the Centers for Medicare & Medicaid Services (CMS).21 Costs reflect the actual expenses incurred in the production of hospital services, such as wages, supplies, and utility costs; charges represent the amount a hospital billed for the case. For each hospital, a hospital-wide cost-to-charge ratio is used. Hospital charges reflect the amount the hospital billed for the entire hospital stay and do not include professional (physician) fees. For the purposes of this Statistical Brief, costs are reported to the nearest hundred. Location of patients' residence Location of patients' residence are based on the rural-urban continuum codes (RUCC) for U.S. counties developed by the United States Department of Agriculture (USDA).22 For this Statistical Brief, we collapsed the RUCC categories into the following categories: Metro:
Community-level income is based on the median household income of the patient's ZIP Code of residence. Quartiles are defined so that the total U.S. population is evenly distributed. Cut-offs for the quartiles are determined annually using ZIP Code demographic data obtained from Claritas, a vendor that produces population estimates and projections based on data from the U.S. Census Bureau.23 The value ranges for the income quartiles vary by year. The income quartile is missing for patients who are homeless or foreign. Expected payer To make coding uniform across all HCUP data sources, the primary expected payer for the hospital stay and ED visit combines detailed categories into general groups:
For this Statistical Brief, when more than one payer is listed for a hospital discharge, the first-listed payer is used. Region Region is one of the four regions defined by the U.S. Census Bureau:
Admission source (now known as the patient's point of origin) indicates where the patient was located prior to admission to the hospital. Emergency admission indicates that the patient was admitted to the hospital through the ED. Discharge status Discharge status reflects the disposition of the patient at discharge from the hospital and includes whether the patient died in the hospital. About HCUP The Healthcare Cost and Utilization Project (HCUP, pronounced "H-Cup") is a family of health care databases and related software tools and products developed through a Federal-State-Industry partnership and sponsored by the Agency for Healthcare Research and Quality (AHRQ). HCUP databases bring together the data collection efforts of State data organizations, hospital associations, and private data organizations (HCUP Partners) and the Federal government to create a national information resource of encounter-level health care data. HCUP includes the largest collection of longitudinal hospital care data in the United States, with all-payer, encounter-level information beginning in 1988. These databases enable research on a broad range of health policy issues, including cost and quality of health services, medical practice patterns, access to health care programs, and outcomes of treatments at the national, State, and local market levels. HCUP would not be possible without the contributions of the following data collection Partners from across the United States: Alaska Department of Health and Social Services Alaska State Hospital and Nursing Home Association Arizona Department of Health Services Arkansas Department of Health California Office of Statewide Health Planning and Development Colorado Hospital Association Connecticut Hospital Association Delaware Division of Public Health District of Columbia Hospital Association Florida Agency for Health Care Administration Georgia Hospital Association Hawaii Health Information Corporation Illinois Department of Public Health Indiana Hospital Association Iowa Hospital Association Kansas Hospital Association Kentucky Cabinet for Health and Family Services Louisiana Department of Health Maine Health Data Organization Maryland Health Services Cost Review Commission Massachusetts Center for Health Information and Analysis Michigan Health & Hospital Association Minnesota Hospital Association Mississippi State Department of Health Missouri Hospital Industry Data Institute Montana Hospital Association Nebraska Hospital Association Nevada Department of Health and Human Services New Hampshire Department of Health & Human Services New Jersey Department of Health New Mexico Department of Health New York State Department of Health North Carolina Department of Health and Human Services North Dakota (data provided by the Minnesota Hospital Association) Ohio Hospital Association Oklahoma State Department of Health Oregon Association of Hospitals and Health Systems Oregon Office of Health Analytics Pennsylvania Health Care Cost Containment Council Rhode Island Department of Health South Carolina Revenue and Fiscal Affairs Office South Dakota Association of Healthcare Organizations Tennessee Hospital Association Texas Department of State Health Services Utah Department of Health Vermont Association of Hospitals and Health Systems Virginia Health Information Washington State Department of Health West Virginia Department of Health and Human Resources, West Virginia Health Care Authority Wisconsin Department of Health Services Wyoming Hospital Association About the NIS The HCUP National (Nationwide) Inpatient Sample (NIS) is a nationwide database of hospital inpatient stays. The NIS is nationally representative of all community hospitals (i.e., short-term, non-Federal, nonrehabilitation hospitals). The NIS includes all payers. It is drawn from a sampling frame that contains hospitals comprising more than 95 percent of all discharges in the United States. The vast size of the NIS allows the study of topics at the national and regional levels for specific subgroups of patients. In addition, NIS data are standardized across years to facilitate ease of use. Over time, the sampling frame for the NIS has changed; thus, the number of States contributing to the NIS varies from year to year. The NIS is intended for national estimates only; no State-level estimates can be produced. The unweighted sample size for the 2006 NIS is 8,074,825 (weighted, this represents 39,450,216 inpatient stays). The unweighted sample size for the 2016 NIS is 7,135,090 (weighted, this represents 35,675,421 inpatient stays). About the NEDS The HCUP Nationwide Emergency Department Database (NEDS) is a unique and powerful database that yields national estimates of emergency department (ED) visits. The NEDS was constructed using records from both the HCUP State Emergency Department Databases (SEDD) and the State Inpatient Databases (SID). The SEDD capture information on ED visits that do not result in an admission (i.e., patients who were treated in the ED and then released from the ED, or patients who were transferred to another hospital); the SID contain information on patients initially seen in the ED and then admitted to the same hospital. The NEDS was created to enable analyses of ED utilization patterns and support public health professionals, administrators, policymakers, and clinicians in their decisionmaking regarding this critical source of care. The NEDS is produced annually beginning in 2006. Over time, the sampling frame for the NEDS has changed; thus, the number of States contributing to the NEDS varies from year to year. The NEDS is intended for national estimates only; no State-level estimates can be produced. The unweighted sample size for the 2006 NEDS is 25,702,597 (weighted, this represents 120,033,750 ED visits). The unweighted sample size for the 2016 NEDS is 32,680,232 (weighted, this represents 144,842,742 ED visits). For More Information For other information on lung and respiratory conditions, including influenza, refer to the HCUP Statistical Briefs located at www.hcup-us.ahrq.gov/reports/statbriefs/sb_lung.jsp. For additional HCUP statistics, visit:
For a detailed description of HCUP and more information on the design of the National (Nationwide) Inpatient Sample (NIS) and the Nationwide Emergency Department Sample (NEDS), please refer to the following database documentation: Agency for Healthcare Research and Quality. Overview of the National (Nationwide) Inpatient Sample (NIS). Healthcare Cost and Utilization Project (HCUP). Rockville, MD: Agency for Healthcare Research and Quality. Updated August 2018. www.hcup-us.ahrq.gov/nisoverview.jsp. Accessed January 4, 2019. Agency for Healthcare Research and Quality. Overview of the Nationwide Emergency Department Sample (NEDS). Healthcare Cost and Utilization Project (HCUP). Rockville, MD: Agency for Healthcare Research and Quality. Updated October 2018. www.hcup-us.ahrq.gov/nedsoverview.jsp. Accessed January 4, 2019. Suggested Citation Fingar KR (IBM Watson Health), Liang L (AHRQ), Stocks C (AHRQ). Inpatient Hospital Stays and Emergency Department Visits Involving Influenza, 2006-2016. HCUP Statistical Brief #253. October 2019. Agency for Healthcare Research and Quality, Rockville, MD. www.hcup-us.ahrq.gov/reports/statbriefs/sb253-Influenza-Hospitalizations-ED-Visits-2006-2016.pdf. Acknowledgments The authors would like to acknowledge the contributions of Minya Sheng of IBM Watson Health. *** AHRQ welcomes questions and comments from readers of this publication who are interested in obtaining more information about access, cost, use, financing, and quality of health care in the United States. We also invite you to tell us how you are using this Statistical Brief and other HCUP data and tools, and to share suggestions on how HCUP products might be enhanced to further meet your needs. Please e-mail us at hcup@ahrq.gov or send a letter to the address below:Joel W. Cohen, Ph.D., Director Center for Financing, Access and Cost Trends Agency for Healthcare Research and Quality 5600 Fishers Lane Rockville, MD 20857 This Statistical Brief was posted online on October 1, 2019. 1 Centers for Disease Control and Prevention. The Flu Season. Page last reviewed July 12, 2018. www.cdc.gov/flu/about/season/flu-season.htm. Accessed July 1, 2019. 2 Milenkovic M, Russo CA, Elixhauser A. Hospital Stays for Influenza, 2004. HCUP Statistical Brief #16. November 2006. Agency for Healthcare Research and Quality, Rockville, MD. www.hcup-us.ahrq.gov/reports/statbriefs/sb16.pdf. Accessed July 1, 2019. 3 Uscher-Pines L, Elixhauser A. Emergency Department Visits and Hospital Inpatient Stays for Seasonal and 2009 H1N1 Influenza, 2008-2009. HCUP Statistical Brief #147. January 2013. Agency for Healthcare Research and Quality, Rockville, MD. www.hcup-us.ahrq.gov/reports/statbriefs/sb147.pdf. Accessed July 1, 2019. 4 Centers for Disease Control and Prevention. Preventive Steps. Page last reviewed November 13, 2018. www.cdc.gov/flu/prevent/prevention.htm. Accessed July 1, 2019. 5 Ibid. 6 Centers for Disease Control and Prevention. Flu Vaccination Coverage, United States, 2016-17 Influenza Season. Page last reviewed September 28, 2017. www.cdc.gov/flu/fluvaxview/coverage-1617estimates.htm##key-findings. Accessed July 1, 2019. 7 National Center for Health Statistics. Health, United States, 2016: With Chartbook on Long-term Trends in Health. Table 68: Influenza vaccination among adults aged 18 and over, by selected characteristics: United States, selected years 1989-2015. Centers for Disease Control and Prevention, National Center for Health Statistics; 2017. www.cdc.gov/nchs/data/hus/hus16.pdf#068. Accessed July 1, 2019. 8 Ibid. 9 Centers for Disease Control and Prevention. People at High Risk for Flu Complications. Page last reviewed August 27, 2018. www.cdc.gov/flu/highrisk/index.htm. Accessed July 1, 2019. 10 Ibid. 11 Tahamtan A, Tavakoli-Yaraki M, Mokhtari-Azad T, Teymoori-Rad M, Bont L, Shokri F, et al. Opioids and viral infections: a double-edged sword. Frontiers in Microbiology. 2016;7:970. 12 Centers for Disease Control and Prevention. Summary of the 2015-2016 Influenza Season. Page last reviewed September 29, 2016. www.cdc.gov/flu/about/season/flu-season-2015-2016.htm. Accessed July 1, 2019. 13 Centers for Disease Control and Prevention. Summary of the 2009-2010 Influenza Season. Page last reviewed September 8, 2010. www.cdc.gov/flu/pastseasons/0910season.htm. Accessed July 1, 2019. 14 Centers for Disease Control and Prevention. The Flu Season. Page last reviewed July 12, 2018. www.cdc.gov/flu/about/season/flu-season.htm. Accessed July 1, 2019. 15 Self-pay/no charge includes self-pay, no charge, charity, and no expected payment. 16 Centers for Disease Control and Prevention. People at High Risk for Flu Complications. Page last reviewed August 27, 2018. www.cdc.gov/flu/highrisk/index.htm. Accessed July 3, 2019. 17 Tahamtan A, Tavakoli-Yaraki M, Mokhtari-Azad T, Teymoori-Rad M, Bont L, Shokri F, et al. Opioids and viral infections: a double-edged sword. Frontiers in Microbiology. 2016;7:970. 18 Claritas. Claritas Demographic Profile by ZIP Code. https://claritas360.claritas.com/mybestsegments/. 19 Agency for Healthcare Research and Quality. HCUP Clinical Classifications Software (CCS) for ICD-9-CM. Healthcare Cost and Utilization Project (HCUP). Agency for Healthcare Research and Quality. Updated March 2017. www.hcup-us.ahrq.gov/toolssoftware/ccs/ccs.jsp. Accessed January 4, 2019. 20 Agency for Healthcare Research and Quality. Clinical Classifications Software Refined (CCSR). Healthcare Cost and Utilization Project (HCUP). Agency for Healthcare Research and Quality. Updated September 2019. www.hcup-us.ahrq.gov/toolssoftware/ccsr/ccs_refined.jsp. Accessed September 17, 2019. 21 Agency for Healthcare Research and Quality. HCUP Cost-to-Charge Ratio (CCR) Files. Healthcare Cost and Utilization Project (HCUP). 2001-2015. Agency for Healthcare Research and Quality. Updated September 2018. www.hcup-us.ahrq.gov/db/state/costtocharge.jsp. Accessed January 4, 2019. 22 United States Department of Agriculture. Rural-Urban Continuum Codes. Last updated August 20, 2019. https://www.ers.usda.gov/data-products/rural-urban-continuum-codes/. Accessed June 26, 2019. 23 Claritas. Claritas Demographic Profile by ZIP Code. https://claritas360.claritas.com/mybestsegments/. |
| Supplemental Table 1. Number (in thousands) of influenza-related inpatient stays and treat-and-release ED visits from 10 flu seasons, 2006-2016, for data presented in Figure 1 | ||||||||||
| Setting | Flu Season (number of inpatient deaths) | |||||||||
|---|---|---|---|---|---|---|---|---|---|---|
| 2006-2007 (500 deaths) | 2007-2008 (1,900 deaths) | 2008-2009 (1,000 deaths) | 2009-2010 (2,900 deaths) | 2010-2011 (2,100 deaths) | 2011-2012 (1,000 deaths) | 2012-2013 (4,000 deaths) | 2013-2014 (5,000 deaths) | 2014-2015 (7,500 deaths) | 2015-2016 (5,400 deaths) | |
| Treat and release ED visits | 187.7 | 395.4 | 257.1 | 836.8 | 377.4 | 151.6 | 686.5 | 476.6 | 851.1 | 566.2 |
| Inpatient stays | 31.5 | 81.0 | 46.6 | 115.5 | 77.2 | 37.6 | 147.2 | 140.6 | 223.3 | 151.4 |
| Total | 219.2 | 476.4 | 303.7 | 952.3 | 454.6 | 189.2 | 833.7 | 617.2 | 1,074.4 | 717.6 |
| Supplemental Table 2. Number of inpatient stays, treat-and-release ED visits, and inpatient deaths from four high-volume flu seasons, by month of admission, 2009-2016, for data presented in Figure 2 | ||||||||||||
| Month of stay/visit | Number of inpatient stays | Number of inpatient deaths | Number of emergency department visits | |||||||||
|---|---|---|---|---|---|---|---|---|---|---|---|---|
| Aug 2009-Jul 2010 | Aug 2012-Jul 2013 | Aug 2014-Jul 2015 | Oct 2015-Sep 2016 | Aug 2009-Jul 2010 | Aug 2012-Jul 2013 | Aug 2014-Jul 2015 | Oct 2015-Sep 2016 | Aug 2009-Jul 2010 | Aug 2012-Jul 2013 | Aug 2014-Jul 2015 | Oct 2015-Sep 2016 | |
| August | 3,731 | 775 | 955 | 170 | 20 | 35 | 29,523 | 2,382 | 2,701 | |||
| September | 12,307 | 1,005 | 1,865 | 333 | 40 | 55 | 115,360 | 4,576 | 4,759 | |||
| October | 46,720 | 2,050 | 3,420 | 2,895 | 1,060 | 50 | 105 | 100 | 357,648 | 9,711 | 10,283 | 9,168 |
| November | 30,307 | 5,825 | 9,790 | 3,520 | 810 | 100 | 250 | 130 | 226,478 | 37,028 | 41,286 | 12,288 |
| December | 7,967 | 27,755 | 65,145 | 21,895 | 175 | 550 | 1,935 | 1,010 | 46,751 | 210,008 | 312,835 | 18,759 |
| January | 4,775 | 64,205 | 75,655 | 9,175 | 104 | 1,900 | 3,075 | 285 | 21,139 | 227,388 | 252,431 | 33,631 |
| February | 3,257 | 23,250 | 30,005 | 31,215 | 112 | 735 | 1,005 | 975 | 14,226 | 99,703 | 110,032 | 133,289 |
| March | 3,239 | 13,315 | 19,550 | 49,315 | 84 | 305 | 520 | 1,695 | 13,540 | 65,464 | 70,966 | 226,259 |
| April | 1,291 | 5,515 | 10,360 | 20,955 | 15 | 160 | 280 | 760 | 4,860 | 20,648 | 30,921 | 87,487 |
| May | 854 | 1,695 | 3,695 | 6,590 | 24 | 60 | 145 | 205 | 3,273 | 5,778 | 9,500 | 27,791 |
| June | 651 | 1,015 | 1,785 | 2,025 | 23 | 25 | 55 | 65 | 2,189 | 2,309 | 3,350 | 6,591 |
| July | 362 | 830 | 1,025 | 1,170 | 0 | 50 | 35 | 45 | 1,807 | 1,532 | 2,024 | 2,562 |
| August | 995 | 35 | 2,681 | |||||||||
| September | 1,645 | 75 | 5,649 | |||||||||
| Supplemental Table 3. Percentage of influenza-related inpatient stays and treat-and-release ED visits for four high-volume flu seasons, by expected payer, 2009-2016, for data presented in Figure 3 | ||||||||
| Expected payer | Inpatient stays | Treat-and-release ED visits | ||||||
|---|---|---|---|---|---|---|---|---|
| 2009-2010 | 2012-2013 | 2014-2015 | 2015-2016 | 2009-2010 | 2012-2013 | 2014-2015 | 2015-2016 | |
| Medicare, 65+ years | 10.8 | 45.2 | 54.3 | 38.2 | 1.1 | 5.4 | 8.6 | 4.5 |
| Medicare, <65 years | 8.5 | 7.4 | 7.4 | 10.3 | 2.0 | 3.3 | 3.7 | 3.9 |
| Medicaid | 32.9 | 18.7 | 15.3 | 21.9 | 41.6 | 42.2 | 44.1 | 45.1 |
| Private insurance | 36.7 | 21.6 | 18.0 | 23.4 | 35.4 | 29.2 | 28.9 | 30.9 |
| Self-pay/no charge | 7.3 | 4.4 | 3.0 | 3.9 | 15.3 | 16.4 | 11.4 | 12.2 |
| Other | 3.6 | 2.4 | 1.8 | 2.2 | 3.7 | 3.4 | 3.2 | 3.2 |
| Supplemental Table 4. Differences in rates of inpatient stays and treat-and-release ED visits involving influenza, by community income and age, 2015-2016 flu season, for data presented in Figure 4 | |||||
| Age, years | Income | Influenza-related inpatient stays, 2015-2016 | Influenza-related ED visits, 2015-2016 | ||
|---|---|---|---|---|---|
| Rate per 100,000 population | Percent difference income quartile 1 versus 4 | Rate per 100,000 population | Percent difference income quartile 1 versus 4 | ||
| 0-4 | Quartile 1 (lowest) | 95.1 | 131 | 918.5 | 220 |
| Quartile 4 (highest) | 41.1 | 286.8 | |||
| 5-17 | Quartile 1 (lowest) | 16.8 | 31 | 357.1 | 146 |
| Quartile 4 (highest) | 12.8 | 144.9 | |||
| 18-49 | Quartile 1 (lowest) | 28.4 | 86 | 231.7 | 126 |
| Quartile 4 (highest) | 15.3 | 102.7 | |||
| 50-64 | Quartile 1 (lowest) | 85.6 | 138 | 131.0 | 116 |
| Quartile 4 (highest) | 36.0 | 60.7 | |||
| 65-84 | Quartile 1 (lowest) | 130.8 | 38 | 79.9 | 65 |
| Quartile 4 (highest) | 94.8 | 48.4 | |||
| 85+ | Quartile 1 (lowest) | 239.4 | -20 | 64.7 | 32 |
| Quartile 4 (highest) | 299.4 | 49.0 | |||
| Figure 5. Inpatient deaths among stays with and without influenza, overall and among stays with select conditions, 2015-2016 flu season, for data presented in Figure 5 | ||
| Condition | Percentage of inpatient stays with and without influenza resulting in in-hospital death | |
|---|---|---|
| Any influenza diagnosis | No influenza diagnosis | |
| All stays | 3.6 | 1.9 |
| Cancer | 8.7 | 5.3 |
| Heart/cerebrovascular disease | 6.4 | 4.0 |
| Opioid-related disorders | 4.0 | 1.5 |
| Diabetes | 3.8 | 2.5 |
| HIV/AIDS | 3.8 | 2.4 |
| Obesity | 3.3 | 1.6 |
| Asthma/COPD | 3.2 | 2.7 |
| Sickle cell disease | 0.5 | 0.5 |