STATISTICAL BRIEF #252 |
September 2019
(Revised September 2020)* Zeynal Karaca, Ph.D., and Kimberly W. McDermott, Ph.D. Introduction A growing proportion of all surgeries at U.S. community hospitals are performed in the ambulatory setting, 1 with the aggregate share of hospital outpatient services revenue increasing from 30 percent in 1995 to 48 percent in 2016.2 The shift to the outpatient setting has been particularly pronounced for certain surgeries, including cataract surgery3 and gynecologic procedures such as hysterectomies.4 Ambulatory surgery is more commonly performed in the treatment of certain body systems. In 2014, for example, the majority of eye; ear, mouth, nose, and throat; male genital; endocrine; and skin surgeries were conducted in the outpatient setting.5 Patient characteristics, such as type of insurance coverage, may also play an important role in determining whether a procedure will be performed in the outpatient setting.6 This Healthcare Cost and Utilization Project (HCUP) Statistical Brief presents statistics on the 20 most common major ambulatory surgeries performed in hospital-owned facilities using the 2016 Nationwide Ambulatory Surgery Sample (NASS). The distribution of these surgeries by select patient and hospital characteristics is presented. Differences greater than 10 percent between estimates are noted in the text. The NASS is the largest all-payer ambulatory surgery database that has been constructed in the United States. It tracks information about major ambulatory surgery encounters in hospital-owned facilities across the country. The database provides information on patient characteristics, clinical diagnostic and surgical procedure codes, total charges and expected source of payment, and facility characteristics. Major ambulatory surgeries are defined as selected invasive, therapeutic surgical procedures that typically require the use of an operating room and require regional anesthesia, general anesthesia, or sedation (i.e., surgeries flagged as "narrow" in the HCUP Surgery Flag Software7). Procedures intended primarily for diagnostic purposes are excluded.8 Findings Common invasive, therapeutic ambulatory surgeries, 2016 Table 1 presents the 20 major ambulatory surgeries most frequently performed in hospital-owned facilities in 2016. Frequencies, percentages of all major ambulatory surgeries, and population rates are provided. |
|
| Table 1. The 20 most common major ambulatory surgeries performed in hospital-owned facilities, 2016 | ||||
| Rank | All-listed CCS procedure group | No. of major ambulatory surgeries | Major ambulatory surgeries, % | Rate per 100,000 population |
|---|---|---|---|---|
| All-listed procedures | 13,644,800 | 100.0 | 4,223 | |
| 1 | Lens and cataract procedures | 1,340,100 | 9.9 | 415 |
| 2 | Muscle, tendon, and soft tissue OR procedures | 1,009,600 | 7.4 | 313 |
| 3 | Cholecystectomy and common duct exploration | 635,600 | 4.7 | 197 |
| 4 | Incision or fusion of joint, destruction of joint lesion | 603,100 | 4.4 | 187 |
| 5 | Inguinal and femoral hernia repair | 496,100 | 3.6 | 154 |
| 6 | OR procedures of skin and breast, including plastic procedures on breast | 488,400 | 3.6 | 151 |
| 7 | Excision of semilunar cartilage of knee | 485,500 | 3.6 | 150 |
| 8 | Tonsillectomy and/or adenoidectomy | 485,300 | 3.6 | 150 |
| 9 | Repair of diaphragmatic, incisional, and umbilical hernia | 456,500 | 3.4 | 141 |
| 10 | Decompression peripheral nerve | 410,900 | 3.0 | 127 |
| 11 | Myringotomy | 373,400 | 2.7 | 116 |
| 12 | Hysterectomy, abdominal and vaginal | 368,300 | 2.7 | 114 |
| 13 | Insertion, revision, replacement, removal of cardiac pacemaker or cardioverter/defibrillator | 338,400 | 2.5 | 105 |
| 14 | Lumpectomy, quadrantectomy of breast | 333,300 | 2.4 | 103 |
| 15 | Non-fracture, non-arthroplasty OR procedures on the bone | 319,500 | 2.3 | 99 |
| 16 | Partial excision bone | 286,000 | 2.1 | 89 |
| 17 | Bunionectomy or repair of toe deformities | 275,100 | 2.0 | 85 |
| 18 | OR procedures of mouth, nose, and throat, excluding tonsils and teeth | 269,300 | 2.0 | 83 |
| 19 | Vascular stents and OR procedures, other than head or neck | 253,800 | 1.9 | 79 |
| 20 | Laminectomy, excision intervertebral disc | 249,100 | 1.8 | 77 |
| Top 20 major ambulatory surgeries | 9,477,200 | 69.7 | 2,933 | |
| Abbreviations: CCS, Clinical Classifications Software; OR, operating room Notes: Totals were rounded to the nearest hundred. Percentages were calculated on the basis of nonrounded values. Procedures are grouped using the Agency for Healthcare Research and Quality (AHRQ) Clinical Classifications Software for Services and Procedures. Totals represent number of surgeries rather than number of encounters. A single encounter could involve more than one surgery. The 9.5 million top surgeries represent 7.7 million encounters, 1.3 million of which involved more than one top surgery. Source: Agency for Healthcare Research and Quality (AHRQ), Healthcare Cost and Utilization Project (HCUP), Nationwide Ambulatory Surgery Sample (NASS), 2016 | ||||
Table 2 presents the distribution of the 20 major ambulatory surgeries most frequently performed in hospital-owned facilities by patient sex and age group in 2016. |
| Table 2. The 20 most common major ambulatory surgeries performed in hospital-owned facilities, by patient sex and age group, 2016 | ||||||||
| Rank | All-listed CCS procedure group | Sex, % | Age group, % | |||||
|---|---|---|---|---|---|---|---|---|
| Female | Male | 0-17 years | 18-44 years | 45-64 years | 65-84 years | 85+ years | ||
| 1 | Lens and cataract procedures | 58.8 | 41.1 | 0.4 | 1.3 | 22.1 | 70.0 | 6.3 |
| 2 | Muscle, tendon, and soft tissue OR procedures | 51.1 | 48.9 | 5.3 | 20.1 | 48.9 | 24.8 | 0.9 |
| 3 | Cholecystectomy and common duct exploration | 73.8 | 26.1 | 2.3 | 43.4 | 36.2 | 17.2 | 0.9 |
| 4 | Incision or fusion of joint, destruction of joint lesion | 50.8 | 49.1 | 6.2 | 32.0 | 44.8 | 16.6 | 0.4 |
| 5 | Inguinal and femoral hernia repair | 9.6 | 90.4 | 9.3 | 17.6 | 38.4 | 31.7 | 3.0 |
| 6 | OR procedures of skin and breast, including plastic procedures on breast | 87.6 | 12.2 | 4.7 | 36.5 | 45.5 | 13.1 | 0.2 |
| 7 | Excision of semilunar cartilage of knee | 47.6 | 52.4 | 6.1 | 26.5 | 50.2 | 16.9 | 0.3 |
| 8 | Tonsillectomy and/or adenoidectomy | 51.9 | 48.0 | 80.0 | 17.2 | 2.3 | 0.4 | 0.0 |
| 9 | Repair of diaphragmatic, incisional, and umbilical hernia | 44.7 | 55.2 | 6.0 | 27.6 | 44.7 | 20.9 | 0.8 |
| 10 | Decompression peripheral nerve | 60.2 | 39.8 | 0.8 | 21.5 | 47.7 | 27.2 | 2.7 |
| 11 | Myringotomy | 41.9 | 58.1 | 92.4 | 3.0 | 2.7 | 1.6 | 0.2 |
| 12 | Hysterectomy, abdominal and vaginal | 99.8 | 0.0 | 0.0 | 44.1 | 44.8 | 10.8 | 0.3 |
| 13 | Insertion, revision, replacement, removal of cardiac pacemaker or cardioverter/defibrillator | 38.1 | 61.9 | 0.3 | 3.4 | 20.4 | 57.9 | 18.0 |
| 14 | Lumpectomy, quadrantectomy of breast | 98.0 | 1.8 | 1.9 | 19.4 | 43.7 | 32.7 | 2.4 |
| 15 | Non-fracture, non-arthroplasty OR procedures on the bone | 55.2 | 44.7 | 18.0 | 30.8 | 33.8 | 16.4 | 0.9 |
| 16 | Partial excision bone | 52.4 | 47.6 | 5.2 | 19.2 | 50.4 | 24.3 | 0.8 |
| 17 | Bunionectomy or repair of toe deformities | 78.2 | 21.8 | 2.4 | 16.3 | 49.0 | 31.3 | 1.0 |
| 18 | OR procedures of mouth, nose, and throat, excluding tonsils and teeth | 47.6 | 52.4 | 16.7 | 35.4 | 32.2 | 14.8 | 0.9 |
| 19 | Vascular stents and OR procedures, other than head or neck | 43.0 | 57.0 | 0.7 | 4.6 | 34.4 | 53.0 | 7.3 |
| 20 | Laminectomy, excision intervertebral disc | 43.1 | 56.9 | 0.3 | 25.2 | 42.2 | 30.8 | 1.4 |
| Top 20 major ambulatory surgeries | 56.5 | 43.4 | 11.7 | 21.1 | 36.0 | 28.7 | 2.5 | |
| Abbreviations: CCS, Clinical Classifications Software; OR, operating room Note: Patient sex was missing for less than 0.22 percent of procedures in each CCS category reported above, and patient age was missing for less than 0.12 percent of procedures in each category. Source: Agency for Healthcare Research and Quality (AHRQ), Healthcare Cost and Utilization Project (HCUP), Nationwide Ambulatory Surgery Sample (NASS), 2016 | ||||||||
|
|
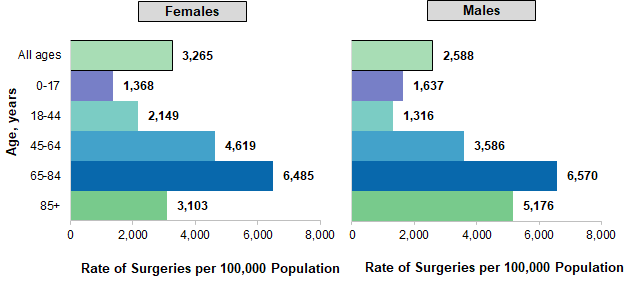
Figure 1. Female and male population rates for the 20 most common major ambulatory surgeries performed in hospital-owned facilities, by age group, 2016
Source: Agency for Healthcare Research and Quality (AHRQ), Healthcare Cost and Utilization Project (HCUP), Nationwide Ambulatory Surgery Sample (NASS), 2016 Two bar charts—one for women and one for men—that show the rate of the 20 most common major ambulatory surgeries performed in hospital-owned facilities by age group in 2016. Data are provided in Supplemental Table 1.
|
|
| Table 3. The 20 most common major ambulatory surgeries performed in hospital-owned facilities, by primary expected payer, 2016 | ||||||
| Rank | All-listed CCS procedure group | Primary expected payer, % | ||||
|---|---|---|---|---|---|---|
| Medicare | Medicaid | Private | Self-pay/no charge | Other | ||
| 1 | Lens and cataract procedures | 68.3 | 5.0 | 23.1 | 1.4 | 1.9 |
| 2 | Muscle, tendon, and soft tissue OR procedures | 27.2 | 12.5 | 49.6 | 1.7 | 8.8 |
| 3 | Cholecystectomy and common duct exploration | 20.6 | 17.4 | 56.2 | 3.2 | 2.5 |
| 4 | Incision or fusion of joint, destruction of joint lesion | 19.7 | 12.4 | 55.6 | 1.4 | 10.8 |
| 5 | Inguinal and femoral hernia repair | 32.1 | 12.2 | 48.0 | 2.6 | 5.0 |
| 6 | OR procedures of skin and breast, including plastic procedures on breast | 12.9 | 10.2 | 52.1 | 20.6 | 3.8 |
| 7 | Excision of semilunar cartilage of knee | 18.6 | 11.6 | 60.2 | 1.4 | 8.1 |
| 8 | Tonsillectomy and/or adenoidectomy | 1.0 | 40.0 | 54.5 | 0.8 | 3.6 |
| 9 | Repair of diaphragmatic, incisional, and umbilical hernia | 23.6 | 15.1 | 55.2 | 2.1 | 3.9 |
| 10 | Decompression peripheral nerve | 33.2 | 14.5 | 44.0 | 1.4 | 6.7 |
| 11 | Myringotomy | 2.5 | 41.4 | 51.6 | 0.7 | 3.7 |
| 12 | Hysterectomy, abdominal and vaginal | 12.9 | 13.1 | 69.3 | 1.9 | 2.7 |
| 13 | Insertion, revision, replacement, removal of cardiac pacemaker or cardioverter/defibrillator | 73.8 | 4.1 | 18.3 | 0.8 | 1.5 |
| 14 | Lumpectomy, quadrantectomy of breast | 34.0 | 10.4 | 51.5 | 1.8 | 2.1 |
| 15 | Non-fracture, non-arthroplasty OR procedures on the bone | 20.2 | 19.0 | 50.5 | 3.0 | 7.1 |
| 16 | Partial excision bone | 28.3 | 11.6 | 50.4 | 1.2 | 8.3 |
| 17 | Bunionectomy or repair of toe deformities | 33.4 | 10.5 | 52.4 | 0.9 | 2.6 |
| 18 | OR procedures of mouth, nose, and throat, excluding tonsils and teeth | 16.0 | 16.4 | 62.2 | 1.9 | 3.5 |
| 19 | Vascular stents and OR procedures, other than head or neck | 66.2 | 8.2 | 21.4 | 1.3 | 1.8 |
| 20 | Laminectomy, excision intervertebral disc | 33.1 | 7.0 | 51.9 | 1.1 | 6.8 |
| Top 20 major ambulatory surgeries | 31.1 | 14.0 | 47.1 | 2.6 | 4.9 | |
| Abbreviations: CCS, Clinical Classifications Software; OR, operating room Notes: Self-pay/no charge includes self-pay, no charge, charity, and no expected payment. Payer information was missing for less than 0.5 percent of procedures in each CCS category reported above, with the exception of insertion, revision, replacement, removal of cardiac pacemaker or cardioverter/defibrillator (1.5 percent missing); and vascular stents and OR procedures, other than head or neck (1.3 percent missing). Source: Agency for Healthcare Research and Quality (AHRQ), Healthcare Cost and Utilization Project (HCUP), Nationwide Ambulatory Surgery Sample (NASS), 2016 | ||||||
Hospital characteristics associated with common invasive, therapeutic ambulatory surgeries, 2016 Tables 4 and 5 present the distribution of the 20 major ambulatory surgeries most frequently performed in hospital-owned facilities in 2016 by select hospital characteristics. |
| Table 4. The 20 most common major ambulatory surgeries performed in hospital-owned facilities, by hospital location, 2016 | |||||||
| Rank | All-listed CCS procedure group | Census region, % | Urban-rural, % | ||||
|---|---|---|---|---|---|---|---|
| Northeast | Midwest | South | West | Urban | Rural | ||
| 1 | Lens and cataract procedures | 17.3 | 30.3 | 33.6 | 18.9 | 74.4 | 25.6 |
| 2 | Muscle, tendon, and soft tissue OR procedures | 19.0 | 26.4 | 34.0 | 20.6 | 83.4 | 16.6 |
| 3 | Cholecystectomy and common duct exploration | 15.8 | 25.1 | 41.2 | 17.9 | 78.8 | 21.2 |
| 4 | Incision or fusion of joint, destruction of joint lesion | 20.4 | 25.2 | 34.1 | 20.3 | 84.0 | 16.0 |
| 5 | Inguinal and femoral hernia repair | 20.1 | 23.7 | 34.3 | 21.9 | 85.6 | 14.4 |
| 6 | OR procedures of skin and breast, including plastic procedures on breast | 17.3 | 21.7 | 40.9 | 20.1 | 95.3 | 4.7 |
| 7 | Excision of semilunar cartilage of knee | 19.6 | 26.5 | 33.6 | 20.3 | 80.7 | 19.3 |
| 8 | Tonsillectomy and/or adenoidectomy | 16.8 | 26.6 | 40.7 | 15.9 | 84.9 | 15.1 |
| 9 | Repair of diaphragmatic, incisional, and umbilical hernia | 17.9 | 25.5 | 37.9 | 18.7 | 85.2 | 14.8 |
| 10 | Decompression peripheral nerve | 20.0 | 30.8 | 32.7 | 16.5 | 78.1 | 21.9 |
| 11 | Myringotomy | 16.2 | 28.6 | 44.1 | 11.1 | 84.1 | 15.9 |
| 12 | Hysterectomy, abdominal and vaginal | 12.9 | 24.7 | 43.9 | 18.5 | 88.6 | 11.4 |
| 13 | Insertion, revision, replacement, removal of cardiac pacemaker or cardioverter/defibrillator | 18.2 | 25.9 | 40.6 | 15.3 | 93.4 | 6.6 |
| 14 | Lumpectomy, quadrantectomy of breast | 21.1 | 23.0 | 36.3 | 19.6 | 90.6 | 9.4 |
| 15 | Non-fracture, non-arthroplasty OR procedures on the bone | 16.6 | 25.4 | 36.1 | 21.9 | 88.9 | 11.1 |
| 16 | Partial excision bone | 17.7 | 28.5 | 36.3 | 17.6 | 83.0 | 17.0 |
| 17 | Bunionectomy or repair of toe deformities | 21.2 | 28.8 | 30.9 | 19.2 | 86.0 | 14.0 |
| 18 | OR procedures of mouth, nose, and throat, excluding tonsils and teeth | 14.5 | 20.3 | 47.0 | 18.2 | 91.2 | 8.8 |
| 19 | Vascular stents and OR procedures, other than head or neck | 16.8 | 29.0 | 41.7 | 12.5 | 91.8 | 8.2 |
| 20 | Laminectomy, excision intervertebral disc | 19.4 | 24.2 | 40.1 | 16.3 | 94.4 | 5.6 |
| Top 20 major ambulatory surgeries | 18.0 | 26.4 | 37.1 | 18.5 | 84.2 | 15.8 | |
| Abbreviations: CCS, Clinical Classifications Software; OR, operating room Source: Agency for Healthcare Research and Quality (AHRQ), Healthcare Cost and Utilization Project (HCUP), Nationwide Ambulatory Surgery Sample (NASS), 2016 | |||||||
|
| Table 5. The 20 most common major ambulatory surgeries performed in hospital-owned facilities, by hospital size, ownership, and teaching status, 2016 | ||||||||
| Rank | All-listed CCS procedure group | Hospital size, % | Hospital ownership, % | Teaching hospital, % | ||||
|---|---|---|---|---|---|---|---|---|
| <100 beds | 100-299 beds | 300+ beds | Public | Not-for-profit | For-profit | |||
| 1 | Lens and cataract procedures | 27.2 | 34.5 | 38.3 | 16.1 | 74.6 | 9.4 | 52.9 |
| 2 | Muscle, tendon, and soft tissue OR procedures | 20.0 | 35.4 | 44.6 | 12.3 | 77.0 | 10.6 | 60.6 |
| 3 | Cholecystectomy and common duct exploration | 20.9 | 39.5 | 39.6 | 11.5 | 74.7 | 13.8 | 52.8 |
| 4 | Incision or fusion of joint, destruction of joint lesion | 20.5 | 36.8 | 42.6 | 11.2 | 77.5 | 11.3 | 60.0 |
| 5 | Inguinal and femoral hernia repair | 17.1 | 36.6 | 46.3 | 11.0 | 76.8 | 12.2 | 60.0 |
| 6 | OR procedures of skin and breast, including plastic procedures on breast | 9.1 | 30.8 | 60.0 | 9.7 | 79.4 | 10.9 | 73.9 |
| 7 | Excision of semilunar cartilage of knee | 23.3 | 38.6 | 38.0 | 10.6 | 76.7 | 12.7 | 55.0 |
| 8 | Tonsillectomy and/or adenoidectomy | 15.6 | 34.4 | 50.1 | 10.2 | 78.7 | 11.1 | 66.2 |
| 9 | Repair of diaphragmatic, incisional, and umbilical hernia | 17.7 | 37.1 | 45.2 | 10.8 | 75.9 | 13.3 | 58.4 |
| 10 | Decompression peripheral nerve | 22.7 | 36.2 | 41.1 | 12.9 | 77.1 | 10.0 | 56.5 |
| 11 | Myringotomy | 16.7 | 34.5 | 48.8 | 10.5 | 76.9 | 12.6 | 65.1 |
| 12 | Hysterectomy, abdominal and vaginal | 11.3 | 36.3 | 52.5 | 9.5 | 75.0 | 15.6 | 63.9 |
| 13 | Insertion, revision, replacement, removal of cardiac pacemaker or cardioverter/defibrillator | 3.8 | 31.6 | 64.6 | 7.6 | 77.6 | 14.8 | 72.5 |
| 14 | Lumpectomy, quadrantectomy of breast | 9.8 | 35.2 | 55.0 | 9.9 | 79.3 | 10.8 | 67.5 |
| 15 | Non-fracture, non-arthroplasty OR procedures on the bone | 14.1 | 31.6 | 54.4 | 13.0 | 76.6 | 10.4 | 70.2 |
| 16 | Partial excision bone | 21.9 | 36.0 | 42.2 | 11.5 | 77.8 | 10.7 | 57.0 |
| 17 | Bunionectomy or repair of toe deformities | 19.8 | 39.2 | 41.0 | 9.8 | 78.1 | 12.1 | 56.9 |
| 18 | OR procedures of mouth, nose, and throat, excluding tonsils and teeth | 10.2 | 35.0 | 54.8 | 18.2 | 72.2 | 9.5 | 69.6 |
| 19 | Vascular stents and OR procedures, other than head or neck | 4.5 | 36.1 | 59.4 | 8.7 | 77.0 | 14.3 | 67.3 |
| 20 | Laminectomy, excision intervertebral disc | 8.3 | 33.8 | 58.0 | 7.6 | 78.6 | 13.7 | 70.7 |
| Top 20 major ambulatory surgeries | 17.8 | 35.5 | 46.7 | 11.7 | 76.6 | 11.6 | 61.1 | |
| Abbreviations: CCS, Clinical Classifications Software; OR, operating room Source: Agency for Healthcare Research and Quality (AHRQ), Healthcare Cost and Utilization Project (HCUP), Nationwide Ambulatory Surgery Sample (NASS), 2016 | ||||||||
About Statistical Briefs Healthcare Cost and Utilization Project (HCUP) Statistical Briefs provide basic descriptive statistics on a variety of topics using HCUP administrative health care data. Topics include hospital inpatient, ambulatory surgery, and emergency department use and costs, quality of care, access to care, medical conditions, procedures, and patient populations, among other topics. The reports are intended to generate hypotheses that can be further explored in other research; the reports are not designed to answer in-depth research questions using multivariate methods. Data Source The estimates in this Statistical Brief are based upon data from the HCUP 2016 Nationwide Ambulatory Surgery Sample (NASS). Supplemental sources included 2016 population denominator data for use with HCUP databases, derived from information available from the U.S. Census Bureau.10 Definitions Procedures, Current Procedural Terminology (CPT®), and Clinical Classifications Software (CCS) for Services and Procedures All-listed procedures include all procedures performed during the hospital stay or outpatient visit, whether for definitive treatment or for diagnostic or exploratory purposes. CPT assigns numeric codes to procedures. There are approximately 9,600 CPT procedure codes. CCS - Services and Procedures provides a method for classifying CPT and Healthcare Common Procedure Coding System codes into clinically meaningful procedure categories.11 This clinical grouper makes it easier to quickly understand patterns of procedure use. Encounters included in HCUP Nationwide Ambulatory Surgery Sample The Nationwide Ambulatory Surgery Sample (NASS) is limited to encounters with at least one "in-scope" ambulatory surgery on the record, performed at hospital-owned facilities. In-scope procedures are defined as major surgeries (invasive, therapeutic procedures that typically require the use of an operating room and require regional anesthesia, general anesthesia or sedation, flagged as "narrow" surgeries in the HCUP Surgery Flag Software12) belonging to a subset of CCS procedure groups with relatively high procedure volume, a substantial share of procedures performed in the hospital outpatient setting, and evidence of reliable reporting from hospitals in the Ambulatory Surgery and Services Databases (SASD). Types of hospitals included in HCUP Nationwide Ambulatory Surgery Sample The NASS is based on data from hospital-owned ambulatory surgery facilities. The designation of a facility as hospital-owned is specific to its financial relationship with a hospital that provides inpatient care and is not related to its physical location. Ambulatory surgery performed in hospital-owned facilities may be performed within the hospital, in a facility attached to the hospital, or in a facility physically separated from the hospital. The NASS is further limited to ambulatory surgeries performed at facilities owned by community hospitals. Community hospitals are defined as short-term, non-Federal, general, and other specialty hospitals, excluding hospital units of other institutions (e.g., prisons). The NASS is also limited to community hospitals providing general medical and surgical services to adults and children, thus excluding certain types of specialty hospitals. Unit of analysis The unit of analysis is the ambulatory surgery, not a person or patient or an encounter. If a person has multiple ambulatory surgeries in 1 year—whether these surgeries are performed during the same encounter or during multiple encounters—the surgeries are counted as separate and unique surgeries. Hospital location The classification of whether a hospital is in a metropolitan area (urban) or nonmetropolitan area (rural) is assigned from the American Hospital Association (AHA) Annual Survey and is based on the Core Based Statistical Area (CBSA) definition of rurality developed by the Office of Management and Budget. Hospitals located in counties with a CBSA type of "Division" or "Metropolitan" were considered urban, and hospitals with a CBSA type of "Rural" or "Micropolitan" were classified as rural. The CBSA classification released in 2011 was based on the 2000 Census; the CBSA classification released in 2014 was based on the 2010 Census. Expected payer To make coding uniform across all HCUP data sources, the primary expected payer for the hospital stay combines detailed categories into general groups:
For this Statistical Brief, when more than one payer is listed for a hospital discharge, the primary payer is used. Region Region is one of the four regions defined by the U.S. Census Bureau:
The Healthcare Cost and Utilization Project (HCUP, pronounced "H-Cup") is a family of health care databases and related software tools and products developed through a Federal-State-Industry partnership and sponsored by the Agency for Healthcare Research and Quality (AHRQ). HCUP databases bring together the data collection efforts of State data organizations, hospital associations, and private data organizations (HCUP Partners) and the Federal government to create a national information resource of encounter-level health care data. HCUP includes the largest collection of longitudinal hospital care data in the United States, with all-payer, encounter-level information beginning in 1988. These databases enable research on a broad range of health policy issues, including cost and quality of health services, medical practice patterns, access to health care programs, and outcomes of treatments at the national, State, and local market levels. HCUP would not be possible without the contributions of the following data collection Partners from across the United States: Alaska Department of Health and Social Services Alaska State Hospital and Nursing Home Association Arizona Department of Health Services Arkansas Department of Health California Office of Statewide Health Planning and Development Colorado Hospital Association Connecticut Hospital Association Delaware Division of Public Health District of Columbia Hospital Association Florida Agency for Health Care Administration Georgia Hospital Association Hawaii Health Information Corporation Illinois Department of Public Health Indiana Hospital Association Iowa Hospital Association Kansas Hospital Association Kentucky Cabinet for Health and Family Services Louisiana Department of Health Maine Health Data Organization Maryland Health Services Cost Review Commission Massachusetts Center for Health Information and Analysis Michigan Health & Hospital Association Minnesota Hospital Association Mississippi State Department of Health Missouri Hospital Industry Data Institute Montana Hospital Association Nebraska Hospital Association Nevada Department of Health and Human Services New Hampshire Department of Health & Human Services New Jersey Department of Health New Mexico Department of Health New York State Department of Health North Carolina Department of Health and Human Services North Dakota (data provided by the Minnesota Hospital Association) Ohio Hospital Association Oklahoma State Department of Health Oregon Association of Hospitals and Health Systems Oregon Office of Health Analytics Pennsylvania Health Care Cost Containment Council Rhode Island Department of Health South Carolina Revenue and Fiscal Affairs Office South Dakota Association of Healthcare Organizations Tennessee Hospital Association Texas Department of State Health Services Utah Department of Health Vermont Association of Hospitals and Health Systems Virginia Health Information Washington State Department of Health West Virginia Department of Health and Human Resources, West Virginia Health Care Authority Wisconsin Department of Health Services Wyoming Hospital Association About the NASS The HCUP Nationwide Ambulatory Surgery Sample (NASS) is a calendar-year encounter-level database constructed using records from the HCUP State Ambulatory Surgery and Services Databases (SASD). The NASS is the largest all-payer ambulatory surgery database that has been constructed in the United States. Unweighted, the 2016 NASS contains approximately 7.6 million major ambulatory surgery encounters each year. Weighted, it estimates approximately 10.6 million major ambulatory surgery encounters in the United States. The NASS tracks information about major ambulatory surgery encounters in hospital-owned facilities across the country and provides information on patient characteristics, clinical diagnostic and surgical procedure codes, total charges and expected source of payment, and facility characteristics. Major ambulatory surgeries are defined as selected invasive, therapeutic surgical procedures that typically require the use of an operating room and require regional anesthesia, general anesthesia, or sedation. (These surgeries are flagged as "narrow" in the HCUP Surgery Flag Software.13) Procedures intended primarily for diagnostic purposes are excluded. The 2016 NASS is an approximate 63 percent sample of the universe hospital-owned facilities and an approximate 72 percent sample of the universe ambulatory surgery encounters. Weights are included for the calculation of national estimates of ambulatory surgeries. For More Information For other information on ambulatory surgeries and other procedures, refer to the HCUP Statistical Briefs located at www.hcup-us.ahrq.gov/reports/statbriefs/sb_procedures.jsp. For additional HCUP statistics, visit:
For a detailed description of HCUP and more information on the design of the Nationwide Ambulatory Surgery Sample (NASS), please refer to the following database documentation: Agency for Healthcare Research and Quality. Overview of the Nationwide Ambulatory Surgery Sample (NASS). Healthcare Cost and Utilization Project (HCUP). Rockville, MD: Agency for Healthcare Research and Quality. Updated August 2019. www.hcup-us.ahrq.gov/nassoverview.jsp. Accessed September 18, 2019. Suggested Citation Karaca Z (AHRQ), McDermott KW (Watson Health). High-Volume Invasive, Therapeutic Ambulatory Surgeries Performed in Hospital-Owned Facilities, 2016. HCUP Statistical Brief #252. September 2019. Agency for Healthcare Research and Quality, Rockville, MD. www.hcup-us.ahrq.gov/reports/statbriefs/sb252-Invasive-Ambulatory-Surgeries-2016.pdf. Acknowledgments The authors would like to acknowledge the contributions of Richele Benevent of IBM Watson Health. *** AHRQ welcomes questions and comments from readers of this publication who are interested in obtaining more information about access, cost, use, financing, and quality of health care in the United States. We also invite you to tell us how you are using this Statistical Brief and other HCUP data and tools, and to share suggestions on how HCUP products might be enhanced to further meet your needs. Please e-mail us at hcup@ahrq.gov or send a letter to the address below:Joel W. Cohen, Ph.D., Director Center for Financing, Access and Cost Trends Agency for Healthcare Research and Quality 5600 Fishers Lane Rockville, MD 20857 This Statistical Brief was posted online on September 18, 2019. The revised version of this Statistical Brief was posted online on September 21, 2020. *The information in this Statistical Brief was revised using an updated version of the 2016 Nationwide Ambulatory Surgery Sample (NASS). One update involved a change to the census region assigned to a subset of hospitals in the sample, which afected the distributions by census region reported in Table 4. This change also affected the encounter weights used to produce national estimates, resulting in minor changes to the other percentages and rates reported in this Statistical Brief. A second update to the NASS applied a preliminary version of v2019.2 of the HCUP Surgery Flag Software for Services and Procedures that included narrow surgeries identified in the following ranges of CPT codes: surgical (10004-69990), emerging technology (0100T-0588T), and cardiac-related medical (92920-93986). Combined, these updates affected the rank order of 4 of the 20 top ambulatory major surgeries reported in this Statistical Brief: bunionectomy or repair of toe deformities; operating room (OR) procedures of mouth, nose, and throat, excluding tonsils and teeth; vascular stents and OR procedures, other than head or neck; and laminectomy, excision intervertebral disc. This version of the Statistical Brief also reflects a change to the hospital size distributions reported in Table 5. The percentages reported in the previous version represented small, medium, and large bed size categories that were dependent on hospital region, location, and teaching status. This revision reports percentages based on absolute number of hospital beds. 1 American Hospital Association. Utilization and Volume. In: Trend Watch Chartbook 2018, Trends Affecting Hospitals and Health Systems; Chapter 3. www.aha.org/system/files/2018-07/2018-aha-chartbook.pdf. 2 American Hospital Association. Utilization and Volume. In: Trend Watch Chartbook 2018, Trends Affecting Hospitals and Health Systems; Chapter 4. www.aha.org/system/files/2018-07/2018-aha-chartbook.pdf. 3 Stagg BC, Talwar N, Mattox C, Lee PP, Stein JD. Trends in use of ambulatory surgery centers for cataract surgery in the United States, 2001-2014. JAMA Ophthalmology. 2018;136(1);53-60. 4 Doll KM, Dusetzina SB, Robinson W. Trends in inpatient and outpatient hysterectomy and oophorectomy rates among commercially insured women in the United States, 2000-2014. JAMA Surgery. 2016;151(9):876-7. 5 Steiner CA, Karaca Z, Moore BJ, Imshaug MC, Pickens G. Surgeries in Hospital-Based Ambulatory Surgery and Hospital Inpatient Settings, 2014. HCUP Statistical Brief #223. May 2017. Agency for Healthcare Research and Quality, Rockville, MD. https://hcup-us.ahrq.gov/reports/statbriefs/sb223-Ambulatory-Inpatient-Surgeries-2014.pdf. Accessed July 11, 2019. 6 Case C, Johantgen M, Steiner C. Outpatient mastectomy: clinical, payer, and geographic influences. Health Services Research. 2001;36(5):869-84. 7 Agency for Healthcare Research and Quality. Surgery Flag Software for Services and Procedures. Healthcare Cost and Utilization Project (HCUP). Last modified August 7, 2019. www.hcup-us.ahrq.gov/toolssoftware/surgeryflags_svcproc/surgeryflagssvc_proc.jsp. Accessed August 13, 2020. The 2016 NASS applied a preliminary version of v2019.2 that included narrow surgeries identified in the following ranges of CPT codes: surgical (10004-69990), emerging technology (0100T-0588T), and cardiac-related medical (92920-93986). 8 The NASS sample is limited to 74 Clinical Classifications Software for Services and Procedures categories representing major surgeries with relatively high procedure volumes, a substantial share of procedures occurring in the hospital outpatient setting, and reliable reporting from hospitals. 9 Self-pay/no charge includes self-pay, no charge, charity, and no expected payment. 10 Barrett M, Coffey R, Levit K. Population Denominator Data for Use with the HCUP Databases (Updated with 2016 Population Data). HCUP Methods Series Report #2017-04. October 17, 2017. U.S. Agency for Healthcare Research and Quality. www.hcup-us.ahrq.gov/reports/methods/2017-04.pdf. Accessed January 4, 2019. 11 Agency for Healthcare Research and Quality. HCUP Clinical Classifications Software (CCS) for Services and Procedures. Healthcare Cost and Utilization Project (HCUP). Agency for Healthcare Research and Quality. Updated May 2018. https://www.hcup-us.ahrq.gov/toolssoftware/ccs_svcsproc/ccssvcproc.jsp. Accessed July 23, 2019. 12 Agency for Healthcare Research and Quality. Surgery Flag Software for Services and Procedures. Healthcare Cost and Utilization Project (HCUP). Last modified August 7, 2019. www.hcup-us.ahrq.gov/toolssoftware/surgeryflags_svcproc/surgeryflagssvc_proc.jsp. Accessed August 13, 2020. The 2016 NASS applied a preliminary version of v2019.2 that included narrow surgeries identified in the following ranges of CPT codes: surgical (10004-69990), emerging technology (0100T-0588T), and cardiac-related medical (92920-93986) 13 Agency for Healthcare Research and Quality. Surgery Flag Software for Services and Procedures. Healthcare Cost and Utilization Project (HCUP). Last modified August 7, 2019. www.hcup-us.ahrq.gov/toolssoftware/surgeryflags_svcproc/surgeryflagssvc_proc.jsp. Accessed August 13, 2020. The 2016 NASS applied a preliminary version of v2019.2 that included narrow surgeries identified in the following ranges of CPT codes: surgical (10004-69990), emerging technology (0100T-0588T), and cardiac-related medical (92920-93986). |
| Supplemental Table 1. Female and male population rates for the 20 most common major ambulatory surgeries performed in hospital-owned facilities, by age group, 2016, for data presented in Figure 1 | ||
| Age group, years | No. of surgeries per 100,000 female population | No. of surgeries per 100,000 male population |
|---|---|---|
| All ages | 3,265 | 2,588 |
| 0-17 | 1,368 | 1,637 |
| 18-44 | 2,149 | 1,316 |
| 45-64 | 4,619 | 3,586 |
| 65-84 | 6,485 | 6,570 |
| 85+ | 3,103 | 5,176 |
| Internet Citation: Statistical Brief #252. Healthcare Cost and Utilization Project (HCUP). September 2020. Agency for Healthcare Research and Quality, Rockville, MD. www.hcup-us.ahrq.gov/reports/statbriefs/sb252-Invasive-Ambulatory-Surgeries-2016.jsp?utm_source=ahrq&utm_medium=en2&utm_term=Surgeries&utm_content=2&utm_campaign=ahrq_en10_08_2019. |
| Are you having problems viewing or printing pages on this website? |
| If you have comments, suggestions, and/or questions, please contact hcup@ahrq.gov. |
| Privacy Notice, Viewers & Players |
| Last modified 9/21/20 |