STATISTICAL BRIEF #251 |
September 2019
Kathryn R. Fingar, Ph.D., M.P.H., Pamela L. Owens, Ph.D., Lawrence D. Reid, Ph.D., M.P.H., Kamila B. Mistry, Ph.D., M.P.H., and Marguerite L. Barrett, M.S. Introduction Approximately 100,000 Americans have sickle cell disease (SCD), a genetic group of blood disorders that most frequently affect individuals with ancestry from Africa, certain Mediterranean countries, Saudi Arabia, India, and Spanish-speaking regions of South America, Central America, and the Caribbean (areas of the world where malaria is or was more common).1,2 SCD alters the body's red blood cells, causing some to have a disc or sickle shape and to become hard and sticky.3,4 When sickled red blood cells travel through small blood vessels, they can block blood flow that carries oxygen to vital organs. As a result, people with SCD experience "pain episodes" or "pain crises" that start suddenly, vary in severity, and can last any length of time.5 Pain is the leading reason people with SCD go to the hospital or the emergency department.6 Additional complications of SCD include repeated infections, painful swelling in hands and feet, acute chest syndrome, and stroke, to name a few.7,8 Advancements in the treatment of SCD complications among children have reduced mortality rates so that nearly 95 percent of individuals born with SCD in the United States reach 18 years of age.9,10,11 Although somewhat dated, the average life expectancy in 2005 for individuals with SCD was 42 years for females and 38 years for males.12 Continued advancements in healthcare and treatment may also extend life expectancies of adults with SCD.13 Receipt of high-quality and appropriate care and treatment can help relieve symptoms, reduce complications, and minimize organ damage.14,15 Limited knowledge of SCD treatment guidelines among healthcare professionals continues to pose a barrier to effective patient-provider relationships,16 and this barrier contributes to lower quality of life for those with SCD. The Department of Health and Human Services has prioritized SCD research and education to break down barriers for those seeking treatment and funding, find a cure beyond bone marrow and stem cell transplants, educate providers on how to identify and treat patients in a pain crisis, and bridge the transition between SCD pediatric cases to adult care.17 This Healthcare Cost and Utilization Project (HCUP) Statistical Brief presents statistics on inpatient stays among patients with SCD. Historical trends are presented by patient age from 2000 through 2016 using the National (Nationwide) Inpatient Sample (NIS). Characteristics of inpatient stays with and without SCD are examined in 2016, overall and by whether SCD (i.e., a principal diagnosis) or a secondary diagnosis (i.e., a condition that coexists at the time of the inpatient stay) was the reason for the stay. SCD-related stays are examined with respect to whether a pain crisis was present. Additionally, costs, length of stay, and 30-day all-cause readmission rates following stays involving SCD are provided. Finally, the location of inpatient hospital care for patients with SCD is shown. Because of the large sample size of the HCUP NIS, small differences can be statistically significant. Thus, only percentage differences greater than or equal to 10 percent are noted in the text. For further information on the methodology, see the Data Source and Definitions sections at the end of this Statistical Brief. Findings Trends in inpatient stays involving SCD, 2000-2016 Figure 1 displays the number of inpatient stays with any SCD diagnosis by age group from 2000 through 2016. |
|
|
Figure 1. Number of hospital inpatient stays among patients with SCD, by age in years, 2000-2016
Abbreviations: ICD-9-CM, International Classification of Diseases, Ninth Revision, Clinical Modification; ICD-10-CM, International Classification of Diseases, Tenth Revision, Clinical Modification; SCD, sickle cell disease; y, years Line graph that shows the number of hospital stays with any sickle cell disease diagnosis from 2000 to 2016 by age group. Data are provided in Supplemental Table 1.
|
Table 1 displays select characteristics of stays among patients with and without SCD in 2016. |
| Table 1. Characteristics of inpatient stays with and without a diagnosis of SCD, 2016 | |||||
| Characteristic | Any SCD diagnosis | No diagnosis of SCD | |||
|---|---|---|---|---|---|
| Total | Principal diagnosis | Secondary diagnosis | |||
| With a pain crisis | Without a pain crisis | ||||
| All stays, N | 134,000 | 95,600 | 13,200 | 25,200 | 35,500,000 |
| SCD-related stays, % | 100.0 | 71.3 | 9.9 | 18.8 | - |
| Evidence of pain crisis, % | 78.3 | 96.0 | 100.0 | - | - |
| Age, years, % | |||||
| <18 | 19.2 | 19.0 | 9.6 | 25.0 | 15.3 |
| 18-34 | 50.7 | 55.2 | 57.0 | 30.2 | 16.3 |
| 35-44 | 14.7 | 14.7 | 16.1 | 14.1 | 8.0 |
| 45-64 | 13.2 | 10.5 | 16.2 | 21.9 | 24.7 |
| 65+ | 2.2 | 0.6 | 1.2 | 8.6 | 35.7 |
| Race/ethnicity, % | |||||
| Black | 87.5 | 88.7 | 89.7 | 81.7 | 14.2 |
| Hispanic | 3.9 | 3.6 | 3.2 | 5.4 | 11.7 |
| White | 1.7 | 1.0 | 1.3 | 4.7 | 62.3 |
| Other | 3.0 | 2.7 | 2.7 | 4.2 | 6.8 |
| Missinga | 3.9 | 4.0 | 3.1 | 4.0 | 5.1 |
| Male, % | 45.2 | 47.6 | 37.5 | 40.1 | 43.2 |
| Admitted from the ED, % | 79.6 | 84.5 | 77.7 | 62.1 | 51.3 |
| Discharge disposition, % | |||||
| Home or home health care | 91.7 | 93.6 | 88.3 | 86.6 | 80.9 |
| Other hospital | 3.6 | 1.7 | 6.3 | 9.1 | 15.9 |
| Died | 0.5 | 0.2 | 1.4 | 1.2 | 1.9 |
| Against medical advice | 4.1 | 4.4 | 4.0 | 3.0 | 1.2 |
| Primary expected payer, % | |||||
| Medicare, 65+ years | 1.8 | 0.5 | 1.0 | 7.4 | 31.8 |
| Medicare, <65 years | 23.9 | 25.0 | 28.8 | 17.3 | 7.8 |
| Medicaid | 49.6 | 50.9 | 44.8 | 47.0 | 23.0 |
| Private insurance | 18.3 | 17.8 | 18.1 | 20.3 | 30.1 |
| Self-pay/no chargeb | 3.7 | 3.4 | 4.3 | 4.5 | 4.2 |
| Other payersc | 2.5 | 2.2 | 2.8 | 3.3 | 3.0 |
| Community-level income, % | |||||
| Quartile 1 (lowest) | 50.9 | 51.1 | 52.6 | 49.3 | 30.1 |
| Quartile 2 | 21.7 | 22.0 | 20.8 | 20.9 | 25.0 |
| Quartile 3 | 16.0 | 15.9 | 14.6 | 16.8 | 23.5 |
| Quartile 4 (highest) | 10.0 | 9.6 | 10.7 | 11.1 | 19.7 |
| Location of patient residence, % | |||||
| Metro area | 92.8 | 93.2 | 91.7 | 92.0 | 83.5 |
| Rural, adjacent to metro area | 4.8 | 4.7 | 4.8 | 5.3 | 10.5 |
| Rural, remote area | 2.0 | 1.9 | 3.1 | 2.0 | 5.5 |
| Abbreviations: ED, emergency department; SCD, sickle cell disease; -, not applicable. Note: The number of stays is rounded to the nearest hundred. Percentages may not add to 100 because of missing data (i.e., less than 2 percent for age, sex, discharge disposition, expected payer, community-level income, and location of residence). a Additional information on missing data for race/ethnicity is discussed in the Definitions section of this Statistical Brief. b Self-pay/no charge: includes self-pay, no charge, charity, and no expected payment. c Other payers include Federal and local government programs (see Definitions section) and Workers' Compensation. Source: Agency for Healthcare Research and Quality (AHRQ), Healthcare Cost and Utilization Project (HCUP), National Inpatient Sample (NIS), 2016 | |||||
|
|
Figure 2. SCD-related stays by age group, 2016
Abbreviation: SCD, sickle cell disease Bar chart that shows the percentage of hospital stays with a principal diagnosis of sickle cell disease, with a secondary diagnosis of sickle cell disease with pain crisis and without pain crisis in 2016 by age group. Data are provided in Supplemental Table 2.
|
|
|
Figure 3. Distribution of SCD-related stays for Black patients by community-level income, location, and region of residence, compared with Black residents in the U.S. population, 2016
Abbreviation: SCD, sickle cell disease Bar chart that shows the percentage of sickle cell disease-related stays for Black patients by community-level income, metro location, and census region of residence, compared with Black residents in the U.S population in 2016. Data are provided in Supplemental Table 3.
|
Table 2 presents the Major Diagnostic Category for inpatient stays with a secondary diagnosis of SCD in 2016. |
| Table 2. Reasons for stays with a secondary diagnosis of SCD, 2016 | |||
| Rank | Major Diagnostic Category | N | % |
|---|---|---|---|
| 1 | Diseases and disorders of the respiratory system | 5,500 | 14.3 |
| 2 | Infectious and parasitic diseases | 5,100 | 13.2 |
| 3 | Pregnancy, childbirth and the puerperium | 4,900 | 12.8 |
| 4 | Diseases and disorders of the circulatory system | 3,900 | 10.1 |
| 5 | Diseases and disorders of the digestive system | 2,600 | 6.9 |
| Abbreviation: SCD, sickle cell disease Note: The number of stays is rounded to the nearest hundred. Percentages are based on unrounded values. Source: Agency for Healthcare Research and Quality (AHRQ), Healthcare Cost and Utilization Project (HCUP), National Inpatient Sample (NIS), 2016 | |||
Resource use and readmission rates among stays for patients with SCD, 2016 Figure 4 displays aggregate costs and mean length of stay for inpatient stays for patients with a principal diagnosis of SCD in 2016, by age group. The figure also shows the 30-day all-cause readmission rate following the index stay for patients with a principal diagnosis of SCD. |
|
Figure 4. Costs, length of stay, and readmissions among stays for patients with a principal SCD diagnosis, by age group, 2016
Abbreviation: SCD, sickle cell disease; y, years Three bar charts that show aggregate costs, mean length of stay, and 30-day all-cause readmission rate by age group among stays for patients with a principal sickle cell disease diagnosis in 2016. Data are provided in Supplemental Table 4.
|
Table 3 displays the all-cause 30-day readmission rates following initial (i.e., index) inpatient stays among patients with and without SCD in 2016. Readmission rates are provided for each of the patient and hospital characteristics based on the index stay. |
| Table 3. All-cause readmission rates following inpatient stays with and without a diagnosis of SCD, 2016 | |||||
| Characteristic at index stay | Any SCD diagnosis at index stay | No diagnosis of SCD at index stay | |||
|---|---|---|---|---|---|
| Total | Principal diagnosis | Secondary diagnosis | |||
| With a pain crisis | Without a pain crisis | ||||
| All stays | 31.1 | 33.5 | 32.9 | 21.0 | 12.5 |
| Age, years | |||||
| <18 | 18.7 | 20.1 | 16.2 | 14.6 | 4.5 |
| 18-34 | 37.2 | 39.4 | 37.4 | 22.5 | 7.8 |
| 35-44 | 32.7 | 35.2 | 31.0 | 24.0 | 12.3 |
| 45-64 | 30.1 | 32.7 | 30.3 | 25.3 | 15.9 |
| 65+ | 21.6 | 22.6 | 29.3 | 20.6 | 15.9 |
| Sex | |||||
| Male | 31.4 | 33.9 | 28.4 | 21.8 | 14.2 |
| Female | 30.9 | 33.3 | 35.4 | 20.5 | 11.2 |
| Admitted from the ED | |||||
| Yes | 32.2 | 34.0 | 32.1 | 23.0 | 16.4 |
| No | 26.2 | 30.4 | 36.0 | 17.4 | 7.8 |
| Discharge disposition | |||||
| Home or home health care | 30.7 | 33.1 | 32.3 | 20.2 | 11.3 |
| Other hospital | 30.3 | 33.5 | 32.8 | 27.6 | 18.5 |
| Against medical advice | 46.6 | 48.5 | 49.1 | 35.0 | 26.5 |
| Primary expected payer | |||||
| Medicare, 65+ years | 21.2 | 20.6 | 27.5 | 21.0 | 16.1 |
| Medicare, <65 years | 37.3 | 38.9 | 36.4 | 29.8 | 21.0 |
| Medicaid | 31.7 | 34.1 | 35.0 | 20.3 | 11.1 |
| Private insurance | 23.5 | 26.0 | 25.6 | 14.6 | 7.9 |
| Self-pay/no chargea | 22.4 | 24.7 | 14.3 | 19.8 | 10.8 |
| Other payersb | 30.8 | 33.7 | 28.9 | 23.3 | 9.8 |
| Community-level income | |||||
| Quartile 1 (lowest) | 32.6 | 35.1 | 33.3 | 22.4 | 13.9 |
| Quartile 2 | 31.2 | 33.9 | 32.7 | 19.8 | 12.5 |
| Quartile 3 | 28.6 | 30.6 | 33.1 | 19.0 | 11.8 |
| Quartile 4 (highest) | 27.4 | 29.0 | 30.7 | 20.7 | 11.0 |
| Location of patient residence | |||||
| Metro area | 31.3 | 33.7 | 33.1 | 21.1 | 12.6 |
| Rural, adjacent to metro area | 29.4 | 31.5 | 30.5 | 20.6 | 12.3 |
| Rural, remote area | 29.5 | 32.7 | 32.0 | 15.8 | 11.3 |
| Hospital census region | |||||
| Northeast | 31.6 | 34.5 | 31.4 | 20.7 | 13.0 |
| Midwest | 31.9 | 34.2 | 37.8 | 20.7 | 12.3 |
| South | 30.8 | 33.2 | 31.9 | 20.7 | 12.8 |
| West | 31.2 | 32.8 | 33.9 | 24.1 | 11.6 |
| Abbreviation: SCD, sickle cell disease; ED, emergency department Note: Other discharge dispositions and missing data categories are not shown (i.e., less than 2 percent for age, sex, discharge disposition, expected payer, community-level income, and location of residence). a Self-pay/no charge: includes self-pay, no charge, charity, and no expected payment. b Other payers include Federal and local government programs (see Definitions section) and Workers' Compensation. Source: Agency for Healthcare Research and Quality (AHRQ), Healthcare Cost and Utilization Project (HCUP), Nationwide Readmissions Database (NRD), 2016 | |||||
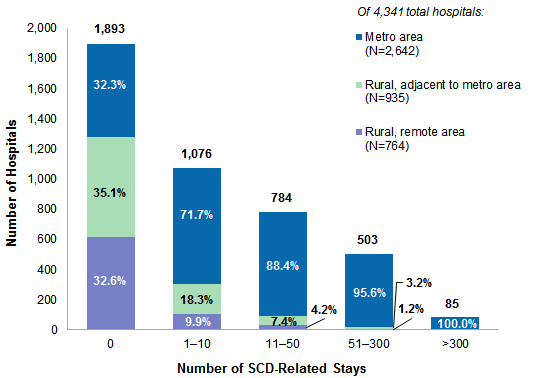
In Figure 5, community hospitals are categorized according to their annual number of SCD-related inpatient stays in 2016. These hospitals are then described in terms of their location. Figure 5 is based on an analysis of 4,341 hospitals across 46 States and the District of Columbia in 2016. |
|
Figure 5. Hospital location, by annual number of stays with SCD, 2016
Abbreviation: SCD, sickle cell disease Bar chart that shows the annual number of stays with sickle cell disease in metro areas. In rural areas adjacent to a metro area, and in rural, remote areas in 2016. Data are provided in Supplemental Table 5.
|
|
|
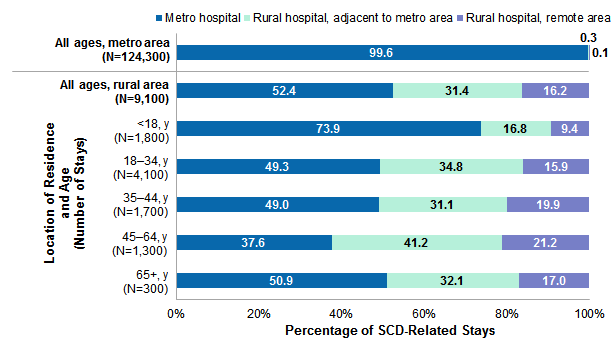
Figure 6. The percentage of SCD-related stays at hospitals in metropolitan and rural areas, by location of patient residence and age, 2016
Abbreviations: SCD, sickle cell disease; y, years Bar chart that shows the percentage of stays related to sickle cell disease in metropolitan and rural areas by location of patient residence and by age group in 2016. Data are provided in Supplemental Table 6.
|
|
About Statistical Briefs
Healthcare Cost and Utilization Project (HCUP) Statistical Briefs provide basic descriptive statistics on a variety of topics using HCUP administrative health care data. Topics include hospital inpatient, ambulatory surgery, and emergency department use and costs, quality of care, access to care, medical conditions, procedures, and patient populations, among other topics. The reports are intended to generate hypotheses that can be further explored in other research; the reports are not designed to answer in-depth research questions using multivariate methods. Data Source The estimates in this Statistical Brief are based upon data from the HCUP 2016 National Inpatient Sample (NIS), the 2016 Nationwide Readmissions Database (NRD), and the 2016 State Inpatient Databases (SID). Historical data were drawn from the 2000-2014 National (Nationwide) Inpatient Sample (NIS). Supplemental sources included population denominator data for use with HCUP databases, derived from Claritas, a vendor that produces population estimates and projections based on data from the U.S. Census Bureau.19 Definitions Diagnoses, ICD-9-CM, ICD-10-CM, and Major Diagnostic Categories (MDCs) The principal diagnosis is that condition established after study to be chiefly responsible for the patient's admission to the hospital (i.e., referred to as stays for sickle cell disease [SCD] or stays principally for SCD). Secondary diagnoses are concomitant conditions that coexist at the time of admission or develop during the stay (i.e., referred to as stays with a secondary SCD diagnosis on the record). All-listed diagnoses include the principal diagnosis plus these additional secondary conditions (i.e., referred to as SCD-related stays or stays that involved SCD or stays for patients with SCD). ICD-9-CM is the International Classification of Diseases, Ninth Revision, Clinical Modification, which assigns numeric codes to diagnoses. There are approximately 14,000 ICD-9-CM diagnosis codes. ICD-10-CM is the International Classification of Diseases, Tenth Revision, Clinical Modification Coding System. In October 2015, ICD-10-CM replaced the ICD-9-CM diagnosis coding system for most inpatient and outpatient medical encounters. There are over 70,000 ICD-10-CM diagnosis codes. Major Diagnosis Categories (MDCs) assign ICD-9-CM and ICD-10-CM principal and secondary diagnosis codes to categories 1 through 23; only the principal diagnosis code is used to assign MDC's 24 or 25.20 Case definition The ICD-9-CM and ICD-10-CM codes defining sickle cell disease include the codes listed in Table 4. Sickle cell trait is not included in the definition of sickle cell disease in this Brief. |
| Table 4. Definition of sickle cell disease | ||
| ICD-9-CM code | Description | Presence of crisis |
|---|---|---|
| 282.42 | Sickle-cell thalassemia with crisis | With crisis |
| 282.62 | Hb-SS disease with crisis | With crisis |
| 282.64 | Sickle-cell/Hb-C disease with crisis | With crisis |
| 282.69 | Other sickle-cell disease with crisis | With crisis |
| 282.41 | Sickle-cell thalassemia without crisis | Without crisis |
| 282.60 | Sickle-cell disease, unspecified | Without crisis |
| 282.61 | Hb-SS disease without crisis | Without crisis |
| 282.63 | Sickle-cell/Hb-C disease without crisis | Without crisis |
| 282.68 | Other sickle-cell disease without crisis | Without crisis |
| ICD-10-CM code | Description | Presence of crisis |
| D57.00 | Hb-SS disease with crisis, unspecified | With crisis |
| D57.01 | Hb-SS disease with acute chest syndrome | With crisis |
| D57.02 | Hb-SS disease with splenic sequestration | With crisis |
| D57.211 | Sickle-cell/Hb-C disease with acute chest syndrome | With crisis |
| D57.212 | Sickle-cell/Hb-C disease with splenic sequestration | With crisis |
| D57.219 | Sickle-cell/Hb-C disease with crisis, unspecified | With crisis |
| D57.411 | Sickle-cell thalassemia with acute chest syndrome | With crisis |
| D57.412 | Sickle-cell thalassemia with splenic sequestration | With crisis |
| D57.419 | Sickle-cell thalassemia with crisis, unspecified | With crisis |
| D57.811 | Other sickle-cell disorders with acute chest syndrome | With crisis |
| D57.812 | Other sickle-cell disorders with splenic sequestration | With crisis |
| D57.819 | Other sickle-cell disorders with crisis, unspecified | With crisis |
| D57.1 | Sickle-cell disease without crisis | Without crisis |
| D57.20 | Sickle-cell/Hb-C disease without crisis | Without crisis |
| D57.40 | Sickle-cell thalassemia without crisis | Without crisis |
| D57.80 | Other sickle-cell disorders without crisis | Without crisis |
| Abbreviations: Hb-C, hemoglobin C; Hb-SS, hemoglobin sickle cell | ||
In Figure 1, the definition of sickle cell disease was based on all-listed diagnoses. The number of diagnosis fields available in the NIS increased from 15 in 2000 to 30 in 2014 and 2016.
Readmissions The 30-day readmission rate is defined as the number of admissions for which there was at least one subsequent hospital admission within 30 days, divided by the total number of admissions from January through November of the same year. That is, when patients are discharged from the hospital, if that same patient is admitted to the same or a different hospital during the 30-day period (for any cause) then the admission is counted as a readmission. No more than one readmission is counted within the 30-day period, because the outcome measure assessed is "percentage of admissions that are readmitted." If a patient was transferred to a different hospital on the same day or was transferred within the same hospital, the two events were combined as a single stay and the second event was not counted as a readmission; that is, transfers were not considered a readmission. Every qualifying hospital stay is counted as a separate initial (starting point) admission, or an index stay. Thus, a single patient can be counted multiple times during the course of the January through November observation period. In addition, initial admissions do not require a prior "clean period" with no hospitalizations; that is, a hospital stay may be a readmission for a prior stay and the initial admission for a subsequent readmission. Admissions were disqualified from the analysis as initial admissions if they could not be followed for 30 days for one of the following reasons: (1) the patient died in the hospital, (2) information on length of stay was missing, or (3) the patient was discharged in December. Types of hospitals included in the HCUP National (Nationwide) Inpatient Sample The National (Nationwide) Inpatient Sample (NIS) is based on data from community hospitals, which are defined as short-term, non-Federal, general, and other hospitals, excluding hospital units of other institutions (e.g., prisons). The NIS includes obstetrics and gynecology, otolaryngology, orthopedic, cancer, pediatric, public, and academic medical hospitals. Excluded are long-term care facilities such as rehabilitation, psychiatric, and alcoholism and chemical dependency hospitals. Beginning in 2012, long-term acute care hospitals are also excluded. However, if a patient received long-term care, rehabilitation, or treatment for a psychiatric or chemical dependency condition in a community hospital, the discharge record for that stay will be included in the NIS. Types of hospitals included in the HCUP Nationwide Readmissions Database The Nationwide Readmissions Database (NRD) is based on data from community hospitals, which are defined as short-term, non-Federal, general, and other hospitals, excluding hospital units of other institutions (e.g., prisons). The NRD includes obstetrics and gynecology, otolaryngology, orthopedic, cancer, pediatric, public, and academic medical hospitals. Excluded are long-term care facilities such as rehabilitation, long-term acute care, psychiatric, and alcoholism and chemical dependency hospitals. However, if a patient received long-term care, rehabilitation, or treatment for a psychiatric or chemical dependency condition in a community hospital, the discharge record for that stay will be included in the NRD. Types of hospitals included in HCUP State Inpatient Databases This analysis used State Inpatient Databases (SID) limited to data from community hospitals, which are defined as short-term, non-Federal, general, and other hospitals, excluding hospital units of other institutions (e.g., prisons). Community hospitals include obstetrics and gynecology, otolaryngology, orthopedic, cancer, pediatric, public, and academic medical hospitals. Excluded for this analysis are long-term care facilities such as rehabilitation, psychiatric, and alcoholism and chemical dependency hospitals. However, if a patient received long-term care, rehabilitation, or treatment for a psychiatric or chemical dependency condition in a community hospital, the discharge record for that stay was included in the analysis. Unit of analysis The unit of analysis is the hospital discharge (i.e., the hospital stay), not a person or patient. This means that a person who is admitted to the hospital multiple times in 1 year will be counted each time as a separate discharge from the hospital. Costs and charges Total hospital charges were converted to costs using HCUP Cost-to-Charge Ratios based on hospital accounting reports from the Centers for Medicare & Medicaid Services (CMS).21 Costs reflect the actual expenses incurred in the production of hospital services, such as wages, supplies, and utility costs; charges represent the amount a hospital billed for the case. For each hospital, a hospital-wide cost-to-charge ratio is used. Hospital charges reflect the amount the hospital billed for the entire hospital stay and do not include professional (physician) fees. For the purposes of this Statistical Brief, costs are reported to the nearest hundred. How HCUP estimates of costs differ from National Health Expenditure Accounts There are a number of differences between the costs cited in this Statistical Brief and spending as measured in the National Health Expenditure Accounts (NHEA), which are produced annually by CMS.22 The largest source of difference comes from the HCUP coverage of inpatient treatment only in contrast to the NHEA inclusion of outpatient costs associated with emergency departments and other hospital-based outpatient clinics and departments as well. The outpatient portion of hospitals' activities has been growing steadily and may exceed half of all hospital revenue in recent years. On the basis of the American Hospital Association Annual Survey, 2014 outpatient gross revenues (or charges) were about 46 percent of total hospital gross revenues.23 Smaller sources of differences come from the inclusion in the NHEA of hospitals that are excluded from HCUP. These include Federal hospitals (Department of Defense, Veterans Administration, Indian Health Services, and Department of Justice [prison] hospitals) as well as psychiatric, substance abuse, and long-term care hospitals. A third source of difference lies in the HCUP reliance on billed charges from hospitals to payers, adjusted to provide estimates of costs using hospital-wide cost-to-charge ratios, in contrast to the NHEA measurement of spending or revenue. HCUP costs estimate the amount of money required to produce hospital services, including expenses for wages, salaries, and benefits paid to staff as well as utilities, maintenance, and other similar expenses required to run a hospital. NHEA spending or revenue measures the amount of income received by the hospital for treatment and other services provided, including payments by insurers, patients, or government programs. The difference between revenues and costs include profit for for-profit hospitals or surpluses for nonprofit hospitals. Reporting of race and ethnicity Data on Hispanic ethnicity are collected differently among the States and also can differ from the census methodology of collecting information on race (White, Black, Asian/Pacific Islander, American Indian/Alaska Native, Other [including mixed race]) separately from ethnicity (Hispanic, non-Hispanic). State data organizations often collect Hispanic ethnicity as one of several categories that include race. Therefore, for multistate analyses, HCUP creates the combined categorization of race and ethnicity for data from States that report ethnicity separately. When a State data organization collects Hispanic ethnicity separately from race, HCUP uses Hispanic ethnicity to override any other race category to create a Hispanic category for the uniformly coded race/ethnicity data element, while also retaining the original race and ethnicity data. This Statistical Brief reports race/ethnicity for the following categories: Hispanic, non-Hispanic White, non-Hispanic Black, and non-Hispanic Other, including Asian/Pacific Islander and American Indian/Alaska Native. As noted in HCUP Methods Series: Missing Data Methods for the NIS and the SID Report # 2015-01,24 race/ethnicity is systematically missing from the NIS for a portion of the discharges (5.0 percent of discharges in 2016). To determine whether there was a bias in the distribution of race/ethnicity, the estimates of SCD-related hospital stays by race/ethnicity using the 2016 NIS were compared to the estimates of SCD-related hospital stays by race/ethnicity using an analytic file of a weighted sample of hospitals with nonmissing race/ethnicity data from the HCUP State Inpatient Databases (SID). This analytic file is also used for the National Healthcare Quality and Disparities Report (NHQR/NHDR). In the 2016 NIS, used for Table 1 and Figure 2, the distribution of race/ethnicity across all stays was as follows: Black, 14.4 percent; Hispanic, 11.6 percent; White, 62.0 percent; Other, 6.8 percent; missing, 5.1 percent. The race/ethnicity distribution across all SCD-related stays was as follows: Black, 87.5 percent; Hispanic, 3.9 percent; White, 1.7 percent; Other, 3.0 percent; missing, 3.9 percent. In the 2016 NHQR/NHDR, the distribution of race/ethnicity across all stays was as follows: Black, 15.2 percent; Hispanic, 12.1 percent; White, 64.6 percent; Other, 6.3 percent; missing, 1.8 percent. Using the NHQR/NHDR, the race/ethnicity distribution across SCD-related stays was as follows: Black, 91.8 percent; Hispanic, 3.6 percent; White, 1.7 percent; Other, 2.3 percent; missing, 0.6 percent. Hospital location and location of patient's residence Hospital location and place of residence are based on the rural-urban continuum codes (RUCC) for U.S. counties developed by the United States Department of Agriculture (USDA).25 For this Statistical Brief, we collapsed the RUCC categories into the following categories: Metro:
Community-level income is based on the median household income of the patient's ZIP Code of residence. Quartiles are defined so that the total U.S. population is evenly distributed. Cut-offs for the quartiles are determined annually using ZIP Code demographic data obtained from Claritas, a vendor that produces population estimates and projections based on data from the U.S. Census Bureau.26 The value ranges for the income quartiles vary by year. The income quartile is missing for patients who are homeless or foreign. Expected payer To make coding uniform across all HCUP data sources, expected payer for the hospital stay combines detailed categories into general groups:
Hospital stays billed to the State Children's Health Insurance Program (SCHIP) may be classified as Medicaid or Other, depending on the structure of the State program. Because most State data do not identify SCHIP as a separate expected payer, it is not possible to present this information separately. For this Statistical Brief, when more than one payer is listed for a hospital discharge, the first-listed payer is used. Region Region is one of the four regions defined by the U.S. Census Bureau:
Admission source or point of origin Admission source (now known as the patient's point of origin) indicates where the patient was located prior to admission to the hospital. Emergency admission indicates that the patient was admitted to the hospital through the emergency department. Discharge status Discharge status reflects the disposition of the patient at discharge from the hospital and includes the following four categories: routine (to home) or to home health care; transfer to another short-term hospital or other transfers (including skilled nursing facility, intermediate care, and another type of facility such as a nursing home); against medical advice (AMA); or died in the hospital. About HCUP The Healthcare Cost and Utilization Project (HCUP, pronounced "H-Cup") is a family of health care databases and related software tools and products developed through a Federal-State-Industry partnership and sponsored by the Agency for Healthcare Research and Quality (AHRQ). HCUP databases bring together the data collection efforts of State data organizations, hospital associations, and private data organizations (HCUP Partners) and the Federal government to create a national information resource of encounter-level health care data. HCUP includes the largest collection of longitudinal hospital care data in the United States, with all-payer, encounter-level information beginning in 1988. These databases enable research on a broad range of health policy issues, including cost and quality of health services, medical practice patterns, access to health care programs, and outcomes of treatments at the national, State, and local market levels. HCUP would not be possible without the contributions of the following data collection Partners from across the United States: Alaska Department of Health and Social Services Alaska State Hospital and Nursing Home Association Arizona Department of Health Services Arkansas Department of Health California Office of Statewide Health Planning and Development Colorado Hospital Association Connecticut Hospital Association Delaware Division of Public Health District of Columbia Hospital Association Florida Agency for Health Care Administration Georgia Hospital Association Hawaii Health Information Corporation Illinois Department of Public Health Indiana Hospital Association Iowa Hospital Association Kansas Hospital Association Kentucky Cabinet for Health and Family Services Louisiana Department of Health Maine Health Data Organization Maryland Health Services Cost Review Commission Massachusetts Center for Health Information and Analysis Michigan Health & Hospital Association Minnesota Hospital Association Mississippi State Department of Health Missouri Hospital Industry Data Institute Montana Hospital Association Nebraska Hospital Association Nevada Department of Health and Human Services New Hampshire Department of Health & Human Services New Jersey Department of Health New Mexico Department of Health New York State Department of Health North Carolina Department of Health and Human Services North Dakota (data provided by the Minnesota Hospital Association) Ohio Hospital Association Oklahoma State Department of Health Oregon Association of Hospitals and Health Systems Oregon Office of Health Analytics Pennsylvania Health Care Cost Containment Council Rhode Island Department of Health South Carolina Revenue and Fiscal Affairs Office South Dakota Association of Healthcare Organizations Tennessee Hospital Association Texas Department of State Health Services Utah Department of Health Vermont Association of Hospitals and Health Systems Virginia Health Information Washington State Department of Health West Virginia Department of Health and Human Resources, West Virginia Health Care Authority Wisconsin Department of Health Services Wyoming Hospital Association About the NIS The HCUP National (Nationwide) Inpatient Sample (NIS) is a nationwide database of hospital inpatient stays. The NIS is nationally representative of all community hospitals (i.e., short-term, non-Federal, nonrehabilitation hospitals). The NIS includes all payers. It is drawn from a sampling frame that contains hospitals comprising more than 95 percent of all discharges in the United States. The vast size of the NIS allows the study of topics at the national and regional levels for specific subgroups of patients. In addition, NIS data are standardized across years to facilitate ease of use. Over time, the sampling frame for the NIS has changed; thus, the number of States contributing to the NIS varies from year to year. The NIS is intended for national estimates only; no State-level estimates can be produced. The unweighted sample size for the 2016 NIS is 7,135,090 (weighted, this represents 35,675,421 inpatient stays). The unweighted sample size for the 2000 NIS is 7,450,992 (weighted, this represents 36,417,565 inpatient stays). About the NRD The HCUP Nationwide Readmissions Database (NRD) is a calendar-year, discharge-level database constructed from the HCUP State Inpatient Databases (SID) with verified patient linkage numbers that can be used to track a person across hospitals within a State. The 2016 NRD is available for purchase through the HCUP Central Distributor. The NRD is designed to support various types of analyses of national readmission rates. The database includes discharges for patients with and without repeat hospital visits in a year and those who have died in the hospital. Repeat stays may or may not be related. The criteria to determine the relationship between hospital admissions are left to the analyst using the NRD. The NRD was constructed as a sample of convenience consisting of 100 percent of the eligible discharges. Discharge weights for national estimates are developed using the target universe of community hospitals (excluding rehabilitation and long-term acute care hospitals) in the United States. Over time, the sampling frame for the NRD will change; thus, the number of States contributing to the NRD will vary from year to year. The NRD is intended for national estimates only; no regional, State-, or hospital-specific estimates can be produced. The unweighted sample size for the 2016 NRD is 17,197,683 (weighted, this represents 35,660,906 inpatient stays). About the SID The HCUP State Inpatient Databases (SID) are hospital inpatient databases from data organizations participating in HCUP. The SID contain the universe of the inpatient discharge abstracts in the participating HCUP States, translated into a uniform format to facilitate multistate comparisons and analyses. Together, the SID encompass more than 95 percent of all U.S. community hospital discharges. The SID can be used to investigate questions unique to one State, to compare data from two or more States, to conduct market-area variation analyses, and to identify State-specific trends in inpatient care utilization, access, charges, and outcomes. For More Information For other information on blood or hematology conditions, refer to the HCUP Statistical Briefs located at www.hcup-us.ahrq.gov/reports/statbriefs/sb_blood.jsp. For additional HCUP statistics, visit:
For a detailed description of HCUP and more information on the design of the National Inpatient Sample (NIS), the Nationwide Readmissions Databases (NRD), and the State Inpatient Databases (SID), please refer to the following database documentation: Agency for Healthcare Research and Quality. Overview of the National (Nationwide) Inpatient Sample (NIS). Healthcare Cost and Utilization Project (HCUP). Rockville, MD: Agency for Healthcare Research and Quality. Updated August 2018. www.hcup-us.ahrq.gov/nisoverview.jsp. Accessed January 4, 2019. Agency for Healthcare Research and Quality. Overview of the Nationwide Readmissions Database (NRD). Healthcare Cost and Utilization Project (HCUP). Rockville, MD: Agency for Healthcare Research and Quality. Updated August 2018. www.hcup-us.ahrq.gov/nrdoverview.jsp. Accessed January 4, 2019. Agency for Healthcare Research and Quality. Overview of the State Inpatient Databases (SID). Healthcare Cost and Utilization Project (HCUP). Rockville, MD: Agency for Healthcare Research and Quality. Updated July 2018. www.hcup-us.ahrq.gov/sidoverview.jsp. Accessed January 4, 2019. Suggested Citation Fingar KR (IBM Watson Health), Owens PL (AHRQ), Reid LD (AHRQ), Mistry K (AHRQ), Barrett ML (M.L. Barrett, Inc.). Characteristics of Inpatient Hospital Stays Involving Sickle Cell Disease, 2000-2016. HCUP Statistical Brief #251. September 2019. Agency for Healthcare Research and Quality, Rockville, MD. www.hcup-us.ahrq.gov/reports/statbriefs/sb251-Sickle-Cell-Disease-Stays-2016.pdf. Acknowledgments The authors would like to acknowledge the contributions of Minya Sheng of IBM Watson Health. *** AHRQ welcomes questions and comments from readers of this publication who are interested in obtaining more information about access, cost, use, financing, and quality of health care in the United States. We also invite you to tell us how you are using this Statistical Brief and other HCUP data and tools, and to share suggestions on how HCUP products might be enhanced to further meet your needs. Please e-mail us at hcup@ahrq.gov or send a letter to the address below:Joel W. Cohen, Ph.D., Director Center for Financing, Access and Cost Trends Agency for Healthcare Research and Quality 5600 Fishers Lane Rockville, MD 20857 This Statistical Brief was posted online on September 3, 2019. 1 American Society of Hematology. Sickle Cell Disease. www.hematology.org/Patients/Anemia/Sickle-Cell.aspx. 2 Centers for Disease Control and Prevention. Data & Statistics on Sickle Cell Disease. www.cdc.gov/ncbddd/sicklecell/data.html. Accessed May 7, 2019. 3 Ibid. 4 Centers for Disease Control and Prevention. What You Should Know About Sickle Cell Disease CDC Fact Sheet. www.cdc.gov/ncbddd/sicklecell/documents/SCD-factsheet_What-is-SCD.pdf. Accessed August 15, 2019. 5 Ibid. 6 Centers for Disease Control and Prevention. Complications and Treatment of Sickle Cell Disease. www.cdc.gov/ncbddd/sicklecell/treatments.html. Accessed August 15, 2019. 7 Ibid. 8 Centers for Disease Control and Prevention. What You Should Know About Sickle Cell Disease CDC Fact Sheet. Op cit. 9 American Society of Hematology. Sickle Cell Disease. www.hematology.org/Patients/Anemia/Sickle-Cell.aspx. 10 Quinn CT, Rogers ZR, McCavit TL, Buchanan GR. Improved survival of children and adolescents with sickle cell disease. Blood. 2010;115:3447-52. 11 Lanzkron S, Carroll CP, Haywood C. Mortality rates and age at death from sickle cell disease: U.S., 1979-2005. Public Health Reports. 2013;128(2):110-6. 12 Ibid. 13 Hulihan M, Hassell KL, Raphael JL, Smith-Whitley K, Thorpe P. CDC grand rounds: improving the lives of persons with sickle cell disease. Morbidity and Mortality Weekly Report. 2017;66:1269-71. 14 American Society of Hematology. Sickle Cell Disease. www.hematology.org/Patients/Anemia/Sickle-Cell.aspx. 15 Centers for Disease Control and Prevention. Complications and Treatment of Sickle Cell Disease. www.cdc.gov/ncbddd/sicklecell/treatments.html. Accessed August 15, 2019. 16 Elander J, Beach MC, Haywood Jr C. Respect, trust, and the management of sickle cell disease pain in hospital: comparative analysis of concern-raising behaviors, preliminary model, and agenda for international collaborative research to inform practice. Ethnicity & Health. 2011;16(4-5):405-21. 17 U.S. Department of Health and Human Services Office of Minority Health. About Sickle Cell Disease. www.minorityhealth.hhs.gov/sicklecell/index.html. Accessed June 19, 2019. 18 Self-pay/no charge: includes self-pay, no charge, charity, and no expected payment. 19 Claritas. Claritas Demographic Profile by ZIP Code. https://claritas360.claritas.com/mybestsegments/. 20 Centers for Medicare and Medicaid Services. ICD-10-CM/PCS MS-DRG v36.0 Definitions Manual. www.cms.gov/icd10m/version36-fullcode-cms/fullcode_cms/P0001.html. Accessed October 27, 2021. 21 Agency for Healthcare Research and Quality. HCUP Cost-to-Charge Ratio (CCR) Files. Healthcare Cost and Utilization Project (HCUP). 2001-2015. Agency for Healthcare Research and Quality. Updated September 2018. www.hcup-us.ahrq.gov/db/state/costtocharge.jsp. Accessed January 4, 2019. 22 For additional information about the NHEA, see Centers for Medicare & Medicaid Services (CMS). National Health Expenditure Data. CMS Web site. Updated April 2018. www.cms.gov/Research-Statistics-Data-and-Systems/Statistics-Trends-and-Reports/NationalHealthExpendData/index.html?redirect=/NationalHealthExpendData/. Accessed January 4, 2019. 23 American Hospital Association. TrendWatch Chartbook, 2016. Table 4.2. Distribution of Inpatient vs. Outpatient Revenues, 1994-2014. www.aha.org/system/files/2018-01/2016-chartbook.pdf. 24 Houchens R. Missing Data Methods for the NIS and the SID. 2015. HCUP Methods Series Report #2015-01 ONLINE. January 22, 2015. U.S. Agency for Healthcare Research and Quality. www.hcup-us.ahrq.gov/reports/methods/methods.jsp. Accessed June 26, 2019. 25 United States Department of Agriculture. Rural-Urban Continuum Codes. www.ers.usda.gov/data-products/rural-urban-continuum-codes/. Accessed June 26, 2019. 26 Claritas. Claritas Demographic Profile by ZIP Code. https://claritas360.claritas.com/mybestsegments/. Accessed January 4, 2019. |
| Supplemental Table 1. Number of inpatient hospital stays among patients with SCD, by age in years, 2000-2016, for data presented in Figure 1 | |||||||||
| Age, years | Number of stays with SCD per 100,000 population | ||||||||
|---|---|---|---|---|---|---|---|---|---|
| 2000 | 2002 | 2004 | 2006 | 2008 | 2010 | 2012 | 2014 | 2016 | |
| <18 | 26,900 | 30,300 | 28,800 | 27,000 | 24,800 | 32,500 | 27,500 | 26,900 | 25,700 |
| 18-34 | 46,300 | 42,400 | 50,100 | 51,100 | 50,000 | 64,800 | 63,100 | 65,100 | 67,900 |
| 35-44 | 19,200 | 17,200 | 17,400 | 17,900 | 15,700 | 18,000 | 18,000 | 18,500 | 19,700 |
| 45-64 | 8,000 | 9,600 | 11,400 | 12,800 | 13,100 | 15,000 | 14,900 | 15,900 | 17,700 |
| 65+ | 1,000 | 1,000 | 1,400 | 1,400 | 1,300 | 1,800 | 2,100 | 2,600 | 2,900 |
| Supplemental Table 2. SCD-related stays by age group, 2016, for data presented in Figure 2 | |||
| Age, years | Principal diagnosis of SCD | Secondary diagnosis of SCD with pain crisis | Secondary diagnosis of SCD without pain crisis |
|---|---|---|---|
| <18 | 70.6 | 4.9 | 24.5 |
| 18-34 | 77.7 | 11.0 | 11.2 |
| 35-44 | 71.2 | 10.7 | 18.1 |
| 45-64 | 56.8 | 12.0 | 31.2 |
| 65+ | 19.7 | 5.5 | 74.7 |
| Supplemental Table 3. Distribution of SCD-related stays for Black patients by community-level income, location, and region of residence, compared with Black residents in the U.S. population, 2016, for data presented in Figure 3 | ||
| Variable | Black SCD Stays | Black U.S. Population |
|---|---|---|
| Community income, % | ||
| Quartile 1 (lowest) | 52.5 | 46.2 |
| Quartile 2 | 21.8 | 22.0 |
| Quartile 3 | 15.3 | 18.6 |
| Quartile 4 (highest) | 9.1 | 13.2 |
| Location of patient residence, % | ||
| Metro area | 92.5 | 90.5 |
| Rural, adjacent to metro area | 5.1 | 6.8 |
| Rural, remote area | 2.1 | 2.7 |
| Census region, % | ||
| Northeast | 18.9 | 15.7 |
| Midwest | 19.3 | 17.6 |
| South | 53.4 | 58.0 |
| West | 8.1 | 8.7 |
| Supplemental Table 4. Costs, length of stay, and readmissions among stays for patients with a principal SCD diagnosis, by age group, 2016, for data presented in Figure 4 | ||||||
| Index | All ages | <18 | 18-34 | 35-44 | 45-64 | 65+ |
|---|---|---|---|---|---|---|
| Aggregate cost, $ | 811,400,000 | 154,000,000 | 435,300,000 | 126,500,000 | 90,800,000 | 4,700,000 |
| Mean length of stay, days | 5.0 | 3.9 | 5.2 | 5.5 | 5.3 | 5.0 |
| 30-day all-cause readmission rate | 33.5 | 20.1 | 39.4 | 35.2 | 32.7 | 22.6 |
| Supplemental Table 5. Hospital location, by annual number of stays with SCD, 2016, for data presented in Figure 5 | ||||||||||
| Hospital location | 0 SCD stays | 1-10 SCD stays | 11-50 SCD stays | 51-300 SCD stays | <300 SCD stays | |||||
|---|---|---|---|---|---|---|---|---|---|---|
| N | % | N | % | N | % | N | % | N | % | |
| Total | 1,893 | 1,076 | 784 | 503 | 85 | |||||
| Metro area (N=2,642) | 611 | 32.3 | 772 | 71.7 | 693 | 88.4 | 481 | 95.6 | 85 | 100.0 |
| Rural, adjacent to metro area (N=935) | 664 | 35.1 | 197 | 18.3 | 58 | 7.4 | 16 | 3.2 | 0 | 0.0 |
| Rural, remote area (N=764) | 618 | 32.6 | 107 | 9.9 | 33 | 4.2 | 6 | 1.2 | 0 | 0.0 |
| Supplemental Table 6. The percentage of SCD-related stays at hospitals in metropolitan and rural areas, by location of patient residence and age, 2016, for data presented in Figure 6 | |||
| Variable | Metro hospital | Rural hospital, adjacent to metro area | Rural hospital, remote area |
|---|---|---|---|
| All ages, metro area (N=124,300) | 99.6 | 0.3 | 0.1 |
| All ages, rural area (N=9,100) | 52.4 | 31.4 | 16.2 |
| Age, years, rural areas | |||
| <18 (N=1,800) | 73.9 | 16.8 | 9.4 |
| 18-34 (N=4,100) | 49.3 | 34.8 | 15.9 |
| 35-44 (N=1,700) | 49.0 | 31.1 | 19.9 |
| 45-64 (N=1,300) | 37.6 | 41.2 | 21.2 |
| 65+ (N=300) | 50.9 | 32.1 | 17.0 |
| Internet Citation: Statistical Brief #251. Healthcare Cost and Utilization Project (HCUP). August 2019. Agency for Healthcare Research and Quality, Rockville, MD. www.hcup-us.ahrq.gov/reports/statbriefs/sb251-Sickle-Cell-Disease-Stays-2016.jsp?utm_source=ahrq&utm_medium=en1&utm_term=Sickle_Cell&utm_content=1&utm_campaign=ahrq_en9_24_2019. |
| Are you having problems viewing or printing pages on this website? |
| If you have comments, suggestions, and/or questions, please contact hcup@ahrq.gov. |
| Privacy Notice, Viewers & Players |
| Last modified 8/22/19 |