HEALTHCARE COST & UTILIZATION PROJECT

User Support

Do Your own analysis
Explore Expert Research & Limited Datasets
STATISTICAL BRIEF #246


December 2018


Overview of U.S. Hospital Stays in 2016: Variation by Geographic Region


William J. Freeman, Dr.PH., M.P.H., Audrey J. Weiss, Ph.D., and Kevin C. Heslin, Ph.D.


Introduction

Geographic differences in healthcare utilization and costs in the United States have been well documented.1 For example, in the last Healthcare Cost and Utilization Project (HCUP) Statistical Brief overviewing U.S. hospital stays in 2012, substantial differences were reported by census region.2 In particular, the West had the lowest rate of hospitalizations (97.2 per 1,000 population vs. over 120 per 1,000 population in other regions) but the highest average cost of hospital stays ($12,300 vs. less than $11,000 in other regions).3 In another study using 2016 data, the rate of hospital admissions ranged from 186 per 1,000 population in the District of Columbia to 69 per 1,000 population in Alaska.4 Factors such as differences in patient health status, treatment preferences, physician practice patterns, access to and availability of services, and wages/cost of living may help explain these types of geographic variation.

This HCUP Statistical Brief presents statistics on hospital inpatient stays in 2016, with a focus on geographic variation based on the nine U.S. census divisions. The number and distribution of hospital stays are presented overall, along with the population rate, mean cost, and mean length of stay overall and by census division. For both the United States as a whole and for each census division, the rate of stays is presented by select patient characteristics (age, sex community-level income, and patient residence location) and the distribution of stays is provided by expected primary payer. Because of the large sample sizes, we focus on the size of differences between estimates rather than statistical significance.

Findings

Characteristics of hospital stays, 2016
Table 1 presents statistics on utilization and costs for hospital inpatient stays in 2016 by select patient characteristics.
Highlights
  • In 2016, there were 35.7 million hospital stays in the United States, with a rate of 104.2 stays per 1,000 population. The cost of these stays totaled over $417 billion with a mean cost per stay of $11,700.


  • Patients residing in the lowest income areas had the highest rate of stays (122.7 vs. 82.5 stays per 1,000 population in the highest income areas) but the lowest mean cost per stay ($11,000 vs. $12,900 for the highest income areas).


  • Stays varied substantially by census division:
    • The East South Central division had the highest rate of stays (121.3 per 1,000 population) but the lowest mean cost per stay ($9,900).
    • The Pacific division had the lowest rate of stays (87.3 per 1,000 population) but the highest mean cost per stay ($15,600).
    • The West North Central division had the highest rate of stays for children, and the East South Central division had the highest rate of stays for adults.
    • Rural areas had a higher rate of stays than metropolitan areas, with the highest rate among patients residing in rural areas in the East South Central division (142.9 per 1,000 population).
    • Uninsured stays ranged from 1.7 percent of stays in New England to 8.1 percent of stays in the West South Central division.


Table 1. Number, percentage, and rate of hospital stays, length of stay, and costs by patient characteristics, 2016
Characteristic Hospital stays Mean length of stay, days Costs
Number, thousands Percent Rate per 1,000 population Mean cost per stay, $ Aggregate cost, millions $
All hospital stays 35,700 100.0 104.2 4.6 11,700 417,426
Patient age, years
<1 4,200 11.8 210.8 3.9 5,900 24,535
1-17 1,300 3.6 17.1 4.2 12,500 15,759
18-44 8,700 24.4 75.4 3.8 8,600 74,527
45-64 8,800 24.6 104.3 5.1 14,500 127,082
65-84 9,900 27.7 232.5 5.2 14,500 143,373
85+ 2,800 7.8 455.7 5.1 11,300 32,026
Patient sex
Male 15,400 43.1 91.3 5.0 13,300 204,908
Female 20,200 56.6 116.6 4.3 10,500 212,252
Community-level income
Quartile 1 (lowest income) 10,800 30.3 122.7 4.8 11,000 118,270
Quartile 2 8,900 24.9 107.7 4.6 11,400 101,329
Quartile 3 8,400 23.5 96.3 4.5 11,900 99,668
Quartile 4 (highest income) 7,000 19.6 82.5 4.5 12,900 90,075
Patient residence
Large central metropolitan 10,700 30.0 100.7 4.7 12,300 130,938
Large fringe metropolitan 8,500 23.8 100.6 4.6 11,800 100,262
Medium metropolitan 7,400 20.7 103.1 4.6 11,100 82,067
Small metropolitan 3,300 9.2 104.1 4.5 11,200 36,435
Micropolitan 3,200 9.0 111.8 4.5 11,300 36,875
Noncore 2,400 6.7 122.7 4.6 11,600 28,412
Expected primary payer
Medicare 14,100 39.5 n/a 5.3 13,600 192,784
Medicaid 8,200 23.0 n/a 4.6 9,800 81,153
Private insurance 10,700 30.0 n/a 3.9 10,900 115,852
Uninsured 1,500 4.2 n/a 4.1 9,300 13,781
Other 1,100 3.1 n/a 4.6 12,600 13,354
Source: Agency for Healthcare Research and Quality (AHRQ), Center for Delivery, Organization, and Markets, Healthcare Cost and Utilization Project (HCUP), National Inpatient Sample (NIS), 2016


  • In 2016, there were about 35.7 million hospital stays with a mean length of stay of 4.6 days and a mean cost of $11,700 per stay.

    In 2016, there were approximately 35.7 million hospital stays in the United States, representing a hospitalization rate of 104.2 stays per 1,000 population. Overall, the mean length of stay was 4.6 days. Aggregate hospital costs were $417.4 billion, and the mean cost per stay was $11,700.


  • Although the rate of stays was highest among the oldest age group, the mean cost per stay for that age group was near the average across all age groups.

    The mean cost per stay was highest among patients aged 45-84 years ($14,500), followed by patients aged 1-17 years ($12,500). The lowest mean cost per stay was among infants ($5,900), followed by patients aged 18-44 years ($8,600) and those 85 years and older ($11,300).

    In contrast to mean costs, the rate of hospitalization consistently increased with patient age (excluding infants), from 17.1 per 1,000 population among patients aged 1-17 years to 455.7 per 1,000 population among patients aged 85 years and older. Infants had the third highest rate of stays of all age groups at 210.8 per 1,000 population.


  • Females had a higher rate of stays but a lower mean length of stay and mean cost per stay than did males.

    Compared with males, females had a higher rate of stays (116.6 vs. 91.3 stays per 1,000 population) but a shorter mean length of stay and lower mean costs (4.3 vs. 5.0 days and $10,500 vs. $13,300). It is important to note that maternal stays are included for females.


  • Patients residing in higher income areas had a lower rate of stays but a higher mean cost per stay than did patients residing in lower income areas.

    The rate of hospitalization decreased as community-level income increased (122.7 per 1,000 population for patients in the lowest income areas vs. 82.5 for patients in the highest income areas). However, the mean cost per stay increased as community-level income increased ($11,000 for patients in the lowest income areas vs. $12,900 for patients in the highest income areas).


  • Patients residing in noncore areas had the highest hospitalization rate.

    Patients residing in noncore areas had a higher rate of hospitalization (122.7 per 1,000 population) than did patients residing in more urbanized areas (e.g., 100.7 per 1,000 population in large central metropolitan areas).


  • Patients covered by Medicare had the longest mean length of stay and highest mean cost per stay.

    Compared with patients with other types of expected payers, patients with Medicare had the longest length of stay (5.3 days vs. 3.9-4.6 days for other payers) and the highest mean cost per stay ($13,600 vs. $9,300-$12,600 for other payers).
Geographic distribution of hospital inpatient stays, 2016
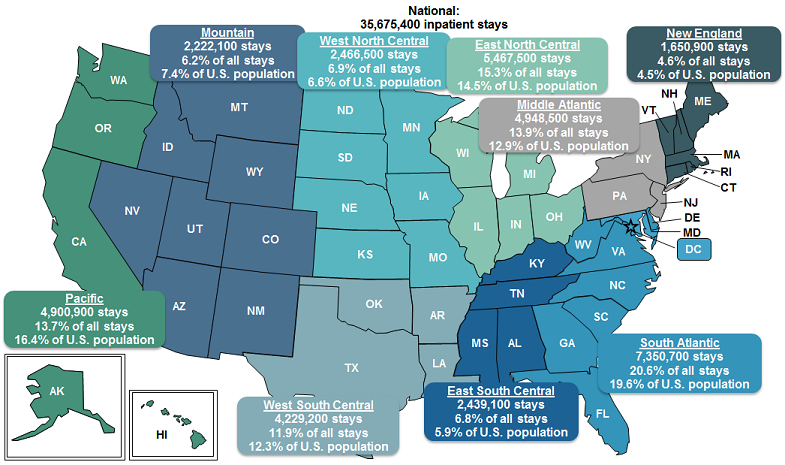
Figure 1 presents the total number and percentage of inpatient stays by U.S. census division in 2016.


Figure 1. Number and percentage of inpatient stays by U.S. census division, 2016

Figure 1 is a map of the United States illustrating the number of inpatient stays, the percentage of inpatient stays, and the percentage of the U.S. population in each U.S. census division in 2016.

Source: Agency for Healthcare Research and Quality (AHRQ), Center for Delivery, Organization, and Markets, Healthcare Cost and Utilization Project (HCUP), National Inpatient Sample (NIS), 2016

Map of the United States that shows the number of inpatient stays, the percentage of inpatient stays, and the percentage of the U.S. population in each U.S. census division in 2016. National: 35,675,400 stays. Pacific: 4,900,900 stays, 13.7% of all stays, 16.4% of U.S. population. Mountain: 2,222,100 stays, 6.2% of all stays, 7.4% of U.S. population. West North Central: 2,466,500 stays, 6.9% of all stays, 6.6% of U.S. population. East North Central: 5,467,500 stays, 15.3% of all stays, 14.5% of U.S. population. Middle Atlantic: 4,948,500 stays, 13.9% of all stays, 12.9% of U.S. population. New England: 1,650,900 stays, 4.6% of all stays, 4.5% of U.S. population. South Atlantic: 7,350,700 stays, 20.6% of all stays, 19.6% of U.S. population. East South Central: 2,439,100 stays, 6.8% of all stays, 5.9% of U.S. population. West South Central: 4,229,200 stays, 11.9% of all stays, 12.3% of U.S. population.


  • The East South Central division had a disproportionately higher share and the Pacific and Mountain divisions had a disproportionately lower share of hospital stays in 2016 relative to the U.S. population.

    Of the 35.7 million inpatient stays nationally in 2016, more than one-fifth occurred in the South Atlantic division (7.4 million stays, 20.6 percent), followed by the East North Central division (5.5 million stays, 15.3 percent). The fewest number of stays occurred in the New England division (1.7 million stays, 4.6 percent) and the Mountain division (2.2 million stays, 6.2 percent).

    The distribution of hospital stays by census division is similar to the overall distribution of the U.S. population for most divisions. However, the proportion of stays is notably higher in the East South Central division (6.8 percent of all hospital stays vs. 5.9 percent of the U.S. population) and lower in the Mountain division (6.2 percent of stays vs. 7.4 percent of the population) and Pacific division (13.7 percent of stays vs. 16.4 percent of the population).
Figure 2 provides the population rate, mean cost, and mean length of stay of inpatient stays by U.S. census division in 2016. The ratio of each census division value to the national value for each statistic also is provided and reflected in the color-coding of the map.


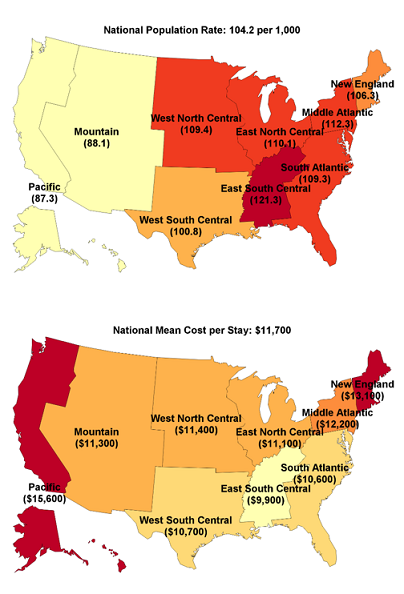
Figure 2. Population rate, mean cost, and mean length of stay of inpatient stays by U.S. census division, and ratio of census division rate to national rate, 2016

Figure 2 is three maps of the United States illustrating the rate of inpatient stays per 1,000 population, the mean cost per stay, and the mean length of stay in each U.S. census division in 2016. The maps are color coded to show ratios to the census division mean.

Figure 2 is three maps of the United States illustrating the rate of inpatient stays per 1,000 population, the mean cost per stay, and the mean length of stay in each U.S. census division in 2016. The maps are color coded to show ratios to the census division mean.


KEY FINDINGS BY MEASURE
  • Rate: The rate of stays was highest in the East South Central division (121.3 per 1,000 population) and lowest in the Pacific and Mountain divisions (87.3 and 88.1 per 1,000 population, respectively).

  • Cost: The mean cost per stay was highest in the Pacific and New England divisions ($15,600 and $13,100, respectively) and lowest in the East South Central division ($9,900).

  • Length of Stay: The mean length of stay ranged from 4.3 days in the Mountain division to 5.0 days in the Middle Atlantic. In general, the mean length of stay was higher in the southern and eastern parts of the United States and lower in the northern and western parts.


KEY FINDINGS BY DIVISION
  • Pacific division: Across all divisions, the Pacific division had the lowest rate of stays (87.3 per 1,000 population) but the highest mean cost per stay ($15,600).

  • East South Central division: Across all divisions, the East South Central division had the highest rate of stays (121.3 per 1,000 population) but the lowest mean cost per stay ($9,900).

Source: Agency for Healthcare Research and Quality (AHRQ), Center for Delivery, Organization, and Markets, Healthcare Cost and Utilization Project (HCUP), National Inpatient Sample (NIS), 2016

Three maps of the United States that show the rate of inpatient stays per 1,000 population, the mean cost per stay, and the mean length of stay in each U.S. census division in 2016. The maps are color coded to show ratios to the census division mean. Rate of inpatient stays per 1,000 population: National, 104.2; Pacific, 87.3; Mountain, 88.1; West North Central, 109.4; East North Central, 110.1; Middle Atlantic, 112.3; New England, 106.3; South Atlantic, 109.3; East South Central, 121.3; West South Central, 100.8. Ratio of census division mean to national mean: East South Central, >1.10; West North Central, East North Central, Middle Atlantic, and South Atlantic, 1.05-1.09; West South Central, 1.00-1.04; Mountain and Pacific, <0.90. Mean cost per stay: National, $11,700; Pacific, $15,600; Mountain, $11,300; West North Central, $11,400; East North Central, $11,100; Middle Atlantic, $12,200; New England, $13,100; South Atlantic, $10,600; East South Central, $9,900; West South Central, $10,700. Ratio of census division mean to national mean: Pacific and New England, >1.10; Middle Atlantic, 1.00-1.04; Mountain, West North Central, and East North Central, 0.95-0.99; West South Central and South Atlantic, 0.90-0.94; East South Central, ,0.90. Mean length of stay in days: National, 4.6; Pacific, 4.4; Mountain, 4.3; West North Central, 4.4; East North Central, 4.4; Middle Atlantic, 5.0; New England, 4.7; South Atlantic, 4.7; East South Central, 4.8; West South Central, 4.6. Ratio of census division mean to national mean: Middle Atlantic, 1.05-1.09; New England, South Atlantic, East South Central, and West South Central, 1.00-1.04; West North Central, East North Central, Pacific, 0.95-0.99; Mountain, 0.90-0.94.

Table 2 presents the rate per 1,000 population of inpatient stays by patient age and sex by U.S. census division in 2016.


Table 2. Population rate of inpatient stays by patient age and sex, by U.S. census division, 2016
Variable National New England Middle Atlantic East North Central West North Central South Atlantic East South Central West South Central Mountain Pacific
Population rate per 1,000 104.2 106.3 112.3 110.1 109.4 109.3 121.3 100.8 88.1 87.3
Patient age, years
<1 210.8 215.4 212.9 212.3 219.9 211.4 218.6 210.2 195.6 207.5
1-17 17.1 16.7 20.0 16.4 20.6 17.4 18.1 16.3 15.1 15.1
18-44 75.4 71.2 79.3 77.0 80.3 78.6 86.0 75.8 69.2 65.3
45-64 104.3 98.4 109.9 109.9 105.2 111.0 130.9 105.4 86.8 84.1
65-84 232.5 234.2 242.3 252.6 241.9 233.2 272.4 244.2 193.7 191.9
85+ 455.7 488.3 483.3 477.6 445.4 454.1 500.9 481.5 362.5 406.1
Patient sex
Male 91.3 96.2 101.6 96.8 94.9 96.9 105.3 84.9 76.1 75.8
Female 116.6 115.9 122.5 122.9 123.5 121.0 136.5 116.3 100.1 98.7
Source: Agency for Healthcare Research and Quality (AHRQ), Center for Delivery, Organization, and Markets, Healthcare Cost and Utilization Project (HCUP), National Inpatient Sample (NIS), 2016


  • The West North Central division had the highest rate of stays for children and the East South Central division had the highest rate of stays for adults.

    The rate of stays per 1,000 population for each age group ranged widely:
    • Under 1 year old: From 195.6 in the Mountain division to 219.9 in the West North Central division
    • 1-17 years old: From 15.1 in the Mountain and Pacific divisions to 20.6 in the West North Central division
    • 18-44 years: From 65.3 in the Pacific division to 86.0 in the East South Central division
    • 45-64 years: From 84.1 in the Pacific division to 130.9 in the East South Central division
    • 65-84 years: From 191.9 in the Pacific division to 272.4 in the East South Central division
    • 85 years and older: From 362.5 in the Mountain division to 500.9 in the East South Central division


  • The rate of stays for both males and females was highest in the East South Central division and lowest in the Pacific division.
    The rate of stays per 1,000 population for males ranged from 75.8 in the Pacific division to 105.3 in the East South Central division. The rate stays for females ranged from 98.7 in the Pacific division to 136.5 in the East South Central division.
Figure 3 presents the population rate of inpatient stays by community-level income (lowest income vs. the three higher income quartiles combined) for each U.S. census division in 2016. The rate of stays for all community-level income quartiles by U.S. census division in 2016 is presented in the Appendix.


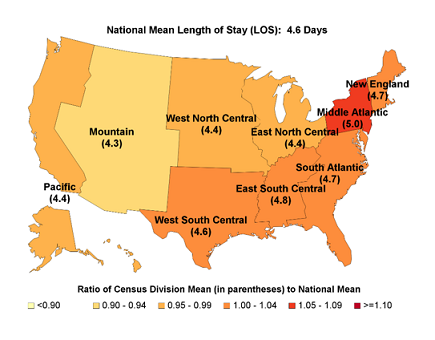
Figure 3. Population rate of inpatient stays by community-level income for each U.S. census division, 2016

Figure 3 is bar chart illustrating the rate per 1,000 population of inpatient stays by community-level income by census division in 2016.

Source: Agency for Healthcare Research and Quality (AHRQ), Center for Delivery, Organization, and Markets, Healthcare Cost and Utilization Project (HCUP), National Inpatient Sample (NIS), 2016

Bar chart that shows the rate per 1,000 population of inpatient stays by community-level income by census division in 2016. National: Quartile 1 (lowest), 122.7; Quartiles 2-4 (higher incomes), 95.4. New England: Quartile 1 (lowest), 133.2; Quartiles 2-4 (higher incomes), 99.9. Middle Atlantic: Quartile 1 (lowest), 133.9; Quartiles 2-4 (higher incomes), 105.0. East North Central: Quartile 1 (lowest), 131.7; Quartiles 2-4 (higher incomes), 101.9. West North Central: Quartile 1 (lowest), 128.3; Quartiles 2-4 (higher incomes), 103.6. South Atlantic: Quartile 1 (lowest), 129.4; Quartiles 2-4 (higher incomes), 97.4. East South Central: Quartile 1 (lowest), 133.3; Quartiles 2-4 (higher incomes), 106.8. West South Central: Quartile 1 (lowest), 111.7; Quartiles 2-4 (higher incomes), 92.2. Mountain: Quartile 1 (lowest), 100.0; Quartiles 2-4 (higher incomes), 80.4. Pacific: Quartile 1 (lowest), 101.6; Quartiles 2-4 (higher incomes), 82.1.


  • Across census divisions, the rate of stays was higher for patients residing in the lowest income quartile than for patients residing in higher income areas.

    Nationally and for each census division, the rate of stays in the lowest income quartile was at least 20 percent higher than the rate of stays in higher income areas. The largest discrepancies were in New England and the South Atlantic, where the rate in the lowest income quartile was over 30 percent higher than the rate in higher income areas (New England: 133.2 vs. 99.9 per 1,000 population; South Atlantic: 129.4 vs. 97.4 per 1,000 population).


  • The Mountain and Pacific divisions had the lowest rate of stays across census divisions regardless of community-level income.

    The rate of stays was highest in the eastern and northern United States and lowest in the western and southern part of the country. In all eastern and northern divisions, the rate of stays in the lowest income quartile was approximately 130 per 1,000 population. By contrast, the rate of stays in the lowest income quartile of the Mountain and Pacific divisions was approximately 100 per 1,000 population, which is similar to the rate of stays among patients in higher income quartiles of five other U.S. divisions (from 97.4 stays per 1,000 population in the South Atlantic to 105.0 stays per 1,000 population in the Middle Atlantic).
Figure 4 presents the rate per 1,000 population of inpatient stays by patient residence location (large metropolitan, medium or small metropolitan, and micropolitan/noncore) for each U.S. census division in 2016. The rate of stays for all patient residence locations by U.S. census division in 2016 is presented in the Appendix.


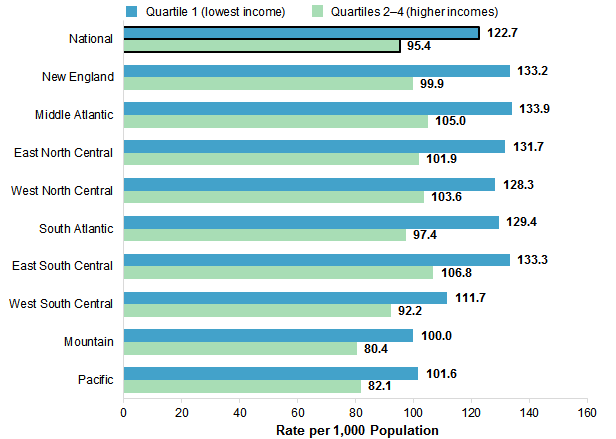
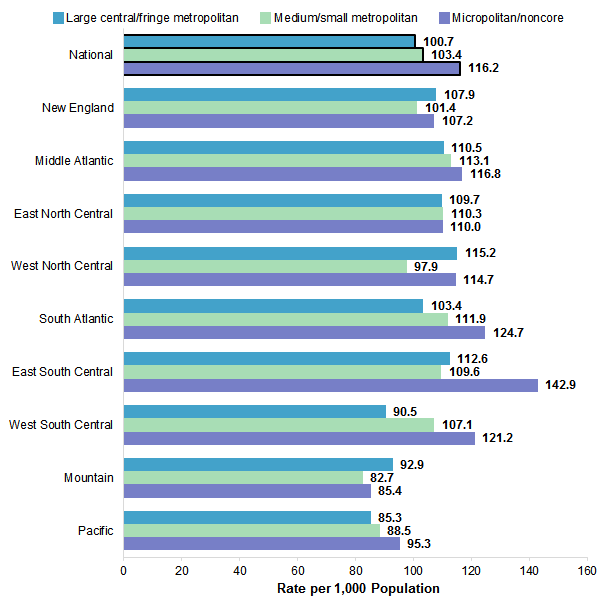
Figure 4. Population rate of inpatient stays by patient residence location for each U.S. census division, 2016

Figure 4 is bar chart illustrating the rate per 1,000 population of inpatient stays by patient residence location by U.S. census division in 2016.

Source: Agency for Healthcare Research and Quality (AHRQ), Center for Delivery, Organization, and Markets, Healthcare Cost and Utilization Project (HCUP), National Inpatient Sample (NIS), 2016

Bar chart that shows the rate per 1,000 population of inpatient stays by patient residence location by U.S. census division in 2016. National: large central/fringe metropolitan, 100.7; medium/small metropolitan, 103.4; micropolitan/noncore, 116.2. New England: large central/fringe metropolitan, 107.9; medium/small metropolitan, 101.4; micropolitan/noncore, 107.2. Middle Atlantic: large central/fringe metropolitan, 110.5; medium/small metropolitan, 113.1; micropolitan/noncore, 116.8. East North Central: large central/fringe metropolitan, 109.7; medium/small metropolitan, 110.3; micropolitan/noncore, 110.0. West North Central: large central/fringe metropolitan, 115.2; medium/small metropolitan, 97.9; micropolitan/noncore, 114.7. South Atlantic: large central/fringe metropolitan, 103.4; medium/small metropolitan, 111.9; micropolitan/noncore, 124.7. East South Central: large central/fringe metropolitan, 112.6; medium/small metropolitan, 109.6; micropolitan/noncore, 142.9. West South Central: large central/fringe metropolitan, 90.5; medium/small metropolitan, 107.1; micropolitan/noncore, 121.2. Mountain: large central/fringe metropolitan, 92.9; medium/small metropolitan, 82.7; micropolitan/noncore, 85.4. Pacific: large central/fringe metropolitan, 85.3; medium/small metropolitan, 88.5; micropolitan/noncore, 95.3.


  • The rate of stays was highest among patients residing in micropolitan/noncore areas in the East South Central division.

    Nationally, the rate of stays was higher in micropolitan/noncore areas than in large or medium to small metropolitan areas (116.2 vs. 100.7 and 103.4 per 1,000 population, respectively). Across census divisions and patient residence locations, the highest rate of stays was among patients residing in micropolitan/noncore areas in the East South Central division, at 142.9 per 1,000 population. The lowest rate was among patients residing in medium or small metropolitan areas in the Mountain division, at 82.7 per 1,000 population.

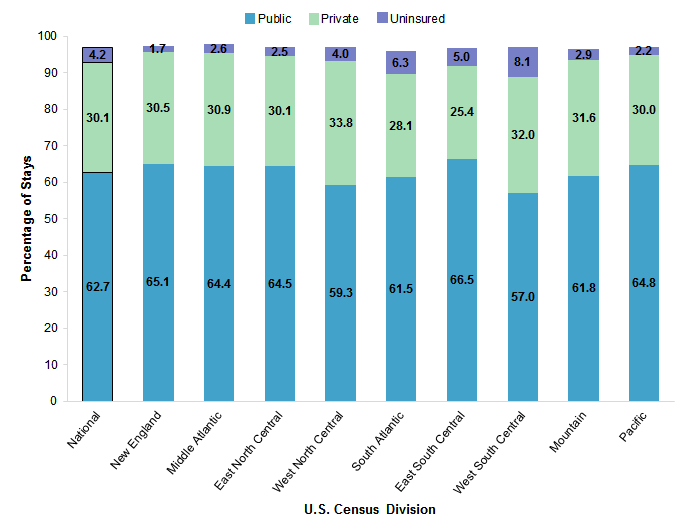
Figure 5 presents the percentage of inpatient stays by expected primary payer (public, private, and uninsured) for each U.S. census division in 2016. The distribution of stays for the different payer types by U.S. census division in 2016 is presented in the Appendix.


Figure 5. Percentage of inpatient stays by expected primary payer for each U.S. census division, 2016

Figure 5 is a bar chart that illustrates the percentage of inpatient stays by expected primary payer by census division in 2016.

Note: Totals may not sum to 100 percent because of discharges with missing expected primary payer.
Source: Agency for Healthcare Research and Quality (AHRQ), Center for Delivery, Organization, and Markets, Healthcare Cost and Utilization Project (HCUP), National Inpatient Sample (NIS), 2016

Bar chart that shows the percentage of inpatient stays by expected primary payer by census division in 2016. National: public, 62.7; private, 30.1; uninsured, 4.2. New England: public, 65.1; private, 30.5; uninsured, 1.7. Middle Atlantic: public, 64.4; private, 30.9; uninsured, 2.6. East North Central: public, 64.5; private, 30.1; uninsured, 2.5. West North Central: public, 59.3; private, 33.8; uninsured, 4.0. South Atlantic: public, 61.5; private, 28.1; uninsured, 6.3. East South Central: public, 66.5; private, 25.4; uninsured, 5.0. West South Central: public, 57.0; private, 32.0; uninsured, 8.1. Mountain: public, 61.8; private, 31.6; uninsured, 2.9. Pacific: public, 64.8; private, 30.0; uninsured, 2.2.


Appendix. Population rate of inpatient stays by community-level income and patient residence, and percentage distribution of stays by primary payer, by U.S. census division, 2016
Variable National New England Middle Atlantic East North Central West North Central South Atlantic East South Central West South Central Mountain Pacific
Population rate per 1,000 104.2 106.3 112.3 110.1 109.4 109.3 121.3 100.8 88.1 87.3
Community-level income, rate
Quartile 1 (lowest income) 122.7 133.2 133.9 131.7 128.3 129.4 133.3 111.7 100.0 101.6
Quartile 2 107.7 119.0 114.1 112.8 114.1 111.4 121.3 104.8 86.7 93.2
Quartile 3 96.3 103.4 109.4 100.5 104.6 98.6 100.8 92.3 79.9 85.1
Quartile 4 (highest income) 82.5 90.8 96.2 87.9 88.2 78.5 75.1 76.8 72.8 73.1
Patient residence location, rate
Large central metropolitan 100.7 112.1 112.6 116.4 117.8 111.8 104.6 89.9 95.1 85.8
Large fringe metropolitan 100.6 106.0 108.4 102.7 113.6 98.3 122.3 91.8 86.2 83.6
Medium metropolitan 103.1 98.2 112.3 111.9 99.0 111.1 122.1 104.9 80.1 86.6
Small metropolitan 104.1 119.0 115.3 108.0 96.7 113.9 85.9 113.2 87.8 94.9
Micropolitan 111.8 92.8 118.5 109.7 109.1 123.2 134.8 119.4 79.8 94.5
Noncore 122.7 131.9 112.3 110.8 120.0 126.6 151.8 123.2 96.7 97.6
All hospital stays, N (millions) 35.7 1.7 4.9 5.5 2.5 7.4 2.4 4.2 2.2 4.9
Primary payer, %
Medicare 39.6 44.2 40.1 42.8 41.2 41.0 43.7 35.7 34.8 34.4
Medicaid 23.1 20.9 24.3 21.7 18.2 20.5 22.8 21.3 27.0 30.4
Private insurance 30.1 30.5 30.9 30.1 33.8 28.1 25.4 32.0 31.6 30.0
Uninsured 4.2 1.7 2.6 2.5 4.0 6.3 5.0 8.1 2.9 2.2
Other 3.0 2.5 1.8 2.9 2.7 4.0 2.8 2.8 3.3 3.0
Note: Totals by primary payer may not sum to 100 percent due to discharges with missing payer information.
Source: Agency for Healthcare Research and Quality (AHRQ), Center for Delivery, Organization, and Markets, Healthcare Cost and Utilization Project (HCUP), National Inpatient Sample (NIS), 2016


About Statistical Briefs

Healthcare Cost and Utilization Project (HCUP) Statistical Briefs provide basic descriptive statistics on a variety of topics using HCUP administrative healthcare data. Topics include hospital inpatient, ambulatory surgery, and emergency department use and costs, quality of care, access to care, medical conditions, procedures, and patient populations, among other topics. The reports are intended to generate hypotheses that can be further explored in other research; the reports are not designed to answer in-depth research questions using multivariate methods.

Data Source

The estimates in this Statistical Brief are based upon data from the HCUP 2016 National Inpatient Sample (NIS). Historical data were drawn from the 2006 Nationwide Inpatient Sample (NIS). Supplemental sources included population denominator data for use with HCUP databases, derived from information available from the Claritas, a vendor that compiles and adds value to data from the U.S. Census Bureau.5

Definitions

Types of hospitals included in the HCUP National (Nationwide) Inpatient Sample
The National (Nationwide) Inpatient Sample (NIS) is based on data from community hospitals, which are defined as short-term, non-Federal, general, and other hospitals, excluding hospital units of other institutions (e.g., prisons). The NIS includes obstetrics and gynecology, otolaryngology, orthopedic, cancer, pediatric, public, and academic medical hospitals. Excluded are long-term care facilities such as rehabilitation, psychiatric, and alcoholism and chemical dependency hospitals. Beginning in 2012, long-term acute care hospitals are also excluded. However, if a patient received long-term care, rehabilitation, or treatment for a psychiatric or chemical dependency condition in a community hospital, the discharge record for that stay will be included in the NIS.

Unit of analysis
The unit of analysis is the hospital discharge (i.e., the hospital stay), not a person or patient. This means that a person who is admitted to the hospital multiple times in 1 year will be counted each time as a separate discharge from the hospital.

Costs and charges
Total hospital charges were converted to costs using HCUP Cost-to-Charge Ratios based on hospital accounting reports from the Centers for Medicare & Medicaid Services (CMS).6 Costs reflect the actual expenses incurred in the production of hospital services, such as wages, supplies, and utility costs; charges represent the amount a hospital billed for the case. For each hospital, a hospital-wide cost-to-charge ratio is used. Hospital charges reflect the amount the hospital billed for the entire hospital stay and do not include professional (physician) fees. For the purposes of this Statistical Brief, mean costs are reported to the nearest hundred.

Location of patients' residence
Place of residence is based on the urban-rural classification scheme for U.S. counties developed by the National Center for Health Statistics (NCHS) and based on the Office of Management and Budget (OMB) definition of a metropolitan service area as including a city and a population of at least 50,000 residents:
Community-level income
Community-level income is based on the median household income of the patient's ZIP Code of residence. Quartiles are defined so that the total U.S. population is evenly distributed. Cut-offs for the quartiles are determined annually using ZIP Code demographic data obtained from Claritas, a vendor that adds value to data from the U.S. Census Bureau.7 The income quartile is missing for patients who are homeless or foreign.

Payer
Payer is the expected payer for the hospital stay. To make coding uniform across all HCUP data sources, payer combines detailed categories into general groups:
Hospital stays billed to the State Children's Health Insurance Program (SCHIP) may be classified as Medicaid, Private Insurance, or Other, depending on the structure of the State program. Because most State data do not identify patients in SCHIP specifically, it is not possible to present this information separately.

For this Statistical Brief, when more than one payer is listed for a hospital discharge, the first-listed payer is used.

Division
Division corresponds to the location of the hospital and is one of the nine divisions defined by the U.S. Census Bureau:
About HCUP

The Healthcare Cost and Utilization Project (HCUP, pronounced "H-Cup") is a family of healthcare databases and related software tools and products developed through a Federal-State-Industry partnership and sponsored by the Agency for Healthcare Research and Quality (AHRQ). HCUP databases bring together the data collection efforts of State data organizations, hospital associations, and private data organizations (HCUP Partners) and the Federal government to create a national information resource of encounter-level healthcare data. HCUP includes the largest collection of longitudinal hospital care data in the United States, with all-payer, encounter-level information beginning in 1988. These databases enable research on a broad range of health policy issues, including cost and quality of health services, medical practice patterns, access to healthcare programs, and outcomes of treatments at the national, State, and local market levels.

HCUP would not be possible without the contributions of the following data collection Partners from across the United States:

Alaska Department of Health and Social Services
Alaska State Hospital and Nursing Home Association
Arizona Department of Health Services
Arkansas Department of Health
California Office of Statewide Health Planning and Development
Colorado Hospital Association
Connecticut Hospital Association
Delaware Division of Public Health
District of Columbia Hospital Association
Florida Agency for Health Care Administration
Georgia Hospital Association
Hawaii Health Information Corporation
Illinois Department of Public Health
Indiana Hospital Association
Iowa Hospital Association
Kansas Hospital Association
Kentucky Cabinet for Health and Family Services
Louisiana Department of Health
Maine Health Data Organization
Maryland Health Services Cost Review Commission
Massachusetts Center for Health Information and Analysis
Michigan Health & Hospital Association
Minnesota Hospital Association
Mississippi State Department of Health
Missouri Hospital Industry Data Institute
Montana Hospital Association
Nebraska Hospital Association
Nevada Department of Health and Human Services
New Hampshire Department of Health & Human Services
New Jersey Department of Health
New Mexico Department of Health
New York State Department of Health
North Carolina Department of Health and Human Services
North Dakota (data provided by the Minnesota Hospital Association)
Ohio Hospital Association
Oklahoma State Department of Health
Oregon Association of Hospitals and Health Systems
Oregon Office of Health Analytics
Pennsylvania Health Care Cost Containment Council
Rhode Island Department of Health
South Carolina Revenue and Fiscal Affairs Office
South Dakota Association of Healthcare Organizations
Tennessee Hospital Association
Texas Department of State Health Services
Utah Department of Health
Vermont Association of Hospitals and Health Systems
Virginia Health Information
Washington State Department of Health
West Virginia Department of Health and Human Resources, West Virginia Health Care Authority
Wisconsin Department of Health Services
Wyoming Hospital Association

About the NIS

The HCUP National (Nationwide) Inpatient Sample (NIS) is a nationwide database of hospital inpatient stays. The NIS is nationally representative of all community hospitals (i.e., short-term, non-Federal, nonrehabilitation hospitals). The NIS includes all payers. It is drawn from a sampling frame that contains hospitals comprising more than 95 percent of all discharges in the United States. The vast size of the NIS allows the study of topics at the national and regional levels for specific subgroups of patients. In addition, NIS data are standardized across years to facilitate ease of use. Over time, the sampling frame for the NIS has changed; thus, the number of States contributing to the NIS varies from year to year. The NIS is intended for national estimates only; no State-level estimates can be produced.

The 2012 NIS was redesigned to optimize national estimates. The redesign incorporates two critical changes:
The new sampling strategy is expected to result in more precise estimates than those that resulted from the previous NIS design by reducing sampling error: for many estimates, confidence intervals under the new design are about half the length of confidence intervals under the previous design. The change in sample design for 2012 necessitates recomputation of prior years' NIS data to enable analyses of trends that use the same definitions of discharges and hospitals.

The unweighted sample size for the 2016 NIS is 7,135,090 (weighted, this represents 35,675,421 inpatient stays).

For More Information

For other information on hospital inpatient stays, refer to the HCUP Statistical Briefs located at www.hcup-us.ahrq.gov/reports/statbriefs/sb_hospoverview.jsp.

For additional HCUP statistics, visit:
For more information about HCUP, visit www.hcup-us.ahrq.gov/.

For a detailed description of HCUP and more information on the design of the National (Nationwide) Inpatient Sample (NIS), please refer to the following database documentation:

Agency for Healthcare Research and Quality. Overview of the National (Nationwide) Inpatient Sample (NIS). Healthcare Cost and Utilization Project (HCUP). Rockville, MD: Agency for Healthcare Research and Quality. Updated February 2018. www.hcup-us.ahrq.gov/nisoverview.jsp. Accessed February 12, 2018.

Suggested Citation

Freeman WJ (AHRQ), Weiss AJ (IBM Watson Health), Heslin KC (AHRQ). Overview of U.S. Hospital Stays in 2016: Variation by Geographic Region. HCUP Statistical Brief #246. December 2018. Agency for Healthcare Research and Quality, Rockville, MD. www.hcup-us.ahrq.gov/reports/statbriefs/sb246-Geographic-Variation-Hospital-Stays.pdf.

Acknowledgments

The authors would like to acknowledge the contributions of Minya Sheng of IBM Watson Health.

***

AHRQ welcomes questions and comments from readers of this publication who are interested in obtaining more information about access, cost, use, financing, and quality of healthcare in the United States. We also invite you to tell us how you are using this Statistical Brief and other HCUP data and tools, and to share suggestions on how HCUP products might be enhanced to further meet your needs. Please e-mail us at hcup@ahrq.gov or send a letter to the address below:

Virginia Mackay-Smith, Acting Director
Center for Delivery, Organization, and Markets
Agency for Healthcare Research and Quality
5600 Fishers Lane
Rockville, MD 20857


This Statistical Brief was posted online on December 18, 2018.


1 Institute of Medicine. Variation in Health Care Spending: Target Decision Making, Not Geography. Washington DC: The National Academies Press; 2013.
2 Weiss AJ, Elixhauser A. Overview of Hospital Stays in the United States, 2012. HCUP Statistical Brief #180. October 2014. Agency for Healthcare Research and Quality, Rockville, MD. www.hcup-us.ahrq.gov/reports/statbriefs/sb180-Hospitalizations-United-States-2012.pdf. Accessed September 28, 2018.
3 Ibid.
4 Kaiser Family Foundation. Hospital Admissions per 1,000 Population by Ownership Type. https://www.kff.org/other/state-indicator/admissions-by-ownership/?currentTimeframe=0&sortModel=%7B%22colId%22:%22Total%22,%22sort%22:%22d1esc%22%7D. Exit Disclaimer Accessed November 7, 2018.
5 Claritas. Claritas Demographic Profile by ZIP Code. https://claritas360.claritas.com/mybestsegments/. Exit Disclaimer Accessed June 6, 2018.
6 Agency for Healthcare Research and Quality. HCUP Cost-to-Charge Ratio (CCR) Files. Healthcare Cost and Utilization Project (HCUP). 2001-2015. Agency for Healthcare Research and Quality. Updated December 2017. www.hcup-us.ahrq.gov/db/state/costtocharge.jsp. Accessed January 18, 2018.
7 Claritas. Claritas Demographic Profile by ZIP Code. https://claritas360.claritas.com/mybestsegments/. Exit Disclaimer. Accessed June 6, 2018.

Internet Citation: Statistical Brief #246. Healthcare Cost and Utilization Project (HCUP). December 2018. Agency for Healthcare Research and Quality, Rockville, MD. www.hcup-us.ahrq.gov/reports/statbriefs/sb246-Geographic-Variation-Hospital-Stays.jsp.
Are you having problems viewing or printing pages on this website?
If you have comments, suggestions, and/or questions, please contact hcup@ahrq.gov.
Privacy Notice, Viewers & Players
Last modified 12/13/18