STATISTICAL BRIEF #241 |
July 2018
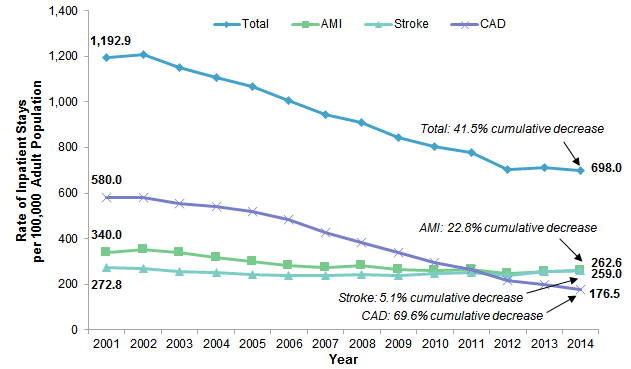
Quyen Ngo-Metzger, M.D., M.P.H., Arlene S. Bierman, M.D., M.S., Amanda Borsky, Dr.P.H., M.P.P., Kevin C. Heslin, Ph.D., Brian J. Moore, Ph.D., and Marguerite L. Barrett, M.S. Introduction Atherosclerotic cardiovascular disease (ASCVD) refers to disease of the heart and blood vessels due to the accumulation of plaques. ASCVD can limit blood flow to the heart (coronary artery disease) and lead to dangerous cardiovascular events such as heart attacks (acute myocardial infarction). ASCVD in the blood vessels of the brain can decrease blood flow to the brain and result in ischemic strokes. Heart disease and stroke are among the top five leading causes of death.1 When these events do occur they often result in inpatient hospitalizations. Hospitalizations can put patients at greater risk for additional complications, such as hospital-associated infections and even death.2, 3, 4 ASCVD places a substantial burden on the U.S. healthcare system. The direct medical costs from coronary artery disease and stroke are currently estimated to be $126 billion per year and are expected to rise to $309 billion by 2035.5 This Healthcare Cost and Utilization Project (HCUP) Statistical Brief presents data on adult inpatient stays with a principal diagnosis of ASCVD, defined as one of three specific diagnoses: coronary artery disease (CAD), acute myocardial infarction (AMI), and ischemic stroke (referred to hereinafter as stroke). The rate of ASCVD stays among adults aged 18 years and older is provided along with the percentage of ASCVD stays with an in-hospital death from 2001 to 2014, overall and for specific subgroups defined by diagnosis (AMI, stroke, CAD) and by procedure (percutaneous transluminal coronary angioplasty [PTCA] and coronary artery bypass graft [CABG]). The rate of adult ASCVD stays in 2014 is also presented by community-level income and by patient location. Differences greater than 10 percent between estimates are noted in the text. Findings Inpatient stays among adults with a principal diagnosis of ASCVD, 2001-2014 Figure 1 presents the rate of ASCVD inpatient stays per 100,000 adults from 2001 to 2014, overall and for each of the three specific ASCVD diagnoses—AMI, stroke, and CAD. |
|
|
Figure 1. Inpatient stays for ASCVD among adults, 2001-2014
Abbreviations: AMI, acute myocardial infarction; ASCVD, atherosclerotic cardiovascular disease; CAD, coronary artery disease Inpatient stays for ASCVD among adults, 2001-2014
Line graph that shows the rate of inpatient stays for ASCVD per 100,000 adult population from 2001 to 2014. Total: increased from 1,192.9 in 2001 to 1,206.9 in 2002, decreased steadily to 702.9 in 2012, increased to 711.2 in 2013, decreased to 698.0 in 2014—for a 41.5% cumulative decrease. CAD: increased from 580.0 in 2001 to 582.0 in 2002, decreased steadily to 176.5 in 2014—for a 69.6% cumulative decrease. AMI: increased from 340.0 in 2001 to 354.2 in 2002, decreased to 275.1 in 2007, fluctuated between 281.3 in 2008 and 262.6 in 2014—for a 22.8% cumulative decrease. Stroke: decreased from 272.8 in 2001 to 239.5 in 2006, fluctuated between 240.3 in 2007 and 259.0 in 2014—for a 5.1% cumulative decrease.
|
|
|
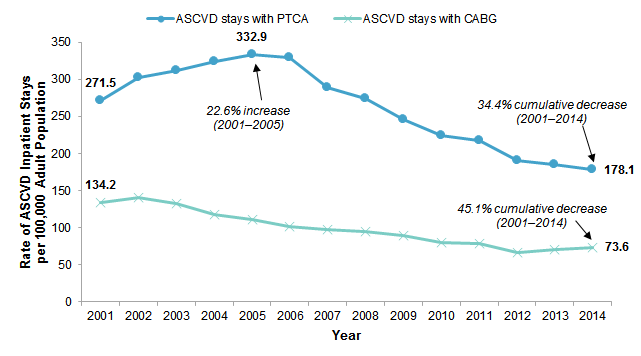
Figure 2. Adult ASCVD inpatient stays with common cardiovascular procedures, 2001-2014
Abbreviations: ASCVD, atherosclerotic cardiovascular disease; CABG, coronary artery bypass graft; PTCA, percutaneous transluminal coronary angioplasty Line graph that shows the rate of ASCVD inpatient stays with PTCA and CABG per 100,000 adult population from 2001 to 2014. ASCVD stays with PTCA: increased steadily from 271.5 in 2001 to 332.9 in 2005, for a 22.6% increase; decreased steadily thereafter to 178.1 in 2014—for a 34.4% cumulative decrease from 1001 to 2014. ASCVD stays with CABG: increased from 134.2 in 2001 to 141.4 in 2002, decreased steadily to 66.7 in 2012, increased steadily to 73.6 in 2014—for a 45.1% cumulative decrease. |
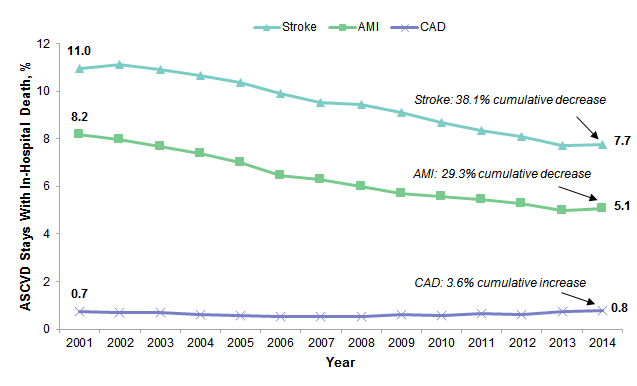
Figure 3 presents the percentage of adult ASCVD stays that resulted in an in-hospital death from 2001 to 2014 for each of the three specific ASCVD diagnoses—AMI, stroke, and CAD. |
|
Figure 3. In-hospital deaths among adult ASCVD inpatient stays, 2001-2014
Abbreviations: AMI, acute myocardial infarction; ASCVD, atherosclerotic cardiovascular disease; CAD, coronary artery disease Line graph that shows the percentage of adult ASCVD stays with in-hospital death from 2001 to 2014. Stroke: increased from 11.0 in 2001 to 11.1 in 2002, decreased steadily to 7.7 in 2013 and 2014—for a 7.7% cumulative decrease. AMI: decreased steadily from 8.2 in 2001 to 5.0 in 2013, increased to 5.1 in 2014—for a 29.3% cumulative decrease. CAD: decreased steadily from 0.7 in 2001 to 0.5 in 2006, 2007, and 2008; increased steadily to 0.7 in 2011; decreased to 0.6 in 2012, increased steadily to 0.8 in 2014—for a 3.6% cumulative increase. |
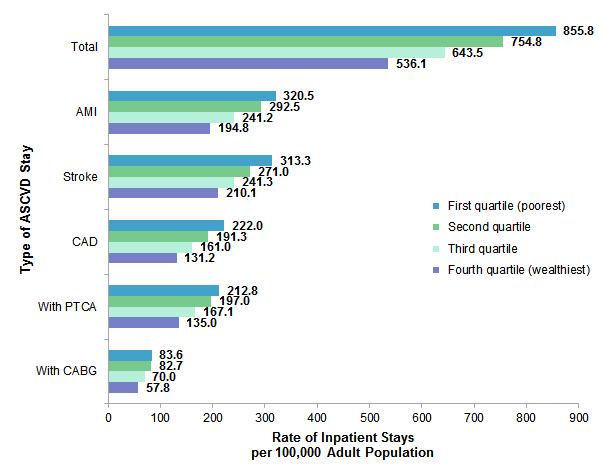
Figure 4 presents the rate of ASCVD stays per 100,000 adults in 2014 by community-level income quartile, overall and for each of the three specific ASCVD diagnoses (AMI, stroke, and CAD) and procedures (PTCA and CABG). |
|
Figure 4. Adult ASCVD inpatient stays by community-level income, 2014
Abbreviations: AMI, acute myocardial infarction; ASCVD, atherosclerotic cardiovascular disease; CABG, coronary artery bypass graft; CAD, coronary artery disease; PTCA, percutaneous transluminal coronary angioplasty Bar chart that shows the rate of ASCVD inpatient stays per 100,000 adult population by community-level income. Total: first quartile (poorest), 855.8; second quartile, 754.8; third quartile, 643.5; fourth quartile (wealthiest), 536.1. AMI: first quartile (poorest), 320.5; second quartile, 292.5; third quartile, 241.2; fourth quartile (wealthiest), 194.8. Stroke: first quartile (poorest), 313.3; second quartile, 271.0; third quartile, 241.3; fourth quartile (wealthiest), 210.1. CAD: first quartile (poorest), 222.0; second quartile, 191.3; third quartile, 161.0; fourth quartile (wealthiest), 131.2. ASCVD stays with PTCA: first quartile (poorest), 212.8; second quartile, 197.0; third quartile, 167.1; fourth quartile (wealthiest), 135.0. ASCVD stays with CABG: first quartile (poorest), 83.6; second quartile, 82.7; third quartile, 70.0; fourth quartile (wealthiest), 57.8.
|
|
|
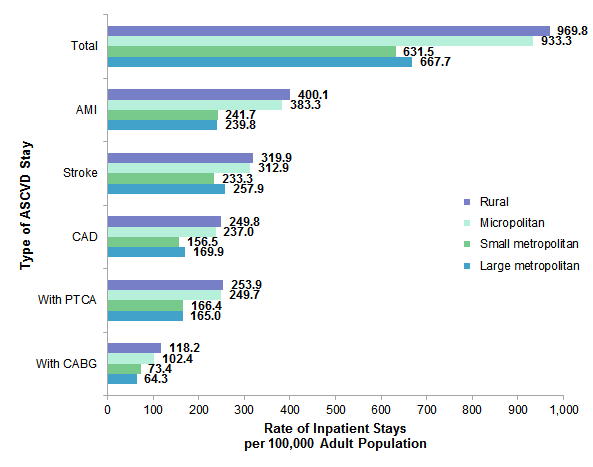
Figure 5. Adult ASCVD inpatient stays by location of patients' residence, 2014
Abbreviations: AMI, acute myocardial infarction; ASCVD, atherosclerotic cardiovascular disease; CABG, coronary artery bypass graft; CAD, coronary artery disease; PTCA, percutaneous transluminal coronary angioplasty Bar chart that shows the rate of ASCVD inpatient stays per 100,000 adult population by location of patients' residence. Total: rural, 969.8; micropolitan, 933.3; small metropolitan, 631.5; large metropolitan, 667.7. AMI: rural, 400.1; micropolitan, 383.3; small metropolitan, 241.7; large metropolitan, 239.8. Stroke: rural, 319.9; micropolitan, 312.9; small metropolitan, 233.3; large metropolitan, 257.9. CAD: rural, 249.8; micropolitan, 237.0; small metropolitan, 156.5; large metropolitan, 169.9. ASCVD stays with PTCA: rural, 253.9; micropolitan, 249.7; small metropolitan, 166.4; large metropolitan, 165.0. ASCVD stays with CABG: rural, 118.2; micropolitan, 102.4; small metropolitan, 73.4; large metropolitan, 64.3.
|
About Statistical Briefs Healthcare Cost and Utilization Project (HCUP) Statistical Briefs provide basic descriptive statistics on a variety of topics using HCUP administrative healthcare data. Topics include hospital inpatient, ambulatory surgery, and emergency department use and costs, quality of care, access to care, medical conditions, procedures, and patient populations, among other topics. The reports are intended to generate hypotheses that can be further explored in other research; the reports are not designed to answer in-depth research questions using multivariate methods. Data Source The estimates in this Statistical Brief are based upon data from the HCUP State Inpatient Databases (SID), 2001-2014, nationally weighted analysis files using a sampling and weighting strategy similar to that used in the 2011 Nationwide Inpatient Sample, but with a higher sampling rate of 40 percent of hospitals.6 Because analyses in this Statistical Brief are based on a nationally representative analysis file, the values may differ from results reported from the HCUP National (Nationwide) Inpatient Sample (NIS). Supplemental sources included population denominator data for use with HCUP databases, derived from information available from Claritas, a vendor that compiles and adds value to data from the U.S. Census Bureau.7 Definitions Diagnoses, procedures, and Clinical Classifications Software (CCS) The principal diagnosis is that condition established after study to be chiefly responsible for the patient's admission to the hospital. Secondary diagnoses are concomitant conditions that coexist at the time of admission or develop during the stay. All-listed diagnoses include the principal diagnosis plus these additional secondary conditions. All-listed procedures include all procedures performed during the hospital stay, whether for definitive treatment or for diagnostic or exploratory purposes. The first-listed procedure is the procedure that is listed first on the discharge record. Inpatient data define this as the principal procedure—the procedure that is performed for definitive treatment rather than for diagnostic or exploratory purposes (i.e., the procedure that was necessary to take care of a complication). CCS categorizes ICD-9-CM diagnosis codes and procedure codes into a manageable number of clinically meaningful categories.8 This clinical grouper makes it easier to quickly understand patterns of diagnoses and procedure use. Case definition For this report, the study population of adults aged 18 years and older who were hospitalized for atherosclerotic cardiovascular disease was defined using the following CCS principal diagnosis categories:
This analysis used State Inpatient Databases (SID) limited to data from community hospitals, which are defined as short-term, non-Federal, general, and other hospitals, excluding hospital units of other institutions (e.g., prisons). Community hospitals include obstetrics and gynecology, otolaryngology, orthopedic, cancer, pediatric, public, and academic medical hospitals. Excluded for this analysis are long-term care facilities such as rehabilitation, psychiatric, and alcoholism and chemical dependency hospitals. However, if a patient received long-term care, rehabilitation, or treatment for a psychiatric or chemical dependency condition in a community hospital, the discharge record for that stay was included in the analysis. Unit of analysis The unit of analysis is the hospital discharge (i.e., the hospital stay), not a person or patient. This means that a person who is admitted to the hospital multiple times in 1 year will be counted each time as a separate discharge from the hospital. Location of patients' residence Place of residence is based on a simplified adaptation of the Urban Influence Codes (UIC) developed by the United States Department of Agriculture Economic Research Service. The county-level designation is based on the 2013 version of the UIC. The 12 categories of the UIC are combined into 4 broader categories that differentiate between large metropolitan counties (include one or more urbanized areas with at least one million residents), small metropolitan counties (include one or more urbanized areas with 50,000-999,999 residents), micropolitan counties (include at least one urbanized area with 10,000-49,999 residents), and nonurban residual counties (rural). The location of patients' residence is set to large metropolitan for patients who are homeless. Foreign patients could not be classified and were excluded from results by location of patients' residence. Community-level income Community-level income is based on the median household income of the patient's ZIP Code of residence. Quartiles are defined so that the total U.S. population is evenly distributed. Cut-offs for the quartiles are determined annually using ZIP Code demographic data obtained from Claritas, a vendor that adds value to data from the U.S. Census Bureau.9 The value ranges for the income quartiles vary by year. The income quartile is set to the lowest category (i.e., the first quartile) for patients who are homeless. About HCUP The Healthcare Cost and Utilization Project (HCUP, pronounced "H-Cup") is a family of healthcare databases and related software tools and products developed through a Federal-State-Industry partnership and sponsored by the Agency for Healthcare Research and Quality (AHRQ). HCUP databases bring together the data collection efforts of State data organizations, hospital associations, and private data organizations (HCUP Partners) and the Federal government to create a national information resource of encounter-level healthcare data. HCUP includes the largest collection of longitudinal hospital care data in the United States, with all-payer, encounter-level information beginning in 1988. These databases enable research on a broad range of health policy issues, including cost and quality of health services, medical practice patterns, access to healthcare programs, and outcomes of treatments at the national, State, and local market levels. HCUP would not be possible without the contributions of the following data collection Partners from across the United States: Alaska Department of Health and Social Services Alaska State Hospital and Nursing Home Association Arizona Department of Health Services Arkansas Department of Health California Office of Statewide Health Planning and Development Colorado Hospital Association Connecticut Hospital Association District of Columbia Hospital Association Florida Agency for Health Care Administration Georgia Hospital Association Hawaii Health Information Corporation Illinois Department of Public Health Indiana Hospital Association Iowa Hospital Association Kansas Hospital Association Kentucky Cabinet for Health and Family Services Louisiana Department of Health Maine Health Data Organization Maryland Health Services Cost Review Commission Massachusetts Center for Health Information and Analysis Michigan Health & Hospital Association Minnesota Hospital Association Mississippi State Department of Health Missouri Hospital Industry Data Institute Montana Hospital Association Nebraska Hospital Association Nevada Department of Health and Human Services New Hampshire Department of Health & Human Services New Jersey Department of Health New Mexico Department of Health New York State Department of Health North Carolina Department of Health and Human Services North Dakota (data provided by the Minnesota Hospital Association) Ohio Hospital Association Oklahoma State Department of Health Oregon Association of Hospitals and Health Systems Oregon Office of Health Analytics Pennsylvania Health Care Cost Containment Council Rhode Island Department of Health South Carolina Revenue and Fiscal Affairs Office South Dakota Association of Healthcare Organizations Tennessee Hospital Association Texas Department of State Health Services Utah Department of Health Vermont Association of Hospitals and Health Systems Virginia Health Information Washington State Department of Health West Virginia Department of Health and Human Resources, West Virginia Health Care Authority Wisconsin Department of Health Services Wyoming Hospital Association About the SID The HCUP State Inpatient Databases (SID) are hospital inpatient databases from data organizations participating in HCUP. The SID contain the universe of the inpatient discharge abstracts in the participating HCUP States, translated into a uniform format to facilitate multistate comparisons and analyses. Together, the SID encompass more than 97 percent of all U.S. community hospital discharges. The SID can be used to investigate questions unique to one State, to compare data from two or more States, to conduct market-area variation analyses, and to identify State-specific trends in inpatient care utilization, access, charges, and outcomes. For More Information For other information on heart and circulatory conditions, including opioids, refer to the HCUP Statistical Briefs located at www.hcup-us.ahrq.gov/reports/statbriefs/sb_heart.jsp. For additional HCUP statistics, visit:
For a detailed description of HCUP and more information on the design of the State Inpatient Databases (SID) please refer to the following database documentation: Agency for Healthcare Research and Quality. Overview of the State Inpatient Databases (SID). Healthcare Cost and Utilization Project (HCUP). Rockville, MD: Agency for Healthcare Research and Quality. Updated April 2017. www.hcup-us.ahrq.gov/sidoverview.jsp. Accessed January 18, 2018. Suggested Citation Ngo-Metzger Q (AHRQ), Bierman AS (AHRQ), Borsky A (AHRQ), Heslin KC (AHRQ), Moore BJ (IBM Watson Health), Barrett ML (M.L. Barrett, Inc.). Coronary Artery Disease, Acute Myocardial Infarction, and Ischemic Stroke Rates Among Inpatient Stays, 2001-2014. HCUP Statistical Brief #241. July 2018. Agency for Healthcare Research and Quality, Rockville, MD. www.hcup-us.ahrq.gov/reports/statbriefs/sb241-Coronary-Artery-AMI-Stroke-Hospital-Stays-2001-2014.pdf. Acknowledgments The authors would like to acknowledge the contributions of Minya Sheng of IBM Watson Health. *** AHRQ welcomes questions and comments from readers of this publication who are interested in obtaining more information about access, cost, use, financing, and quality of healthcare in the United States. We also invite you to tell us how you are using this Statistical Brief and other HCUP data and tools, and to share suggestions on how HCUP products might be enhanced to further meet your needs. Please e-mail us at hcup@ahrq.gov or send a letter to the address below:Virginia Mackay-Smith, Acting Director Center for Delivery, Organization, and Markets Agency for Healthcare Research and Quality 5600 Fishers Lane Rockville, MD 20857 This Statistical Brief was posted online on July 24, 2018. 1 Murphy SL, Xu J, Kochanek KD, Curtin SC, Arias E. Deaths: final data for 2015. National Vital Statistics Reports. 2017;66(6):1-75. 2 U.S. Department of Health and Human Services, Office of the Inspector General. Adverse Events in Hospitals: National Incidence Among Medicare Beneficiaries. November 2010. www.oig.hhs.gov/oei/reports/oei-06-09-00090.pdf. Accessed April 17, 2018. 3 Magill SS, Edwards JR, Bamberg W, Beldavs ZG, Dumyati G, Kainer MA, et al. Multistate point-prevalence survey of healthcare-associated infections. New England Journal of Medicine. 2014;370:1198-1208. 4 Covinsky KE, Pierluissi E, Johnston CB. Hospitalization-associated disability: "She was probably able to ambulate, but I'm not sure." JAMA. 2011;306(16):1782-93. 5 American Heart Association. Cardiovascular Disease: A Costly Burden for America, Projections Through 2035. 2017. www.heart.org/idc/groups/heart-public/@wcm/@adv/documents/downloadable/ucm_491543.pdf. 6 Barrett M, Coffey R, Houchens R, Heslin K, Moles E, Coenen N. Methods Applying AHRQ Quality Indicators to Heathcare Cost and Uitilization Project (HCUP) Data for the 2016 National Healthcare Quality and Disparities Report (QDR). HCUP Methods Series Report #2017-03. July 13, 2017. U.S. Agency for Healthcare Research and Quality. www.hcup-us.ahrq.gov/reports/methods/2017-03.pdf. Accessed February 19, 2018. 7 Claritas. Claritas Demographic Profile by ZIP Code. https://claritas360.claritas.com/mybestsegments/. 8 Agency for Healthcare Research and Quality. HCUP Clinical Classifications Software (CCS) for ICD-9-CM. Healthcare Cost and Utilization Project (HCUP). Agency for Healthcare Research and Quality. Updated March 2017. www.hcup-us.ahrq.gov/toolssoftware/ccs/ccs.jsp. Accessed January 18, 2018. 9 Claritas. Claritas Demographic Profile by ZIP Code. https://claritas360.claritas.com/mybestsegments/. |
| Internet Citation: Statistical Brief #241. Healthcare Cost and Utilization Project (HCUP). July 2018. Agency for Healthcare Research and Quality, Rockville, MD. www.hcup-us.ahrq.gov/reports/statbriefs/sb241-Coronary-Artery-AMI-Stroke-Hospital-Stays-2001-2014.jsp?utm_source=ahrq&utm_medium=en2&utm_term=&utm_content=2&utm_campaign=ahrq_en8_28_2018. |
| Are you having problems viewing or printing pages on this website? |
| If you have comments, suggestions, and/or questions, please contact hcup@ahrq.gov. |
| Privacy Notice, Viewers & Players |
| Last modified 7/13/18 |