STATISTICAL BRIEF #24
|
|
January 2007
C. Allison Russo, M.P.H. and Anne Elixhauser, Ph.D.
Introduction Each year, birth defects (or congenital anomalies) affect one out of every 33 babies born in the United States.1 A birth defect occurs when the fetus is developing in the mother’s body, usually within the first three months of pregnancy. Birth defects are often found within the first year of life, and their effects can range from mild to severe. Some defects result in debilitating illness or death at a very young age, while others may be successfully treated with surgery or other medical treatments. Some birth defects may not be discovered or treated until adulthood. In any case, inpatient hospital care is often necessary for persons affected by birth defects. This Statistical Brief provides data from the Healthcare Cost and Utilization Project (HCUP) on hospital care for birth defects in 2004. Hospital utilization and costs for the treatment of birth defects are compared with hospital stays for all other non-obstetrical conditions. Additionally, the most common birth defects resulting in hospital admission are described. Finally, changes in the hospitalization rate for birth defects between 1997 and 2004 are examined. All differences between estimates noted in the text are statistically significant at the 0.05 level or better. Findings In 2004, there were more than 139,000 hospital stays principally for the treatment of birth defects. This represented a hospitalization rate of 47.4 stays per 100,000 persons and totaled $2.6 billion in hospital costs. General characteristics of hospital stays for birth defects Table 1 describes the general characteristics of hospitalizations for birth defects. In general, stays principally for the treatment of birth defects were longer, more costly, occurred more often among males and younger patients, and resulted in a lower in-hospital death rate when compared with hospital stays for all other non-obstetrical conditions. On average, birth defect hospitalizations were about 1.5 days longer than stays for all other conditions (6.3 days versus 4.9 days), while a birth defect admission was on average more than twice as costly ($18,600 versus $8,200). Compared with stays for all other non-obstetrical conditions, patients hospitalized principally for the treatment of birth defects were disproportionately male (53.3 percent versus 46.5 percent) and had a mean age that was more than 30 years younger (17.6 years versus 49.9 years). However, the in-hospital death rate for patients hospitalized for birth defects was lower than the in-hospital death rate for all other conditions–1.3 percent versus 2.4 percent. |
|
Birth defects causing hospitalization
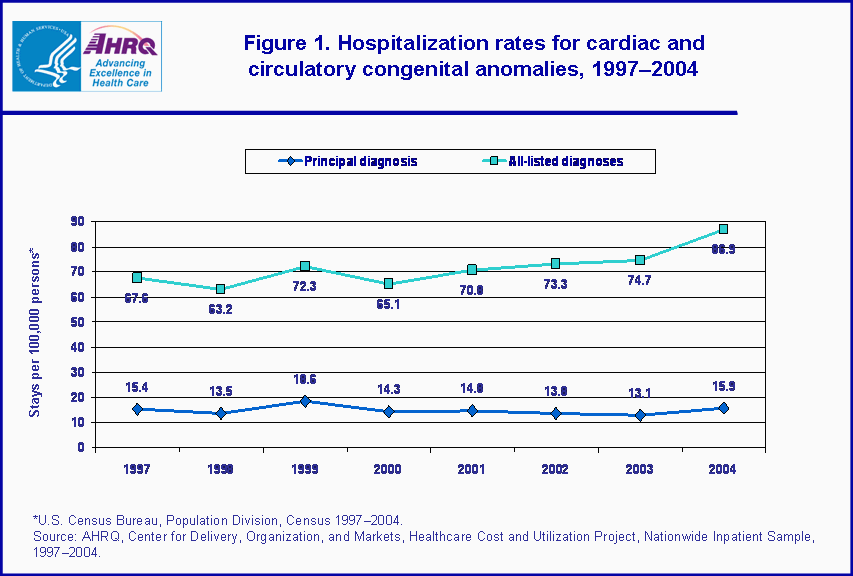
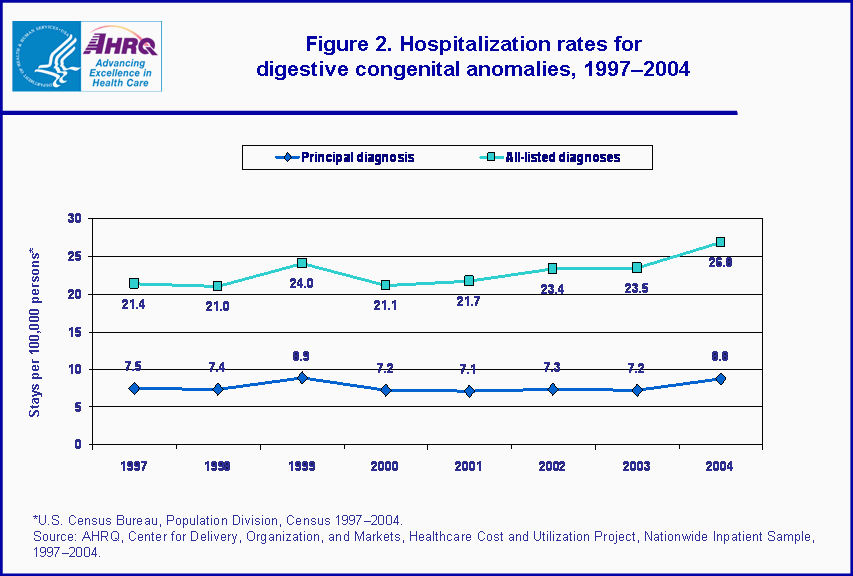
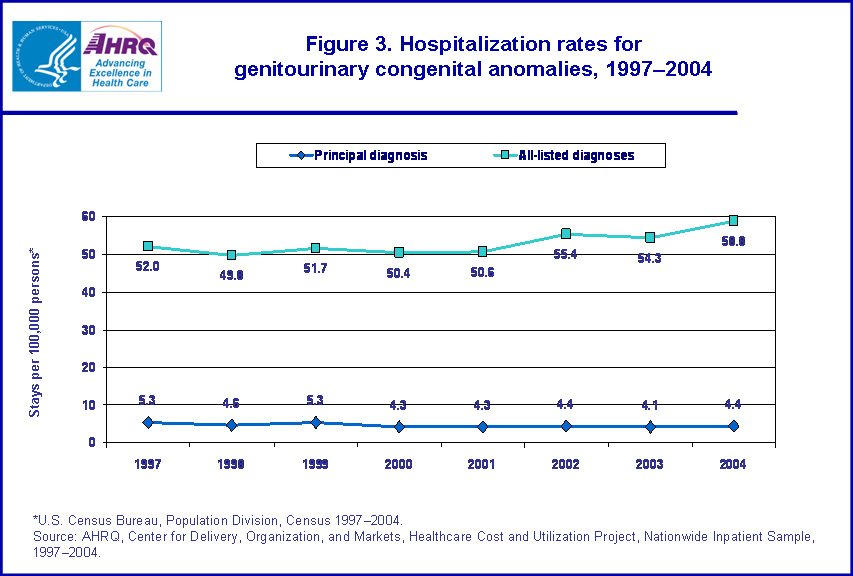
Table 2 highlights both general categories and specific birth defects that resulted in hospitalization. In 2004, cardiac and circulatory congenital anomalies accounted for 33.5 percent of birth defect hospitalizations, digestive congenital anomalies accounted for 18.5 percent of birth defect stays, and congenital genitourinary and nervous system anomalies accounted for 9.3 percent and 5.0 percent, respectively, of admissions for birth defects. All remaining birth defects accounted for about 33.8 percent of stays. In 2004, pyloric stenosis (a narrowing of the stomach that leads to vomiting) was the most common specific congenital anomaly causing hospitalization, accounting for 9.0 percent of all stays for birth defects. This was followed by atrial septal defects (a hole between the two smaller chambers in the heart) and spondylolisthesis (a condition where one vertebra slips forward), each of which resulted in about 6 percent of all hospitalizations for birth defects. Other common birth defects included cleft lip with or without cleft palate, obstructive genitourinary defects, ventricular septal defects (a hole between the two larger chambers of the heart), congenital anomalies of the skull and facial bones, cerebrovascular anomalies (such as cerebral aneurysm), cleft palate without cleft lip, and foot deformities. Among the most common birth defects, the longest hospital stays were for patent ductus arteriosus (a persistent connection between the aorta and the pulmonary artery that normally closes shortly after birth, 12.7 days), tetralogy of fallot (a complex heart defect that is the most common cause of "blue baby syndrome," 11.4 days), and rectal and large intestine atresia/stenosis (absence, closure, or constriction of the large intestine or rectum, 9.1 days). Males predominated among hospitalizations for birth defects such as coarctation of the aorta (narrowing of the aorta, 63.0 percent), pyloric stenosis (80.8 percent male), Meckel’s diverticulum (a pouch of tissue on the wall of the small intestine, 70.4 percent), and pectus excavatum (sunken or funnel chest, 79.1 percent male). Conversely, females accounted for more hospitalizations for patent ductus arteriosus (39.5 percent male), congenital hip deformities (28.6 percent male), and spondylolisthesis (38.7 percent male). Some birth defects are discovered and treated at birth or during infancy and early childhood. Other birth defects may be discovered much later. The mean age for patients admitted for the treatment of pyloric stenosis, rectal and large intestine atresia/stenosis, cleft palate without cleft lip, and tetralogy of fallot was less than 3 years. However, for other conditions such as Meckel’s diverticulum, atrial septal defect, cerebrovascular anomalies, polycystic kidney (clusters of cysts forming on the kidneys), and spondylolisthesis, patients were, on average, 30 years or older. The highest aggregate costs were for stays related to cardiac and circulatory congenital anomalies, which accounted for about $1.4 billion–more than half of all hospital costs for birth defects. Similarly, the highest mean costs and the highest death rates were for cardiac and circulatory anomalies. Birth defects commonly noted during hospitalization Table 3 lists birth defect diagnoses commonly noted during hospitalization as the principal or secondary diagnosis. In 2004, almost 86,300 hospital stays occurred among patients with an atrial septal defect, while patients with patent ductus arteriosus accounted for 59,500 admissions. About 40,000 hospital stays occurred among patients noted to have congenital pigmentary anomaly of the skin (discolorations of skin or hair), ventricular septal defect, or Down’s syndrome. Other birth defects commonly noted as either the principal reason for admission or a coexisting condition included spina bifida (incomplete development of the brain, spinal cord, and/or their protective coverings), polycystic kidney, spondylolisthesis, undescended testicle, and obstructive genitourinary defects. Changes in hospitalizations for birth defects, 1997–2004 Figures 1 through 4 demonstrate changes in the hospitalization rates for general categories of birth defects between 1997 and 2004. When listed as the principal reason for admission, the hospitalization rate for cardiac and circulatory congenital anomalies remained relatively stable between 1997 and 2004 (figure 1). However, when noted as either the principal or coexisting condition (i.e., all-listed diagnoses), the hospitalization rate for these birth defects increased by 28.5 percent. Similarly, figure 2 shows that the hospitalization rate for all-listed digestive congenital anomalies increased significantly between 1997 and 2004–rising by 25.3 percent. Between 1997 and 2004, the hospitalization rate for genitourinary congenital anomalies decreased by 17.0 percent when listed as the principal diagnosis, but increased by 13.0 percent when noted as either a principal or coexisting condition (figure 3). When noted as the principal reason for treatment, the hospitalization rate for nervous system congenital anomalies remained stable over the eight-year time period, even though all-listed diagnoses increased by 11.9 percent (figure 4). Data Source The estimates in this Statistical Brief are based on data from the HCUP 2004 Nationwide Inpatient Sample (NIS). Historical data were drawn from the 1997, 1998, 1999, 2000, 2001, 2002, and 2003 NIS. Supplemental sources included data on national population estimates from Table 8: Annual Estimates of the Population for the United States, Regions, and Divisions: April 1, 2000 to July 1, 2005 (NST-EST2005-08), Population Division, U.S. Census Bureau, Release Date: December 22, 2005 (http://www.census.gov/popest/) and Historical National Population Estimates: July 1, 1900 to July 1, 1999, Population Division, U.S. Census Bureau, Release Date: April 11, 2000 (http://www.census.gov/popest/). Definitions Types of hospitals included in HCUP HCUP is based on data from community hospitals, defined as short-term, non-Federal, general and other hospitals, excluding hospital units of other institutions (e.g., prisons). HCUP data include OB-GYN, ENT, orthopedic, cancer, pediatric, public, and academic medical hospitals. They exclude long-term care, rehabilitation, psychiatric, and alcoholism and chemical dependency hospitals, but these types of discharges are included if they are from community hospitals. Unit of analysis The unit of analysis is the hospital discharge (i.e., the hospital stay), not a person or patient. This means that a person who is admitted to the hospital multiple times in one year will be counted each time as a separate "discharge" from the hospital. Costs and charges Total hospital charges were converted to costs using HCUP cost-to-charge ratios based on hospital accounting reports from the Centers for Medicare and Medicaid Services (CMS).2 Costs will tend to reflect the actual costs of production, while charges represent what the hospital billed for the case. For each hospital, a hospital-wide cost-to-charge ratio is used because detailed charges are not available across all HCUP States. Hospital charges reflect the amount the hospital charged for the entire hospital stay and does not include professional (physician) fees. For the purposes of this Statistical Brief, costs are reported to the nearest hundreds. Diagnoses, ICD-9-CM, and Clinical Classifications Software (CCS) The principal diagnosis is that condition established after study to be chiefly responsible for the patient’s admission to the hospital. Secondary diagnoses are concomitant conditions that coexist at the time of admission or that develop during the stay. All-listed diagnoses include the principal diagnosis plus these additional secondary conditions. ICD-9-CM is the International Classification of Diseases, Ninth Revision, Clinical Modification, which assigns numeric codes to diagnoses. There are about 12,000 ICD-9-CM diagnosis codes. CCS categorizes ICD-9-CM diagnoses into 260 clinically meaningful categories.3 This "clinical grouper" makes it easier to quickly understand patterns of diagnoses and procedures. Discharge status Discharge status indicates the disposition of the patient at discharge from the hospital, and includes the following six categories: routine (to home), transfer to another short-term hospital, other transfers (including skilled nursing facility, intermediate care, and another type of facility such as a nursing home), home health care, against medical advice (AMA), or died in the hospital. About the NIS The HCUP Nationwide Inpatient Sample (NIS) is a nationwide database of hospital inpatient stays. The NIS is nationally representative of all community hospitals (i.e., short-term, non-Federal, non-rehabilitation hospitals). The NIS is a sample of hospitals and includes all patients from each hospital, regardless of payer. It is drawn from a sampling frame that contains hospitals comprising 90 percent of all discharges in the United States. The vast size of the NIS allows the study of topics at both the national and regional levels for specific subgroups of patients. In addition, NIS data are standardized across years to facilitate ease of use. About HCUP HCUP is a family of powerful health care databases, software tools, and products for advancing research. Sponsored by the Agency for Healthcare Research and Quality (AHRQ), HCUP includes the largest all- payer encounter-level collection of longitudinal health care data (inpatient, ambulatory surgery, and emergency department) in the United States, beginning in 1988. HCUP is a Federal-State-Industry Partnership that brings together the data collection efforts of many organizations–such as State data organizations, hospital associations, private data organizations, and the Federal government–to create a national information resource. For more information about HCUP, visit http://www.hcup-us.ahrq.gov/. HCUP would not be possible without the contributions of the following data collection Partners from across the United States: Arizona Department of Health Services Arkansas Department of Health & Human Services California Office of Statewide Health Planning & Development Colorado Health & Hospital Association Connecticut Integrated Health Information (Chime, Inc.) Florida Agency for Health Care Administration Georgia GHA: An Association of Hospitals & Health Systems Hawaii Health Information Corporation Illinois Health Care Cost Containment Council and Department of Public Health Indiana Hospital&Health Association Iowa Hospital Association Kansas Hospital Association Kentucky Cabinet for Health and Family Services Maryland Health Services Cost Review Commission Massachusetts Division of Health Care Finance and Policy Michigan Health & Hospital Association Minnesota Hospital Association Missouri Hospital Industry Data Institute Nebraska Hospital Association Nevada Division of Health Care Financing and Policy, Department of Human Resources New Hampshire Department of Health & Human Services New Jersey Department of Health and Senior Services New York State Department of Health North Carolina Department of Health and Human Services Ohio Hospital Association Oregon Office for Oregon Health Policy and Research and Oregon Association of Hospitals and Health Systems Rhode Island Department of Health South Carolina State Budget & Control Board South Dakota Association of Healthcare Organizations Tennessee Hospital Association Texas Department of State Health Services Utah Department of Health Vermont Association of Hospitals and Health Systems Virginia Health Information Washington State Department of Health West Virginia Health Care Authority Wisconsin Department of Health and Family Services For additional HCUP statistics, visit HCUPnet, our interactive query system at https://datatools.ahrq.gov/hcupnet. For More Information For a detailed description of HCUP and more information on the design of the NIS and methods to calculate estimates, please refer to the following publications: Steiner, C., Elixhauser, A., Schnaier, J. The Healthcare Cost and Utilization Project: An Overview. Effective Clinical Practice 5(3):143–51, 2002. Design of the HCUP Nationwide Inpatient Sample, 2004. Online. August 8, 2006. U.S. Agency for Healthcare Research and Quality. http://www.hcup-us.ahrq.gov/db/nation/nis/reports/NIS_2004_Design_Report.pdf Houchens, R., Elixhauser, A. Final Report on Calculating Nationwide Inpatient Sample (NIS) Variances, 2001. HCUP Methods Series Report #2003-2. Online. June 2005 (revised June 6, 2005). U.S. Agency for Healthcare Research and Quality. http://www.hcup-us.ahrq.gov/reports/methods/2003_02.pdf Houchens R. L., and Elixhauser, A. Using the HCUP Nationwide Inpatient Sample to Estimate Trends. (Updated for 1988-2004). HCUP Methods Series Report #2006-05. Online. August 18, 2006. U.S. Agency for Healthcare Research and Quality. http://www.hcup-us.ahrq.gov/reports/methods/2006_05_NISTrendsReport_1988-2004.pdf Suggested Citation Russo, C. A. (Thomson Medstat) and Elixhauser, A. (AHRQ). Hospitalizations for Birth Defects, 2004. HCUP Statistical Brief #24. January 2007. U.S. Agency for Healthcare Research and Quality, Rockville, MD. http://www.hcup-us.ahrq.gov/reports/statbriefs/sb24.pdf *** AHRQ welcomes questions and comments from readers of this publication who are interested in obtaining more information about access, cost, use, financing, and quality of health care in the United States. We also invite you to tell us how you are using this Statistical Brief and other HCUP data and tools, and to share suggestions on how HCUP products might be enhanced to further meet your needs. Please e-mail us at hcup@ahrq.gov or send a letter to the address below:Irene Fraser, Ph.D., Director Center for Delivery, Organization, and Markets Agency for Healthcare Research and Quality 540 Gaither Road Rockville, MD 20850 1Centers for Disease Control and Prevention, National Center on Birth Defects and Developmental Disabilities. http://www.cdc.gov/ncbddd/birthdefects/index.html. (Accessed on December 21, 2006). 2HCUP Cost-to-Charge Ratio Files (CCR). Healthcare Cost and Utilization Project (HCUP). 2001–2003. U.S. Agency for Healthcare Research and Quality, Rockville, MD. http://www.hcup-us.ahrq.gov/db/state/costtocharge.jsp.. 3HCUP Clinical Classifications Software (CCS). Healthcare Cost and Utilization Project (HCUP). August 2006. U.S. Agency for Healthcare Research and Quality, Rockville, MD. http://www.hcup-us.ahrq.gov/toolssoftware/ccs/ccs.jsp. |
| Table 1. Hospitalizations for birth defects compared with hospitalizations for all other conditions, 2004* | ||
| Hospital stays for birth defect* | All other hospital stays† | |
| Number of hospital stays (percentage of all hospital stays) | 139,100 (0.4%) | 33,759,500 (99.6%) |
| Mean length of stay, days | 6.3 | 4.9 |
| Mean hospital cost | $18,600 | $8,200 |
| Aggregate costs (percentage of total national cost) | $2.6 billion (0.9%) | $276.4 billion (99.1%) |
| Percent male | 53.3% | 46.5% |
| Mean age | 17.6 | 49.9 |
| Percent died in hospital | 1.3% | 2.4% |
| *Based on principal diagnosis. †Excludes stays for obstetrical conditions. Source: AHRQ, Center for Delivery, Organization, and Markets, Healthcare Cost and Utilization Project, Nationwide Inpatient Sample, 2004. | ||
| Table 2. Birth defects commonly causing hospitalization, 2004* | ||||||||
| Principal diagnosis | Total number of hospital stays | Percentage of all stays for birth defects | Mean length of stay (days) | Mean costs (dollars) | Aggregate costs (dollars) | Percent male | Mean age | Percent died |
| All cardiac and circulatory congenital anomalies | 46,500 | 33.5% | 8.2 | $29,600 | $1,368,822,600 | 50.9% | 19.8 | 2.6% |
| Cerebrovascular anomalies | 3,500 | 2.5% | 4.7 | $18,800 | 65,980,500 | 50.7% | 39.4 | 1.0% |
| Tetralogy of fallot | 2,500 | 1.8% | 11.4 | $40,100 | 100,735,900 | 54.0% | 2.7 | 2.2% |
| Ventricular septal defect | 3,700 | 2.7% | 8.1 | $27,900 | 104,435,100 | 50.8% | 5.8 | 1.6% |
| Atrial septal defect | 8,800 | 6.4% | 3.1 | $15,000 | 132,584,700 | 40.7% | 38.0 | 0.3% |
| Patent ductus arteriosus | 2,500 | 1.8% | 12.7 | $31,300 | 77,595,700 | 39.5% | 3.5 | 1.6% |
| Coarctation of aorta | 2,600 | 1.9% | 8.7 | $29,300 | 75,468,300 | 63.0% | 6.4 | 1.2% |
| All digestive congenital anomalies | 25,800 | 18.5% | 6.3 | $11,700 | $303,173,100 | 67.8% | 7.5 | 0.4% |
| Pyloric stenosis | 12,500 | 9.0% | 2.5 | $4,100 | $51,256,200 | 80.8% | 0.0 | 0.0% |
| Rectal and large intestine atresia/stenosis | 2,100 | 1.5% | 9.1 | $18,400 | $37,856,000 | 56.5% | 0.6 | 0.6% |
| Meckel's diverticulum | 2,400 | 1.7% | 6.1 | $11,800 | $28,174,000 | 70.4% | 31.7 | 0.2% |
| All genitourinary congenital anomalies | 12,900 | 9.3% | 4.1 | $8,900 | $114,709,700 | 52.0% | 23.3 | 0.3% |
| Obstructive genitourinary defect | 4,100 | 3.0% | 3.3 | $7,400 | $30,548,200 | 59.4% | 14.0 | 0.0% |
| Polycystic kidney | 2,700 | 2.0% | 4.8 | $11,900 | $32,434,300 | 51.7% | 44.6 | 0.4% |
| All nervous system congenital anomalies | 6,900 | 5.0% | 7.5 | $16,200 | $112,164,200 | 44.8% | 15.2 | 1.8% |
| All other congenital anomalies | 47,000 | 33.8% | 5.0 | $14,400 | $667,198,000 | 49.1% | 19.8 | 0.7% |
| Cleft palate without cleft lip | 2,900 | 2.1% | 2.1 | $5,400 | $15,506,700 | 49.8% | 2.4 | 0.0% |
| Congenital hip deformity | 2,200 | 1.5% | 3.6 | $12,500 | $26,930,200 | 28.6% | 27.4 | 0.0% |
| Congenital anomalies of skull and facial bones | 3,700 | 2.6% | 5.5 | $16,800 | $61,329,500 | 60.9% | 3.8 | 0.3% |
| Spondylolisthesis | 8,000 | 5.7% | 4.1 | $18,800 | $149,954,500 | 38.7% | 56.3 | 0.0% |
| Cleft lip with or without cleft palate | 4,900 | 3.6% | 1.9 | $5,500 | $27,155,800 | 59.4% | 4.2 | 0.1% |
| Pectus excavatum | 1,700 | 1.2% | 4.4 | $9,900 | $16,621,600 | 79.1% | 14.8 | 0.0% |
| Congenital anomalies of larynx, trachea and bronchus | 2,300 | 1.7% | 7.5 | $13,900 | $32,646,500 | 58.5% | 3.9 | 0.2% |
| Foot deformities | 2,900 | 2.1% | 1.8 | $5,900 | $16,873,900 | 56.0% | 11.6 | 0.0% |
| All birth defects | 139,100 | 100.0% | 6.3 | $18,600 | $2,566,067,700 | 53.3% | 17.6 | 1.3% |
| *Based on principal diagnosis. Birth defects with less than 2,000 hospitalizations are not shown. Source: AHRQ, Center for Delivery, Organization, and Markets, Healthcare Cost and Utilization Project, Nationwide Inpatient Sample, 2004. | ||||||||
| Table 3. Birth defects commonly noted during hospitalization, 2004* | ||
| Rank | All-listed diagnoses | Total number of hospital stays |
| 1 | Atrial septal defect | 86,300 |
| 2 | Patent ductus arteriosus | 59,500 |
| 3 | Congenital pigmentary anomalies of skin | 40,900 |
| 4 | Ventricular septal defect | 40,000 |
| 5 | Down's syndrome | 38,000 |
| 6 | Spina bifida | 28,300 |
| 7 | Polycystic kidney | 27,300 |
| 8 | Spondylolisthesis | 23,200 |
| 9 | Undescended testicle | 20,900 |
| 10 | Obstructive genitourinary defect | 20,100 |
| 11 | Hypospadias and epispadias | 18,100 |
| 12 | Congenital anomalies of skull and facial bones | 17,500 |
| 13 | Foot deformities | 16,700 |
| 14 | Polydactyly (extra digits) and syndactyly (webbing between digits) | 16,100 |
| 15 | Pulmonary artery anomalies | 15,700 |
| 16 | Congenital hydrocephalus | 13,300 |
| 17 | Congenital insufficiency of aortic valve | 13,200 |
| 18 | Pyloric stenosis | 13,200 |
| 19 | Congenital anomalies of larynx, trachea and bronchus | 12,900 |
| 20 | Persistent fetal circulation | 12,400 |
| *Based on all-listed diagnoses. Source: AHRQ, Center for Delivery, Organization, and Markets, Healthcare Cost and Utilization Project, Nationwide Inpatient Sample, 2004. | ||
|
| Internet Citation: Statistical Brief #24. Healthcare Cost and Utilization Project (HCUP). January 2007. Agency for Healthcare Research and Quality, Rockville, MD. hcup-us.ahrq.gov/reports/statbriefs/sb24.jsp. |
| Are you having problems viewing or printing pages on this website? |
| If you have comments, suggestions, and/or questions, please contact hcup@ahrq.gov. |
| If you are experiencing issues related to Section 508 accessibility of information on this website, please contact hcup@ahrq.gov. |
| Privacy Notice, Viewers & Players |
| Last modified 1/17/07 |