STATISTICAL BRIEF #239 |
May 2018
Audrey J. Weiss, Ph.D., and Kevin C. Heslin, Ph.D. Introduction The opioid epidemic in the United States is receiving significant attention at both the Federal and State levels. The Agency for Healthcare Research and Quality (AHRQ) is publishing a series of Statistical Briefs that provide descriptive information on opioid-related hospital use nationally and by State. In prior entries in this series, AHRQ reported the following:
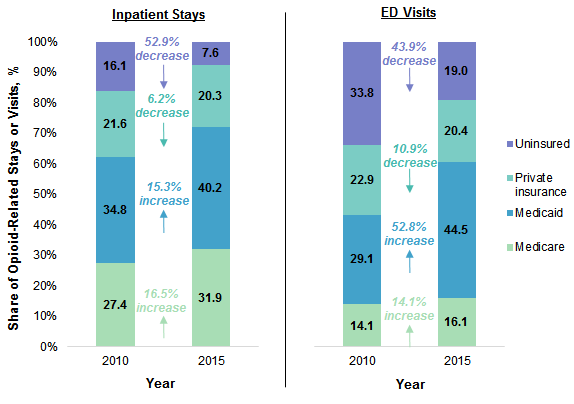
Findings National and State-level share of opioid-related inpatient stays and ED visits by payer, 2010 and 2015 Figure 1 presents the national distribution of opioid-related inpatient stays and emergency department (ED) visits by expected primary payer in 2010 and 2015. |
|
|
Figure 1. Sharea of opioid-related inpatient stays and ED visits by payer, 2010 and 2015
Abbreviation: ED, emergency department Share of opioid-related inpatient stays and ED visits by payer, 2010 and 2015
Stacked bar chart that shows the share of opioid inpatient stays or emergency department visits by payer in 2010 and 2015. Inpatient stays: Uninsured: 2010, 16.1; 2015, 7.6—cumulative decrease of 52.9%. Private insurance: 2010, 21.6; 2015, 20.3—cumulative decrease of 6.2%. Medicaid: 2010, 34.8; 2015, 40.2—cumulative increase of 15.3%. Medicare: 2010, 27.4; 2015, 31.9—cumulative increase of 16.5%. ED visits: Uninsured: 2010, 33.8; 2015, 19.0—cumulative decrease of 43.9%. Private insurance: 2010, 22.9; 2015, 20.4—cumulative decrease of 10.9%. Medicaid: 2010, 29.1; 2015, 44.5—cumulative increase of 52.8%. Medicare: 2010, 14.1; 2015, 16.1—cumulative increase of 14.1%.
|
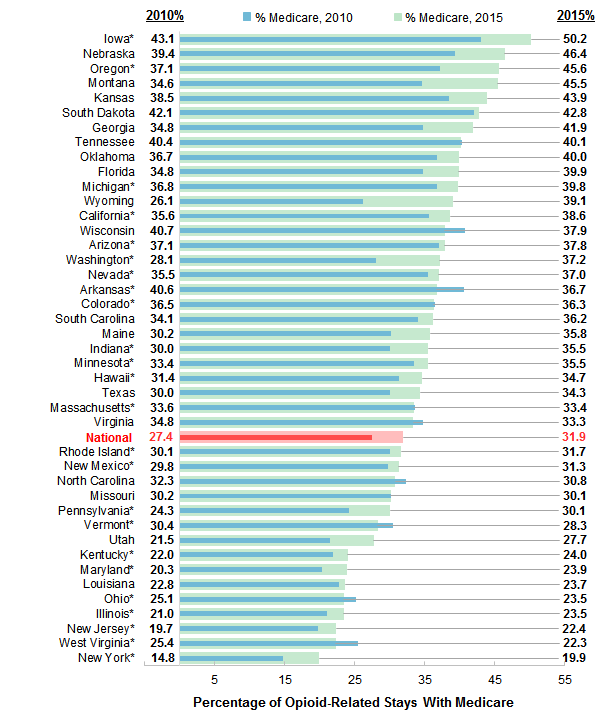
Share of opioid-related inpatient stays by payer, by State, 2010 and 2015 Figures 2-5 present the percentage of opioid-related stays for 42 States in 2010 and 2015 with an expected primary payer of Medicare (Figure 2), Medicaid (Figure 3), private insurance (Figure 4), and uninsured (Figure 5). For each State, the percentage of stays in 2010 is shown in the left column and is represented by the thin blue line; the percentage of stays in 2015 is shown in the right column and is represented by the wide green line. The percentage of opioid-related stays nationally (encompassing all States that contributed data to HCUP in 2010 or 2015) is provided for comparison. Appendix A lists the percentage change in share of opioid-related inpatient stays by payer between 2010 and 2015 for each State. Figure 2 presents the percentage of opioid-related inpatient stays with Medicare as the expected primary payer among the 42 States that provided data in 2010 and 2015. States are ordered according to their percentage of opioid-related stays with Medicare in 2015. |
|
Figure 2. Percentage of opioid-related inpatient stays with Medicare by State, 2010 and 2015
Note: An asterisk denotes States that expanded Medicaid prior to fiscal year 2015, with the exception of Indiana, which expanded Medicaid on February 1, 2015, and Pennsylvania, which expanded Medicaid on January 1, 2015. Bar chart that shows the percentage of opioid-related inpatient stays with Medicare by State for 2010 and 2015. Data are provided in Supplementary Table 1. |
|
|
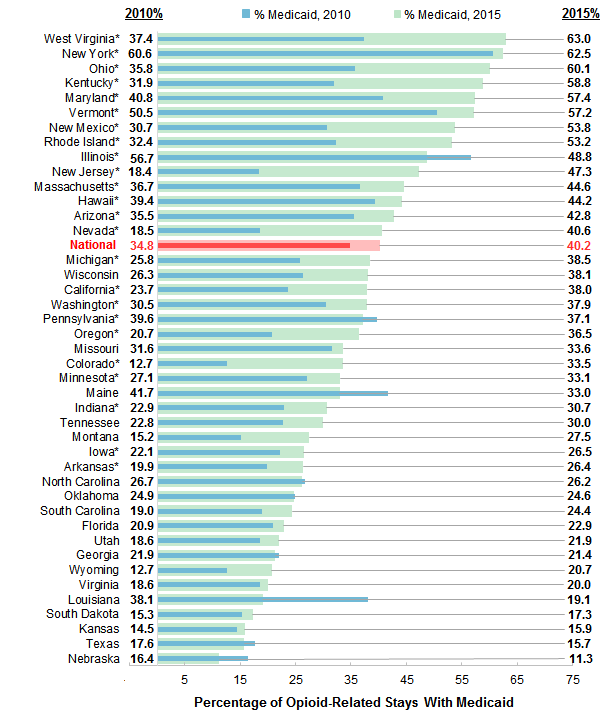
Figure 3. Percentage of opioid-related inpatient stays with Medicaid by State, 2010 and 2015
Note: An asterisk denotes States that expanded Medicaid prior to fiscal year 2015, with the exception of Indiana, which expanded Medicaid on February 1, 2015, and Pennsylvania, which expanded Medicaid on January 1, 2015. Bar chart that shows the percentage of opioid-related inpatient stays with Medicaid by State for 2010 and 2015. Data are provided in Supplementary Table 1. |
|
|
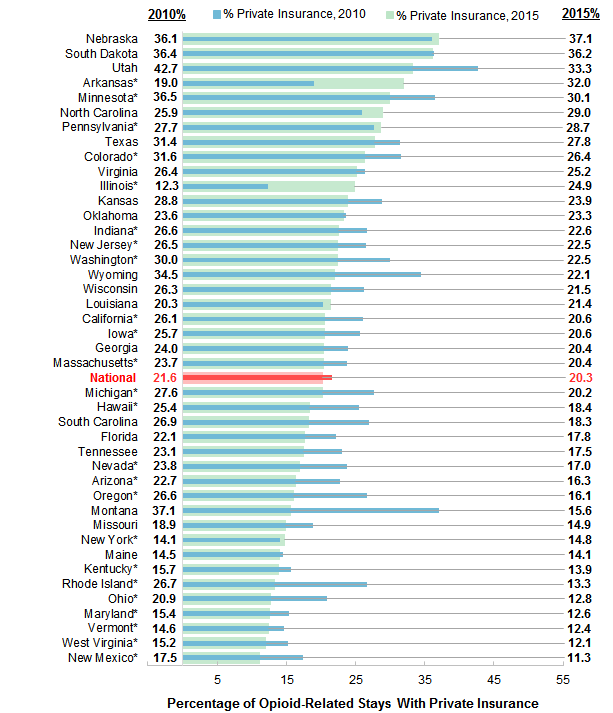
Figure 4. Percentage of opioid-related inpatient stays with private insurance by State, 2010 and 2015
Note: An asterisk denotes States that expanded Medicaid prior to fiscal year 2015, with the exception of Indiana, which expanded Medicaid on February 1, 2015, and Pennsylvania, which expanded Medicaid on January 1, 2015. Bar chart that shows the percentage of opioid-related inpatient stays with private insurance by State for 2010 and 2015. Data are provided in Supplementary Table 1.
|
|
|
Figure 5. Percentage of opioid-related inpatient stays that were uninsured by State, 2010 and 2015
Note: An asterisk denotes States that expanded Medicaid prior to fiscal year 2015, with the exception of Indiana, which expanded Medicaid on February 1, 2015, and Pennsylvania, which expanded Medicaid on January 1, 2015. Bar chart that shows the percentage of opioid-related inpatient stays that were uninsured by State for 2010 and 2015. Data are provided in Supplementary Table 1. |
Figures 6-9 present the share of opioid-related ED visits for 23 States in 2010 and 2015 with an expected primary payer of Medicare (Figure 6), Medicaid (Figure 7), private insurance (Figure 8), and uninsured (Figure 9). For each State, the percentage of visits in 2010 is shown in the left column and is represented by the thin blue line; the percentage of visits in 2015 is shown in the right column and is represented by the wide green line. The percentage of opioid-related ED visits nationally (encompassing all States that contributed data to HCUP in 2010 or 2015) is provided for comparison. Appendix B lists the percentage change in share of opioid-related ED visits by payer between 2010 and 2015 for each State. Figure 6 presents the percentage of opioid-related ED visits with Medicare as the expected primary payer among the 23 States that provided data in 2010 and 2015. States are ordered according to their percentage of opioid-related ED visits with Medicare in 2015. |
|
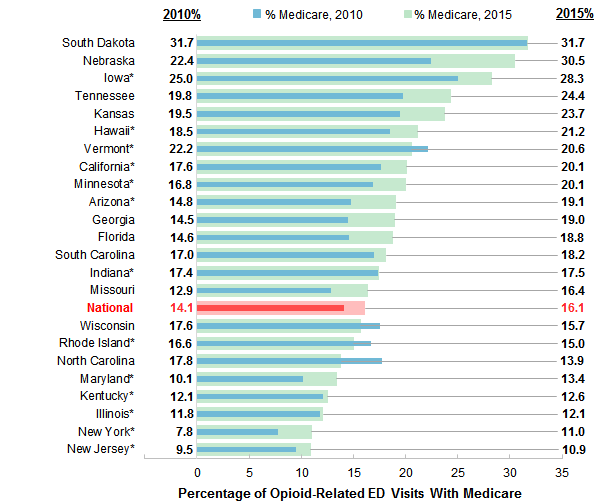
Figure 6. Percentage of opioid-related ED visits with Medicare by State, 2010 and 2015
Abbreviation: ED, emergency department Bar chart that shows the percentage of opioid-related ED visits with Medicare by State for 2010 and 2015. Data are provided in Supplementary Table 2. |
|
|
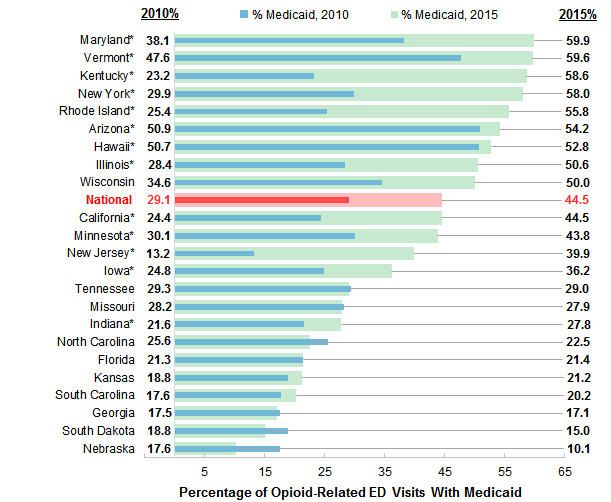
Figure 7. Percentage of opioid-related ED visits with Medicaid by State, 2010 and 2015
Abbreviation: ED, emergency department Bar chart that shows the percentage of opioid-related ED visits with Medicaid by State for 2010 and 2015. Data are provided in Supplementary Table 2. |
|
|
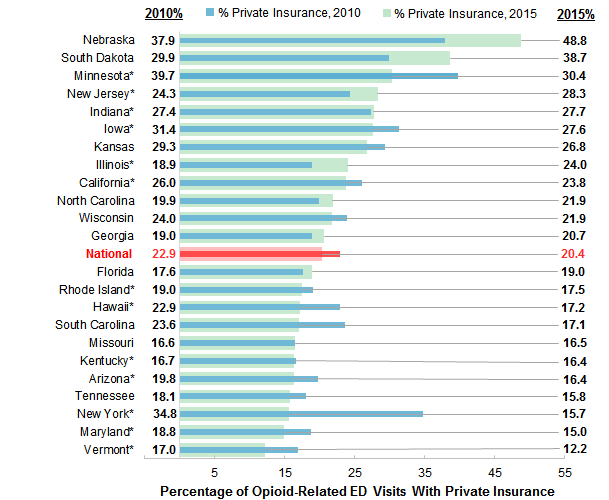
Figure 8. Percentage of opioid-related ED visits with private insurance by State, 2010 and 2015
Abbreviation: ED, emergency department Bar chart that shows the percentage of opioid-related ED visits with private insurance by State for 2010 and 2015. Data are provided in Supplementary Table 2. |
|
|
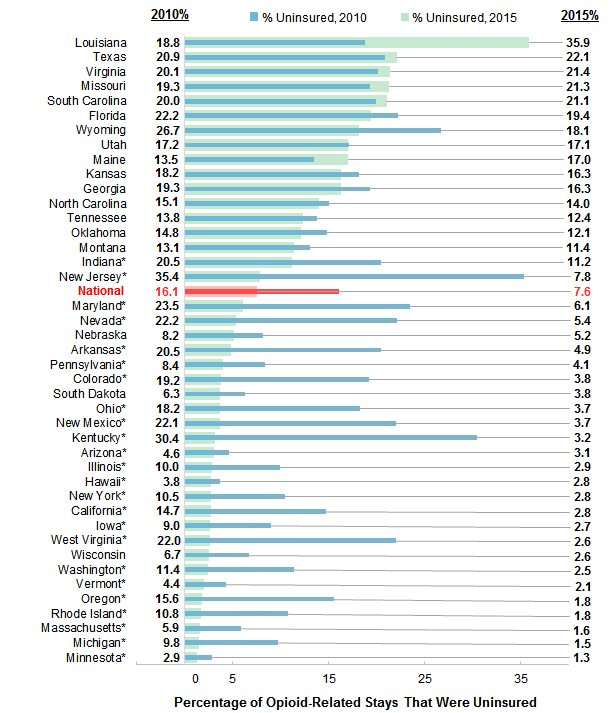
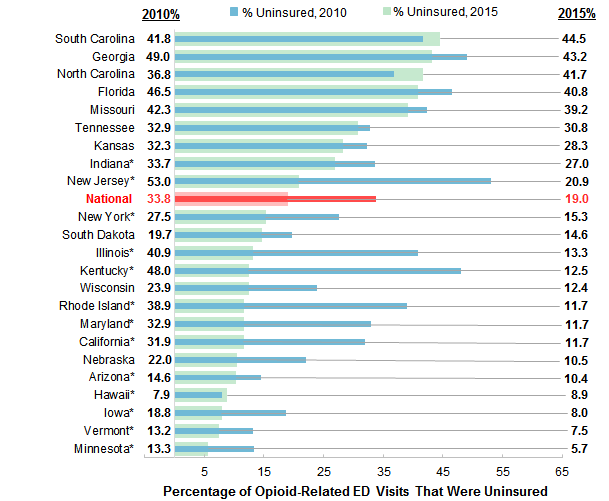
Figure 9. Percentage of opioid-related ED visits that were uninsured by State, 2010 and 2015
Abbreviation: ED, emergency department Bar chart that shows the percentage of opioid-related ED visits that were uninsured by State for 2010 and 2015. Data are provided in Supplementary Table 2. |
|
| Appendix A. Percentage change in share of opioid-related inpatient stays by State, 2010 versus 2015 | |||||
| State | Medicare | Medicaid | Private insurance | Uninsured | |
|---|---|---|---|---|---|
| National | 16.5 | 15.3 | -6.2 | -52.9 | |
| Arizona* | 2.0 | 20.3 | -28.1 | -33.6 | |
| Arkansas* | -9.5 | 32.8 | 67.9 | -76.2 | |
| California* | 8.6 | 60.5 | -21.0 | -81.1 | |
| Colorado* | -0.6 | 163.6 | -16.3 | -80.4 | |
| Florida | 14.8 | 9.4 | -19.7 | -12.4 | |
| Georgia | 20.6 | -2.6 | -14.7 | -15.8 | |
| Hawaii* | 10.4 | 12.0 | -27.8 | -25.3 | |
| Illinois* | 11.5 | -13.9 | 102.4 | -71.2 | |
| Indiana* | 18.5 | 33.8 | -15.0 | 45.4 | |
| Iowa* | 16.5 | 19.7 | -19.9 | -70.3 | |
| Kansas | 14.1 | 9.2 | -16.9 | -10.3 | |
| Kentucky* | 9.4 | 84.4 | -11.2 | -89.5 | |
| Louisiana* | 3.9 | -50.0 | 5.6 | 90.5 | |
| Maine | 18.4 | -20.9 | -2.5 | 26.0 | |
| Maryland* | 17.9 | 40.7 | -18.1 | -74.2 | |
| Massachusetts* | -0.7 | 21.5 | -14.1 | -72.8 | |
| Michigan* | 8.2 | 49.2 | -26.8 | -84.7 | |
| Minnesota* | 6.2 | 22.2 | -17.7 | -55.0 | |
| Missouri* | -0.2 | 6.4 | -20.9 | 10.4 | |
| Montana* | 31.5 | 80.9 | -57.9 | 12.8 | |
| Nebraska | 17.9 | -31.1 | 2.8 | -36.5 | |
| Nevada | 4.1 | 119.4 | -28.5 | -75.8 | |
| New Jersey* | 13.5 | 157.5 | -15.2 | -77.8 | |
| New Mexico* | 5.0 | 75.3 | -35.5 | -83.4 | |
| New York* | 34.5 | 3.2 | 4.6 | -73.3 | |
| North Carolina | -4.7 | -1.8 | 11.9 | -7.1 | |
| Ohio* | -6.6 | -68.0 | -38.7 | -79.9 | |
| Oklahoma | 8.9 | -1.0 | -1.3 | -18.2 | |
| Oregon* | 22.9 | 76.4 | 39.6 | -88.2 | |
| Pennsylvania* | 24.1 | -6.4 | 3.8 | -51.8 | |
| Rhode Island* | 5.2 | 64.5 | -50.1 | -83.6 | |
| South Carolina | 6.3 | 28.4 | -32.1 | 5.5 | |
| South Dakota | 1.7 | 13.2 | -0.6 | -40.1 | |
| Tennessee | -0.5 | 31.6 | -24.1 | -10.2 | |
| Texas | 14.3 | -10.8 | -11.6 | 5.9 | |
| Utah | 28.8 | 17.9 | -22.1 | -0.6 | |
| Vermont* | -7.1 | 13.2 | -15.1 | -52.7 | |
| Virginia | -4.3 | 7.5 | -4.6 | 6.4 | |
| Washington* | 32.2 | 24.1 | -25.1 | -78.1 | |
| West Virginia* | -12.3 | 68.6 | -20.4 | -88.1 | |
| Wisconsin | -7.1 | 44.9 | -18.1 | -61.9 | |
| Wyoming | 49.5 | 62.9 | -35.9 | -32.0 | |
| Note: An asterisk denotes States that expanded Medicaid prior to fiscal year 2015, with the exception of Indiana, which expanded Medicaid on February 1, 2015, and Pennsylvania, which expanded Medicaid on January 1, 2015. Source: Agency for Healthcare Research and Quality (AHRQ), Center for Delivery, Organization, and Markets, Healthcare Cost and Utilization Project (HCUP), HCUP Fast Stats, Opioid-Related Hospital Use (https://datatools.ahrq.gov/hcup-fast-stats) based on the HCUP National (Nationwide) Inpatient Sample (NIS) and the HCUP State Inpatient Databases (SID) | |||||
| Appendix B. Percentage change in share of opioid-related ED visits by State, 2010 versus 2015 | |||||
| State | Medicare | Medicaid | Private insurance | Uninsured | |
|---|---|---|---|---|---|
| National | 14.1 | 52.8 | -10.9 | -43.9 | |
| Arizona* | 29.1 | 6.5 | -17.2 | -29.0 | |
| California* | 14.3 | 81.9 | -8.7 | -63.5 | |
| Florida | 28.8 | 0.5 | 7.7 | -12.2 | |
| Georgia | 30.7 | -2.3 | 8.9 | -11.7 | |
| Hawaii* | 14.4 | 4.1 | -25.0 | -12.3 | |
| Illinois* | 2.8 | 78.1 | 27.0 | -67.6 | |
| Indiana* | 0.8 | 28.6 | 1.3 | -19.8 | |
| Iowa* | 12.8 | 45.9 | -12.1 | -57.5 | |
| Kansas | 21.8 | 12.5 | -8.7 | -12.5 | |
| Kentucky* | 3.6 | 152.9 | -1.9 | -74.1 | |
| Maryland* | 32.3 | 57.1 | -20.5 | -64.4 | |
| Minnesota* | 19.3 | 45.6 | -23.5 | -57.3 | |
| Missouri | 27.0 | -1.0 | -0.1 | -7.5 | |
| Nebraska | 36.0 | -42.4 | 28.8 | -52.2 | |
| New Jersey* | 15.4 | 201.7 | 16.5 | -60.6 | |
| New York* | 41.6 | 93.9 | -54.9 | -44.4 | |
| North Carolina | -22.0 | -11.8 | 10.2 | 13.3 | |
| Rhode Island* | -9.8 | 119.4 | -7.9 | -69.9 | |
| South Carolina | 6.8 | 14.7 | -27.7 | 6.7 | |
| South Dakota | 0.1 | -20.3 | 29.5 | -25.6 | |
| Tennessee | 23.4 | 1.2 | -12.5 | -6.1 | |
| Vermont* | -7.1 | 25.2 | -28.1 | -42.9 | |
| Wisconsin | -10.6 | 44.6 | -8.7 | -48.0 | |
| Abbreviation: ED, emergency department Note: An asterisk denotes States that expanded Medicaid prior to fiscal year 2015, with the exception of Indiana, which expanded Medicaid on February 1, 2015. Source: Agency for Healthcare Research and Quality (AHRQ), Center for Delivery, Organization, and Markets, Healthcare Cost and Utilization Project (HCUP), HCUP Fast Stats, Opioid-Related Hospital Use (https://datatools.ahrq.gov/hcup-fast-stats) based on the HCUP National Emergency Department Sample (NEDS) and the HCUP State Emergency Department Databases (SEDD) | |||||
About Statistical Briefs
Healthcare Cost and Utilization Project (HCUP) Statistical Briefs provide basic descriptive statistics on a variety of topics using HCUP administrative healthcare data. Topics include hospital inpatient, ambulatory surgery, and emergency department use and costs, quality of care, access to care, medical conditions, procedures, and patient populations, among other topics. The reports are intended to generate hypotheses that can be further explored in other research; the reports are not designed to answer in-depth research questions using multivariate methods. Data Source The estimates in this Statistical Brief are based upon data from the HCUP 2010 and 2015 National (Nationwide) Inpatient Sample (NIS), Nationwide Emergency Department Sample (NEDS), State Inpatient Databases (SID), and State Emergency Department Databases (SEDD). The statistics were based upon information from HCUP Fast Stats, a free, online tool that provides users with easy access to the latest HCUP-based statistics for health information topics, including opioid-related hospital use.7 Emergency department (ED) visits (State and national) are restricted to those ED visits that do not result in an admission to the same hospital. ED visits resulting in admission to the same hospital are included in the inpatient stay statistics. Inpatient statistics from HCUP Fast Stats were available for the following 42 States in 2010 and 2015: Arizona, Arkansas, California, Colorado, Florida, Georgia, Hawaii, Illinois, Indiana, Iowa, Kansas, Kentucky, Louisiana, Maine, Maryland, Massachusetts, Michigan, Minnesota, Missouri, Montana, Nebraska, Nevada, New Jersey, New Mexico, New York, North Carolina, Ohio, Oklahoma, Oregon, Pennsylvania, Rhode Island, South Carolina, South Dakota, Tennessee, Texas, Utah, Vermont, Virginia, Washington, West Virginia, Wisconsin, and Wyoming. ED statistics from HCUP Fast Stats were available for the following 23 States in 2010 and 2015: Arizona, California, Florida, Georgia, Hawaii, Illinois, Indiana, Iowa, Kansas, Kentucky, Maryland, Minnesota, Missouri, Nebraska, New Jersey, New York, North Carolina, Rhode Island, South Carolina, South Dakota, Tennessee, Vermont, and Wisconsin. Definitions Diagnoses and ICD-9-CM The principal diagnosis is that condition established after study to be chiefly responsible for the patient's admission to the hospital. Secondary diagnoses are concomitant conditions that coexist at the time of admission or develop during the stay. All-listed diagnoses include the principal diagnosis plus these additional secondary conditions. ICD-9-CM is the International Classification of Diseases, Ninth Revision, Clinical Modification, which assigns numeric codes to diagnoses. There are approximately 14,000 ICD-9-CM diagnosis codes. Case definition Opioid-related hospital use was identified using the following all-listed ICD-9-CM diagnosis codes:
These codes include opioid-related use stemming from illicit opioids such as heroin, illegal use of prescription opioids, and the use of opioids as prescribed. Each type of opioid use is important for understanding and addressing the opioid epidemic in the United States.8 Although there may be interest in examining how much each type of opioid use contributes to the overall opioid problem, many of the opioid-related codes under the ICD-9-CM clinical coding system do not allow heroin-related cases to be explicitly identified (e.g., in the 304.0x series, heroin is not distinguished from other opioids). In addition, the codes do not distinguish between illegal use of prescription drugs and their use as prescribed. The statistics for share of opioid-related inpatient stays and ED visits reported in this Statistical Brief are rounded to the nearest tenth. The statistics reported for the percentage change in share are calculated based on nonrounded share values. Types of hospitals included in the HCUP National (Nationwide) Inpatient Sample The National (Nationwide) Inpatient Sample (NIS) is based on data from community hospitals, which are defined as short-term, non-Federal, general, and other hospitals, excluding hospital units of other institutions (e.g., prisons). The NIS includes obstetrics and gynecology, otolaryngology, orthopedic, cancer, pediatric, public, and academic medical hospitals. Excluded are long-term care facilities such as rehabilitation, psychiatric, and alcoholism and chemical dependency hospitals. Beginning in 2012, long-term acute care hospitals are also excluded. However, if a patient received long-term care, rehabilitation, or treatment for a psychiatric or chemical dependency condition in a community hospital, the discharge record for that stay will be included in the NIS. Types of hospitals included in the HCUP Nationwide Emergency Department Sample The Nationwide Emergency Department Sample (NEDS) is based on data from community hospitals, which are defined as short-term, non-Federal, general, and other hospitals, excluding hospital units of other institutions (e.g., prisons). The NEDS includes specialty, pediatric, public, and academic medical hospitals. Excluded are long-term care facilities such as rehabilitation, psychiatric, and alcoholism and chemical dependency hospitals. Hospitals included in the NEDS have hospital-owned emergency departments (EDs) and no more than 90 percent of their ED visits resulting in admission. Types of hospitals included in HCUP State Inpatient Databases This analysis used State Inpatient Databases (SID) limited to data from community hospitals, which are defined as short-term, non-Federal, general, and other hospitals, excluding hospital units of other institutions (e.g., prisons). Community hospitals include obstetrics and gynecology, otolaryngology, orthopedic, cancer, pediatric, public, and academic medical hospitals. Excluded for this analysis are long-term care facilities such as rehabilitation, psychiatric, and alcoholism and chemical dependency hospitals. However, if a patient received long-term care, rehabilitation, or treatment for a psychiatric or chemical dependency condition in a community hospital, the discharge record for that stay was included in the analysis. Types of hospitals included in HCUP State Emergency Department Databases This analysis used State Emergency Department Databases (SEDD) limited to data from community hospitals with a hospital-owned ED. Community hospitals are defined as short-term, non-Federal, general, and other hospitals, excluding hospital units of other institutions (e.g., prisons). Community hospitals include specialty, pediatric, public, and academic medical hospitals. Excluded for this analysis are long-term care facilities such as rehabilitation, psychiatric, and alcoholism and chemical dependency hospitals. Unit of analysis The unit of analysis for inpatient data is the hospital discharge (i.e., the hospital stay), not a person or patient. This means that a person who is admitted to the hospital multiple times in 1 year will be counted each time as a separate discharge from the hospital. Inpatient stays include those for patients admitted through the ED. Patients transferred between inpatient hospitals are counted only once. The unit of analysis for ED data is the ED visit, not a person or patient. This means that a person who is seen in the ED multiple times in 1 year will be counted each time as a separate visit in the ED. ED visits exclude those for patients admitted to the same hospital and also exclude patients transferred to another hospital. Payer Payer is the expected payer for the hospital stay or ED visit. To make coding uniform across all HCUP data sources, payer combines detailed categories into general groups:
For this Statistical Brief, uninsured patients may also include those with an expected payer of Indian Health Services, county indigent, migrant health programs, Ryan White Act, Hill-Burton Free Care, or other State or local programs for the indigent when those programs are identifiable in the Partner-provided coding of expected payer. This reclassification of patients from the "Other" group to the "Uninsured" group is possible only for some States and not for national estimates. Opioid-related stays for which the expected payer was Other, missing, or invalid were excluded. The share of opioid-related hospital stays or ED visits was calculated based only on those records for which the expected payer was Medicare, Medicaid, private insurance, or uninsured; thus, the total is equal to 100 percent. When more than one payer is listed for a hospital discharge or ED visit, the first-listed payer is used. About HCUP The Healthcare Cost and Utilization Project (HCUP, pronounced "H-Cup") is a family of healthcare databases and related software tools and products developed through a Federal-State-Industry partnership and sponsored by the Agency for Healthcare Research and Quality (AHRQ). HCUP databases bring together the data collection efforts of State data organizations, hospital associations, and private data organizations (HCUP Partners) and the Federal government to create a national information resource of encounter-level healthcare data. HCUP includes the largest collection of longitudinal hospital care data in the United States, with all-payer, encounter-level information beginning in 1988. These databases enable research on a broad range of health policy issues, including cost and quality of health services, medical practice patterns, access to healthcare programs, and outcomes of treatments at the national, State, and local market levels. HCUP would not be possible without the contributions of the following data collection Partners from across the United States: Alaska Department of Health and Social Services Alaska State Hospital and Nursing Home Association Arizona Department of Health Services Arkansas Department of Health California Office of Statewide Health Planning and Development Colorado Hospital Association Connecticut Hospital Association District of Columbia Hospital Association Florida Agency for Health Care Administration Georgia Hospital Association Hawaii Health Information Corporation Illinois Department of Public Health Indiana Hospital Association Iowa Hospital Association Kansas Hospital Association Kentucky Cabinet for Health and Family Services Louisiana Department of Health Maine Health Data Organization Maryland Health Services Cost Review Commission Massachusetts Center for Health Information and Analysis Michigan Health & Hospital Association Minnesota Hospital Association Mississippi State Department of Health Missouri Hospital Industry Data Institute Montana Hospital Association Nebraska Hospital Association Nevada Department of Health and Human Services New Hampshire Department of Health & Human Services New Jersey Department of Health New Mexico Department of Health New York State Department of Health North Carolina Department of Health and Human Services North Dakota (data provided by the Minnesota Hospital Association) Ohio Hospital Association Oklahoma State Department of Health Oregon Association of Hospitals and Health Systems Oregon Office of Health Analytics Pennsylvania Health Care Cost Containment Council Rhode Island Department of Health South Carolina Revenue and Fiscal Affairs Office South Dakota Association of Healthcare Organizations Tennessee Hospital Association Texas Department of State Health Services Utah Department of Health Vermont Association of Hospitals and Health Systems Virginia Health Information Washington State Department of Health West Virginia Department of Health and Human Resources, West Virginia Health Care Authority Wisconsin Department of Health Services Wyoming Hospital Association About the NIS The HCUP National (Nationwide) Inpatient Sample (NIS) is a nationwide database of hospital inpatient stays. The NIS is nationally representative of all community hospitals (i.e., short-term, non-Federal, nonrehabilitation hospitals). The NIS includes all payers. It is drawn from a sampling frame that contains hospitals comprising more than 95 percent of all discharges in the United States. The vast size of the NIS allows the study of topics at the national and regional levels for specific subgroups of patients. In addition, NIS data are standardized across years to facilitate ease of use. Over time, the sampling frame for the NIS has changed; thus, the number of States contributing to the NIS varies from year to year. The NIS is intended for national estimates only; no State-level estimates can be produced. The 2012 NIS was redesigned to optimize national estimates. The redesign incorporates two critical changes:
About the NEDS The HCUP Nationwide Emergency Department Database (NEDS) is a unique and powerful database that yields national estimates of emergency department (ED) visits. The NEDS was constructed using records from both the HCUP State Emergency Department Databases (SEDD) and the State Inpatient Databases (SID). The SEDD capture information on ED visits that do not result in an admission (i.e., patients who were treated in the ED and then released from the ED, or patients who were transferred to another hospital); the SID contain information on patients initially seen in the ED and then admitted to the same hospital. The NEDS was created to enable analyses of ED utilization patterns and support public health professionals, administrators, policymakers, and clinicians in their decision making regarding this critical source of care. The NEDS is produced annually beginning in 2006. Over time, the sampling frame for the NEDS has changed; thus, the number of States contributing to the NEDS varies from year to year. The NEDS is intended for national estimates only; no State-level estimates can be produced. About the SID The HCUP State Inpatient Databases (SID) are hospital inpatient databases from data organizations participating in HCUP. The SID contain the universe of the inpatient discharge abstracts in the participating HCUP States, translated into a uniform format to facilitate multistate comparisons and analyses. Together, the SID encompass more than 95 percent of all U.S. community hospital discharges. The SID can be used to investigate questions unique to one State, to compare data from two or more States, to conduct market-area variation analyses, and to identify State-specific trends in inpatient care utilization, access, charges, and outcomes. About the SEDD The HCUP State Emergency Department Databases (SEDD) include information from hospital-owned emergency departments (EDs) from data organizations participating in HCUP, translated into a uniform format to facilitate multistate comparisons and analyses. The SEDD capture information on ED visits that do not result in an admission to the same hospital (i.e., patients who are treated in the ED and then discharged, transferred to another hospital, left against medical advice, or died). The SEDD contain a core set of clinical and nonclinical information on all patients, including individuals covered by Medicare, Medicaid, or private insurance, as well as those who are uninsured. The SEDD can be used to investigate questions unique to one State, to compare data from two or more States, to conduct market-area variation analyses, and to identify State-specific trends in injury surveillance, emerging infections, and other conditions treated in the ED. About HCUP Fast Stats HCUP Fast Stats (https://datatools.ahrq.gov/hcup-fast-stats) is an interactive, online tool that provides easy access to the quarterly HCUP-based statistics for select State and national health information topics. HCUP Fast Stats uses side-by-side comparisons of visual statistical displays, trend figures, or simple tables to convey complex information at a glance. Topics currently available in HCUP Fast Stats include State Trends in Hospital Use by Payer; National Hospital Utilization and Costs; and Opioid-Related Hospital Use, National and State. HCUP Fast Stats presents statistics using data from HCUP's National (Nationwide) Inpatient Sample (NIS), the Nationwide Emergency Department Sample (NEDS), the State Inpatient Databases (SID), and the State Emergency Department Databases (SEDD). For More Information For other information on mental health and substance abuse, including opioids, refer to the HCUP Statistical Briefs located at www.hcup-us.ahrq.gov/reports/statbriefs/sb_mhsa.jsp. For additional HCUP statistics, visit:
For a detailed description of HCUP and more information on the design of the National (Nationwide) Inpatient Sample (NIS), Nationwide Emergency Department Sample (NEDS), State Inpatient Databases (SID), or State Emergency Department Databases (SEDD), please refer to the following database documentation: Agency for Healthcare Research and Quality. Overview of the National (Nationwide) Inpatient Sample (NIS). Healthcare Cost and Utilization Project (HCUP). Rockville, MD: Agency for Healthcare Research and Quality. Updated February 2018. www.hcup-us.ahrq.gov/nisoverview.jsp. Accessed February 12, 2018. Agency for Healthcare Research and Quality. Overview of the Nationwide Emergency Department Sample (NEDS). Healthcare Cost and Utilization Project (HCUP). Rockville, MD: Agency for Healthcare Research and Quality. Updated December 2017. www.hcup-us.ahrq.gov/nedsoverview.jsp. Accessed January 18, 2018. Agency for Healthcare Research and Quality. Overview of the State Inpatient Databases (SID). Healthcare Cost and Utilization Project (HCUP). Rockville, MD: Agency for Healthcare Research and Quality. Updated April 2017. www.hcup-us.ahrq.gov/sidoverview.jsp. Accessed January 18, 2018. Agency for Healthcare Research and Quality. Overview of the State Emergency Department Databases (SEDD). Healthcare Cost and Utilization Project (HCUP). Rockville, MD: Agency for Healthcare Research and Quality. Updated September 2017. www.hcup-us.ahrq.gov/seddoverview.jsp. Accessed January 18, 2018. Suggested Citation Weiss AJ (IBM Watson Health), Heslin KC (AHRQ). Payers of Opioid-Related Inpatient Stays and Emergency Department Visits Nationally and by State, 2010 and 2015. HCUP Statistical Brief #239. May 2018. Agency for Healthcare Research and Quality, Rockville, MD. www.hcup-us.ahrq.gov/reports/statbriefs/sb239-Opioid-Payer-Hospital-Stays-ED-Visits-by-State.pdf. Acknowledgments The authors would like to acknowledge the contributions of Brian Eppert of Coding Leap, LLC; Marguerite Barrett of M.L. Barrett, Inc.; and Molly Bailey, Lauren O'Malley, and Minya Sheng of IBM Watson Health. *** AHRQ welcomes questions and comments from readers of this publication who are interested in obtaining more information about access, cost, use, financing, and quality of healthcare in the United States. We also invite you to tell us how you are using this Statistical Brief and other HCUP data and tools, and to share suggestions on how HCUP products might be enhanced to further meet your needs. Please e-mail us at hcup@ahrq.gov or send a letter to the address below:Virginia Mackay-Smith, Acting Director Center for Delivery, Organization, and Markets Agency for Healthcare Research and Quality 5600 Fishers Lane Rockville, MD 20857 This Statistical Brief was posted online on May 30, 2018. 1 Weiss AJ, Elixhauser A, Barrett ML, Steiner CA, Bailey MK, O'Malley L. Opioid-Related Inpatient Stays and Emergency Department Visits by State, 2009-2014. HCUP Statistical Brief #219. December 2016. Agency for Healthcare Research and Quality, Rockville, MD. www.hcup-us.ahrq.gov/reports/statbriefs/sb219-Opioid-Hospital-Stays-ED-Visits-by-State.pdf. Accessed February 13, 2018. 2 Ibid. 3 Weiss AJ, Bailey MK, O'Malley L, Barrett ML, Elixhauser A, Steiner CA. Patient Characteristics of Opioid-Related Inpatient Stays and Emergency Department Visits Nationally and by State, 2014. HCUP Statistical Brief #224. June 2017. Agency for Healthcare Research and Quality, Rockville, MD. www.hcup-us.ahrq.gov/reports/statbriefs/sb224-Patient-Characteristics-Opioid-Hospital-Stays-ED-Visits-by-State.pdf. Accessed February 13, 2018. 4 Weiss AJ, Bailey MK, O'Malley L, Barrett ML, Elixhauser A, Steiner CA. Patient Residence Characteristics of Opioid-Related Inpatient Stays and Emergency Department Visits Nationally and by State, 2014. HCUP Statistical Brief #226. July 2017. Agency for Healthcare Research and Quality, Rockville, MD. www.hcup-us.ahrq.gov/reports/statbriefs/sb226-Patient-Residence-Opioid-Hospital-Stays-ED-Visits-by-State.pdf. Accessed February 13, 2018. 5 Agency for Healthcare Research and Quality. HCUP Fast Stats website, Opioid-Related Hospital Use path. https://datatools.ahrq.gov/hcup-fast-stats. Accessed February 13, 2018. 6 We used fiscal years (FYs) in this Statistical Brief because beginning FY 2016, on October 1, 2015, the United States transitioned from the ICD-9-CM clinical coding system to the ICD-10-CM/PCS clinical coding system. Although codes for opioid-related diagnoses are available in both coding systems, the change in coding systems resulted in a substantial shift in the number of opioid-related inpatient stays (ref. Heslin KC, Owens PL, Karaca Z, Barrett ML, Moore BJ, Elixhauser A. Trends in opioid-related inpatient stays shifted after the US transitioned to ICD-10-CM diagnosis coding in 2015. Medical Care. 2017;55(11):918-923). As a result, for comparability across years in this Statistical Brief, we used 2 FYs (2010 and 2015) with clinical coding entirely under the ICD-9-CM coding system. 7 Agency for Healthcare Research and Quality. HCUP Fast Stats website, Opioid-Related Hospital Use path. https://datatools.ahrq.gov/hcup-fast-stats. Accessed January 26, 2017. 8 Compton WM, Jones CM, Baldwin GT. Relationship between nonmedical prescription-opioid use and heroin use. The New England Journal of Medicine. 2016;374:154-63. |
| Supplementary Table 1. Percentage of opioid-related inpatient stays in each State by payer and year for data presented in Figures 2-5. | ||||||||
| State | Medicare | Medicaid | Private Insurance | Uninsured | ||||
|---|---|---|---|---|---|---|---|---|
| 2010 | 2015 | 2010 | 2015 | 2010 | 2015 | 2010 | 2015 | |
| National | 27.4 | 31.9 | 34.8 | 40.2 | 21.6 | 20.3 | 16.1 | 7.6 |
| Arizona* | 37.1 | 37.8 | 35.5 | 42.8 | 22.7 | 16.3 | 4.6 | 3.1 |
| Arkansas* | 40.6 | 36.7 | 19.9 | 26.4 | 19.0 | 32.0 | 20.5 | 4.9 |
| California* | 35.6 | 38.6 | 23.7 | 38.0 | 26.1 | 20.6 | 14.7 | 2.8 |
| Colorado* | 36.5 | 36.3 | 12.7 | 33.5 | 31.6 | 26.4 | 19.2 | 3.8 |
| Florida | 34.8 | 39.9 | 20.9 | 22.9 | 22.1 | 17.8 | 22.2 | 19.4 |
| Georgia | 34.8 | 41.9 | 21.9 | 21.4 | 24.0 | 20.4 | 19.3 | 16.3 |
| Hawaii* | 31.4 | 34.7 | 39.4 | 44.2 | 25.4 | 18.4 | 3.8 | 2.8 |
| Illinois* | 21.0 | 23.5 | 56.7 | 48.8 | 12.3 | 24.9 | 10.0 | 2.9 |
| Indiana* | 30.0 | 35.5 | 22.9 | 30.7 | 26.6 | 22.6 | 20.5 | 11.2 |
| Iowa* | 43.1 | 50.2 | 22.1 | 26.5 | 25.7 | 20.6 | 9.0 | 2.7 |
| Kansas | 38.5 | 43.9 | 14.5 | 15.9 | 28.8 | 23.9 | 18.2 | 16.3 |
| Kentucky* | 22.0 | 24.0 | 31.9 | 58.8 | 15.7 | 13.9 | 30.4 | 3.2 |
| Louisiana* | 22.8 | 23.7 | 38.1 | 19.1 | 20.3 | 21.4 | 18.8 | 35.9 |
| Maine | 30.2 | 35.8 | 41.7 | 33.0 | 14.5 | 14.1 | 13.5 | 17.0 |
| Maryland* | 20.3 | 23.9 | 40.8 | 57.4 | 15.4 | 12.6 | 23.5 | 6.1 |
| Massachusetts* | 33.6 | 33.4 | 36.7 | 44.6 | 23.7 | 20.4 | 5.9 | 1.6 |
| Michigan* | 36.8 | 39.8 | 25.8 | 38.5 | 27.6 | 20.2 | 9.8 | 1.5 |
| Minnesota* | 33.4 | 35.5 | 27.1 | 33.1 | 36.5 | 30.1 | 2.9 | 1.3 |
| Missouri | 30.2 | 30.1 | 31.6 | 33.6 | 18.9 | 14.9 | 19.3 | 21.3 |
| Montana | 34.6 | 45.5 | 15.2 | 27.5 | 37.1 | 15.6 | 13.1 | 11.4 |
| Nebraska | 39.4 | 46.4 | 16.4 | 11.3 | 36.1 | 37.1 | 8.2 | 5.2 |
| Nevada* | 35.5 | 37.0 | 18.5 | 40.6 | 23.8 | 17.0 | 22.2 | 5.4 |
| New Jersey* | 19.7 | 22.4 | 18.4 | 47.3 | 26.5 | 22.5 | 35.4 | 7.8 |
| New Mexico* | 29.8 | 31.3 | 30.7 | 53.8 | 17.5 | 11.3 | 22.1 | 3.7 |
| New York* | 14.8 | 19.9 | 60.6 | 62.5 | 14.1 | 14.8 | 10.5 | 2.8 |
| North Carolina | 32.3 | 30.8 | 26.7 | 26.2 | 25.9 | 29.0 | 15.1 | 14.0 |
| Ohio* | 25.1 | 23.5 | 35.8 | 60.1 | 20.9 | 12.8 | 18.2 | 3.7 |
| Oklahoma | 36.7 | 40.0 | 24.9 | 24.6 | 23.6 | 23.3 | 14.8 | 12.1 |
| Oregon* | 37.1 | 45.6 | 20.7 | 36.5 | 26.6 | 16.1 | 15.6 | 1.8 |
| Pennsylvania* | 24.3 | 30.1 | 39.6 | 37.1 | 27.7 | 28.7 | 8.4 | 4.1 |
| Rhode Island* | 30.1 | 31.7 | 32.4 | 53.2 | 26.7 | 13.3 | 10.8 | 1.8 |
| South Carolina | 34.1 | 36.2 | 19.0 | 24.4 | 26.9 | 18.3 | 20.0 | 21.1 |
| South Dakota | 42.1 | 42.8 | 15.3 | 17.3 | 36.4 | 36.2 | 6.3 | 3.8 |
| Tennessee | 40.4 | 40.1 | 22.8 | 30.0 | 23.1 | 17.5 | 13.8 | 12.4 |
| Texas | 30.0 | 34.3 | 17.6 | 15.7 | 31.4 | 27.8 | 20.9 | 22.1 |
| Utah | 21.5 | 27.7 | 18.6 | 21.9 | 42.7 | 33.3 | 17.2 | 17.1 |
| Vermont* | 30.4 | 28.3 | 50.5 | 57.2 | 14.6 | 12.4 | 4.4 | 2.1 |
| Virginia | 34.8 | 33.3 | 18.6 | 20.0 | 26.4 | 25.2 | 20.1 | 21.4 |
| Washington* | 28.1 | 37.2 | 30.5 | 37.9 | 30.0 | 22.5 | 11.4 | 2.5 |
| West Virginia* | 25.4 | 22.3 | 37.4 | 63.0 | 15.2 | 12.1 | 22.0 | 2.6 |
| Wisconsin | 40.7 | 37.9 | 26.3 | 38.1 | 26.3 | 21.5 | 6.7 | 2.6 |
| Wyoming | 26.1 | 39.1 | 12.7 | 20.7 | 34.5 | 22.1 | 26.7 | 18.1 |
| Supplementary Table 2. Percentage of opioid-related emergency department visits in each State by payer and year for data presented in Figures 6-9. | ||||||||
| State | Medicare | Medicaid | Private Insurance | Uninsured | ||||
|---|---|---|---|---|---|---|---|---|
| 2010 | 2015 | 2010 | 2015 | 2010 | 2015 | 2010 | 2015 | |
| National | 14.1 | 16.1 | 29.1 | 44.5 | 22.9 | 20.4 | 33.8 | 19.0 |
| Arizona* | 14.8 | 19.1 | 50.9 | 54.2 | 19.8 | 16.4 | 14.6 | 10.4 |
| California* | 17.6 | 20.1 | 24.4 | 44.5 | 26.0 | 23.8 | 31.9 | 11.7 |
| Florida | 14.6 | 18.8 | 21.3 | 21.4 | 17.6 | 19.0 | 46.5 | 40.8 |
| Georgia | 14.5 | 19.0 | 17.5 | 17.1 | 19.0 | 20.7 | 49.0 | 43.2 |
| Hawaii* | 18.5 | 21.2 | 50.7 | 52.8 | 22.9 | 17.2 | 7.9 | 8.9 |
| Illinois* | 11.8 | 12.1 | 28.4 | 50.6 | 18.9 | 24.0 | 40.9 | 13.3 |
| Indiana* | 17.4 | 17.5 | 21.6 | 27.8 | 27.4 | 27.7 | 33.7 | 27.0 |
| Iowa* | 25.0 | 28.3 | 24.8 | 36.2 | 31.4 | 27.6 | 18.8 | 8.0 |
| Kansas | 19.5 | 23.7 | 18.8 | 21.2 | 29.3 | 26.8 | 32.3 | 28.3 |
| Kentucky* | 12.1 | 12.6 | 23.2 | 58.6 | 16.7 | 16.4 | 48.0 | 12.5 |
| Maryland* | 10.1 | 13.4 | 38.1 | 59.9 | 18.8 | 15.0 | 32.9 | 11.7 |
| Minnesota* | 16.8 | 20.1 | 30.1 | 43.8 | 39.7 | 30.4 | 13.3 | 5.7 |
| Missouri | 12.9 | 16.4 | 28.2 | 27.9 | 16.6 | 16.5 | 42.3 | 39.2 |
| Nebraska | 22.4 | 30.5 | 17.6 | 10.1 | 37.9 | 48.8 | 22.0 | 10.5 |
| New Jersey* | 9.5 | 10.9 | 13.2 | 39.9 | 24.3 | 28.3 | 53.0 | 20.9 |
| New York* | 7.8 | 11.0 | 29.9 | 58.0 | 34.8 | 15.7 | 27.5 | 15.3 |
| North Carolina | 17.8 | 13.9 | 25.6 | 22.5 | 19.9 | 21.9 | 36.8 | 41.7 |
| Rhode Island* | 16.6 | 15.0 | 25.4 | 55.8 | 19.0 | 17.5 | 38.9 | 11.7 |
| South Carolina | 17.0 | 18.2 | 17.6 | 20.2 | 23.6 | 17.1 | 41.8 | 44.5 |
| South Dakota | 31.7 | 31.7 | 18.8 | 15.0 | 29.9 | 38.7 | 19.7 | 14.6 |
| Tennessee | 19.8 | 24.4 | 29.3 | 29.0 | 18.1 | 15.8 | 32.9 | 30.8 |
| Vermont* | 22.2 | 20.6 | 47.6 | 59.6 | 17.0 | 12.2 | 13.2 | 7.5 |
| Wisconsin | 17.6 | 15.7 | 34.6 | 50.0 | 24.0 | 21.9 | 23.9 | 12.4 |