STATISTICAL BRIEF #237 |
February 2018
Pamela L. Owens, Ph.D., Rhona Limcangco, Ph.D., Marguerite L. Barrett, M.S., Kevin C. Heslin, Ph.D., and Brian J. Moore, Ph.D. Introduction Improving patient safety and the quality of healthcare is a national priority in the United States.1 In 1999, the Institute of Medicine reported that 44,000 to 98,000 Americans die each year as a result of medical errors.2 More recently, at least one author has suggested that estimates of harm are much higher.3 The majority of these errors are a result of systemic problems rather than poor performance of individual clinicians. In the last 25 years, national initiatives have taken place to reduce the number of patients harmed as a result of the process of healthcare.4 However, medical errors are still a serious issue, and efforts to reduce them continue to draw attention and resources across the healthcare system.5 Therefore, it is important to assess progress made in patient safety and reveal where gaps remain. One way to assess patient safety and adverse events is by using the Agency for Healthcare Research and Quality (AHRQ) Patient Safety Indicators (PSIs).6 These indicators provide a measure of potentially preventable complications of adult medical and surgical hospital care. The PSIs focus on adverse events during the hospital stay (such as pressure ulcers), complications associated with surgery (such as hemorrhage or hematomas, respiratory failure, or pulmonary embolism/deep vein thrombosis), and patient safety overall (a composite of the patient safety events). Rates vary by hospital and across time, with evidence demonstrating that the implementation of hospital quality improvement practices reduces avoidable harms to patients.7 This Healthcare Cost and Utilization Project (HCUP) Statistical Brief focuses on 14 (13 individual indicators and 1 composite) of the 19 AHRQ PSIs, as defined by technical specifications posted on the AHRQ Quality Indicator website.8 The 14 indicators represented in this Statistical Brief are risk adjusted for age, sex, major diagnostic categories, modified diagnosis related groups, and comorbidities. Some indicators are also adjusted for transfers of patients from other facilities or for severity of complications present on admission to the hospital. The AHRQ PSIs used in this Statistical Brief are included in Table 1. |
|
| Table 1. Agency for Healthcare Research and Quality Patient Safety Indicators used in this Statistical Brief | |
| Patient Safety Indicator (PSI) | Brief Description of Patient Safety or Adverse Eventa |
|---|---|
| PSI 02 Death Rate in Low-Mortality Diagnosis Related Groups (DRGs) | In-hospital death among patients with a diagnosis that is unlikely to result in an in-hospital death |
| PSI 03 Pressure Ulcer Rate | Wounds caused by unrelieved pressure on the skin usually around bony prominences |
| PSI 04 Death Rate among Surgical Inpatients with Serious Treatable Complications | In-hospital death among surgical patients with a serious treatable complication, such as deep vein thrombosis/ pulmonary embolism, pneumonia, sepsis, cardiac arrest or gastrointestinal hemorrhage/ulcer |
| PSI 06 Iatrogenic Pneumothorax Rate | Lung injury due to medical care |
| PSI 07 Central Venous Catheter-Related Blood Stream Infection Rate | Serious infection that occurs when harmful bacteria enter the bloodstream through a tube inserted in a large vein in the neck, chest, or groin |
| PSI 08 In Hospital Fall with Hip Fracture Rate | Hip fractures most likely resulting from a fall during the hospital stay |
| PSI 09 Perioperative Hemorrhage or Hematoma Rate | Significant hemorrhage (or bleeding from a ruptured blood vessel) during a surgical procedure |
| PSI 10 Postoperative Acute Kidney Injury Requiring Dialysis Rate | Abrupt or rapid decline in kidney function following surgery |
| PSI 11 Postoperative Respiratory Failure Rate | Acute respiratory failure following a surgery |
| PSI 12 Perioperative Pulmonary Embolism or Deep Vein Thrombosis Rate | Surgery-related blood clot in the leg, thigh, or pelvis that can travel to the heart or lungs causing a blockage |
| PSI 13 Postoperative Sepsis Rate | Life-threatening infection-related immune response causing injury to the body's tissues and organs following an elective surgery |
| PSI 14 Postoperative Wound Dehiscence Rate | Surgical wound rupture in the abdominal or pelvic area |
| PSI 15 Unrecognized Abdominopelvic Accidental Puncture/Laceration Rate | Accidental puncture during a procedure of the abdomen or pelvis |
| PSI 90 Patient Safety and Adverse Events Composite | Composite of PSI 03, PSI 06, PSI 08-PSI 15 |
| Abbreviation: PSI, Patient Safety Indicator a Full technical specifications and descriptions of the indicators are available at www.qualityindicators.ahrq.gov/Modules/PSI_TechSpec_ICD09_v60.aspx. | |
The remaining five AHRQ PSIs (not examined) include count measures or observed rates of obstetric care.
This Statistical Brief provides information on the number of patient safety and adverse events and the number of medical or surgical cases that may be at risk for a patient safety or adverse event across all community, nonrehabilitation hospitals and discharges from all payers (including the uninsured) in 34 States in 2011 and 2014. The Brief displays information on the average hospital risk-adjusted rates for 13 individual indicators and how the rates changed from 2011 to 2014. The percentage of hospitals with no patient safety events is presented for each of the 13 selected PSIs, along with the percentage of hospitals with average or better-than-average risk-adjusted rates. Finally, the percentage of hospitals classified as better than average, average, or worse than average in overall patient safety (composite) in 2011 and 2014 is presented by select hospital characteristics. All differences in hospital PSI rates were considered meaningful in this Statistical Brief. Even small differences may represent important quality improvement for U.S. hospitals and the patients they serve. Findings Number of patient safety and adverse events, 2011 and 2014 Table 2 presents the overall number of events and number of cases at risk of selected PSIs in 34 States in 2011 and 2014. |
| Table 2. Patient safety and adverse events and cases at risk of selected PSIs in 34 States, 2011 and 2014 | ||||||
| Patient safety or adverse event | Number of events | Number at risk a | Percent change in number of events | Percent change in number at risk | ||
|---|---|---|---|---|---|---|
| 2011 | 2014 | 2011 | 2014 | |||
| Mortality rates among selected discharges | ||||||
| Death rate in low-mortality diagnosis related groups (DRGs) (PSI 02) | 2,000 | 1,700 | 5,597,400 | 5,243,800 | -16.5 | -6.3 |
| Death rate among surgical inpatients with serious treatable complications (PSI 04) | 22,600 | 23,800 | 186,500 | 192,900 | 5.2 | 3.4 |
| Patient safety event rates among medical and surgical discharges | ||||||
| Pressure ulcer rate (PSI 03)b | 3,300 | 2,800 | 11,084,400 | 10,841,800 | -14.2 | -2.2 |
| Iatrogenic pneumothorax rate (PSI 06)b | 7,200 | 5,600 | 19,104,900 | 18,433,500 | -22.3 | -3.5 |
| Central venous catheter-related blood stream infection rate (PSI 07) | 6,200 | 2,200 | 15,394,500 | 15,150,700 | -64.2 | -1.6 |
| In hospital fall with hip fracture rate (PSI 08)b | 1,400 | 1,000 | 14,532,100 | 13,810,800 | -26.3 | -5.0 |
| Patient safety event rates among elective surgical discharges | ||||||
| Postoperative respiratory failure rate (PSI 11)b | 22,800 | 20,800 | 2,572,900 | 2,476,700 | -8.5 | -3.7 |
| Postoperative sepsis rate (PSI 13)b | 15,400 | 12,400 | 2,989,900 | 2,807,300 | -19.5 | -6.1 |
| Patient safety event rates among surgical discharges | ||||||
| Perioperative hemorrhage or hematoma rate (PSI 09)b | 27,100 | 22,600 | 5,401,900 | 5,180,700 | -16.8 | -4.1 |
| Postoperative acute kidney injury requiring dialysis rate (PSI 10)b | 2,200 | 2,100 | 3,083,500 | 2,904,400 | -6.3 | -5.8 |
| Perioperative pulmonary embolism or deep vein thrombosis rate (PSI 12)b | 23,100 | 20,100 | 5,694,100 | 5,477,900 | -13.1 | -3.8 |
| Patient safety events rates among abdominopelvic surgical discharges | ||||||
| Postoperative wound dehiscence rate (PSI 14)b | 1,600 | 1,300 | 870,000 | 815,000 | -20.3 | -6.3 |
| Unrecognized abdominopelvic accidental puncture or laceration rate (PSI 15)b | 900 | 700 | 1,078,000 | 1,027,700 | -17.1 | -4.7 |
| Abbreviations: DRG, diagnosis related group; PSI, Patient Safety Indicator Notes: Number of events and number at risk are rounded to the nearest 100. Percent change in number of events and percent change in number at risk are calculated with unrounded data. a Depending on the indicator, the number of cases at risk (denominator) is based on discharges for low mortality DRGs (PSI 02), medical and surgical discharges (PSI 03, PSI 06, PSI 07, PSI 08), elective surgical discharges (PSI 04, PSI 11, PSI 13), surgical discharges (PSI 09, PSI 10, PSI 12), or abdominopelvic surgical discharges (PSI 14, PSI 15). b Included in the calculation of the Patient Safety and Adverse Events Composite (PSI 90) Source: Agency for Healthcare Research and Quality (AHRQ), Center for Delivery, Organization, and Markets, Healthcare Cost and Utilization Project (HCUP), State Inpatient Databases (SID) from 34 States, 2011 and 2014 | ||||||
Table 3 presents summary statistics for hospital risk-adjusted rates for selected PSIs in 34 States in 2011 and 2014. Lower rates are better and indicate fewer adverse events and potentially avoidable complications. |
| Table 3. Hospital rates of patient safety and adverse events in 34 States, 2011 and 2014 | |||
| Patient safety or adverse event | Average hospital rate (per 1,000 dischargesa) | Percent change in average | |
|---|---|---|---|
| 2011 | 2014 | ||
| Mortality rates among selected discharges | |||
| Death rate in low-mortality diagnosis related groups (DRGs) (PSI 02) | 0.48 | 0.45 | -6.2 |
| Death rate among surgical inpatients with serious treatable complications (PSI 04) | 131.79 | 117.50 | -10.8 |
| Patient safety event rates among medical and surgical discharges | |||
| Pressure ulcer rate (PSI 03)b | 0.26 | 0.20 | -23.1 |
| Iatrogenic pneumothorax rate (PSI 06)b | 0.27 | 0.24 | -11.1 |
| Central venous catheter-related blood stream infection rate (PSI 07) | 0.31 | 0.10 | -67.7 |
| In hospital fall with hip fracture rate (PSI 08)b | 0.46 | 0.12 | -73.9 |
| Patient safety event rates among elective surgical discharges | |||
| Postoperative respiratory failure rate (PSI 11)b | 8.86 | 8.25 | -6.9 |
| Postoperative sepsis rate (PSI 13)b | 4.42 | 3.87 | -12.4 |
| Patient safety event rates among surgical discharges | |||
| Perioperative hemorrhage or hematoma rate (PSI 09)b | 4.44 | 4.08 | -8.1 |
| Postoperative acute kidney injury requiring dialysis rate (PSI 10)b | 0.56 | 0.48 | -14.3 |
| Perioperative pulmonary embolism or deep vein thrombosis rate (PSI 12)b | 3.48 | 2.95 | -15.2 |
| Patient safety event rates among abdominopelvic surgical discharges | |||
| Postoperative wound dehiscence rate (PSI 14)b | 2.18 | 1.70 | -22.0 |
| Unrecognized abdominopelvic accidental puncture or laceration rate (PSI 15)b | 0.80 | 0.71 | -11.3 |
| Abbreviations: DRG, diagnosis related group; PSI, Patient Safety Indicator Notes: The unit of observation is the hospital. Hospitals were included in the analysis for an individual PSI if there were at least 10 at-risk denominator cases in that PSI in a given year. PSIs are reported as the number of adverse patient safety events per 1,000 discharges at risk. The hospital PSI rates are risk adjusted for age, sex, age-sex interaction, major diagnostic categories, modified DRGs, and comorbidities. Some rates are risk adjusted for transfers from another facility or severity of complications present on admission. Data include discharges billed to all expected payers (Medicare, Medicaid, private insurance, no insurance, and other). a Depending on the indicator, the number of cases at risk (denominator) is based on discharges for low mortality DRGs (PSI 02), medical and surgical discharges (PSI 03, PSI 06, PSI 07, PSI 08), elective surgical discharges (PSI 04, PSI 11, PSI 13), surgical discharges (PSI 09, PSI 10, PSI 12), or abdominopelvic surgical discharges (PSI 14, PSI 15). b Included in the calculation of the Patient Safety and Adverse Events Composite (PSI 90) Source: Agency for Healthcare Research and Quality (AHRQ), Center for Delivery, Organization, and Markets, Healthcare Cost and Utilization Project (HCUP), State Inpatient Databases (SID) from 34 States, 2011 and 2014 | |||
|
|
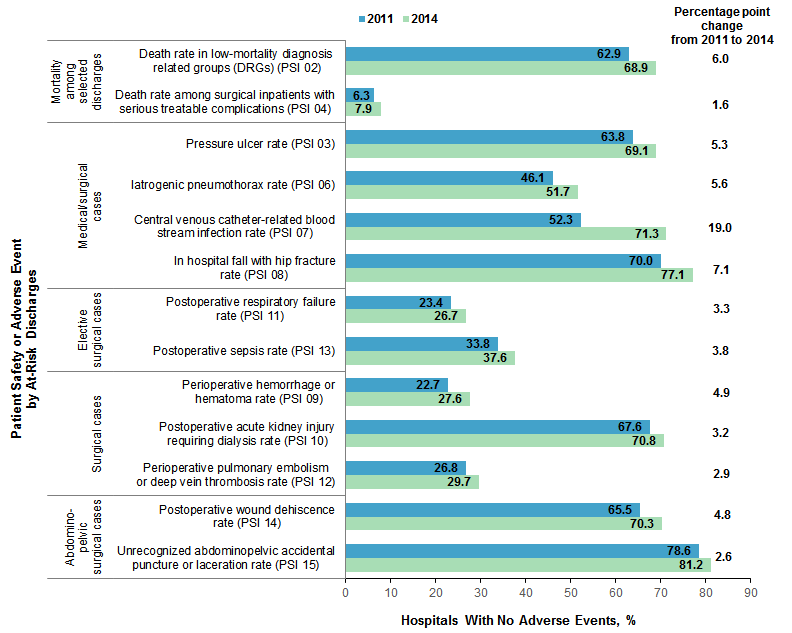
Figure 1. Percentage of hospitals with no patient safety and adverse events in 34 States, 2011 and 2014
Abbreviations: DRG, diagnosis related groups; PSI, Patient Safety Indicator Bar chart that shows the percentage of hospitals with no adverse events in 34 States in 2011 and 2014 by Patient Safety Indicator. Mortality among selected discharges: Death rate in low-mortality diagnosis-related groups (PSI 02): 2011, 62.9%; 2014, 68.9%; net change, 6.0%. Death rate among surgical inpatients with serious treatable complications (PSI 04): 2011, 6.3%; 2014, 7.9%; net change, 1.6%. Medical/surgical cases: pressure ulcer rate (PSI 03): 2011, 63.8%; 2014, 69.1%; net change, 5.3%. Iatrogenic pneumothorax rate (PSI 06): 2011, 46.1%; 2014, 51.7%; net change 5.6%. Central venous catheter-related blood stream infection rate (PSI 07): 2011, 52.3%; 2014, 71.3%; net change, 19.0%. In hospital fall with hip fracture rate (PSI 08): 2011, 70.0%; 2014, 77.1%; net change, 7.1%. Elective surgical cases: postoperative respiratory failure rate (PSI 11): 2011, 23.4%; 2014, 26.7%; net change, 3.3%. Postoperative sepsis rate (PSI 13): 2011, 33.8%; 2014, 37.6%; net change, 3.8%. Surgical cases: perioperative hemorrhage or hematoma rate (PSI 09): 2011, 22.7%; 2014, 27.6%; net change, 4.9%. Postoperative acute kidney injury requiring dialysis rate (PSI 10): 2011, 67.6%; 2014, 70.8%; net change, 3.2%. Perioperative pulmonary embolism or deep vein thrombosis rate (PSI 12): 2011, 26.8%; 2014, 29.7%; net change, 2.9%. Abdomino-pelvic surgical cases: postoperative wound dehiscence rate (PSI 14): 2011, 65.5%; 2014, 70.3; net change, 4.8%. Unrecognized abdominopelvic accidental puncture or laceration rate (PSI 15): 2011, 78.6%; 2014, 81.2%; net change, 2.6%. |
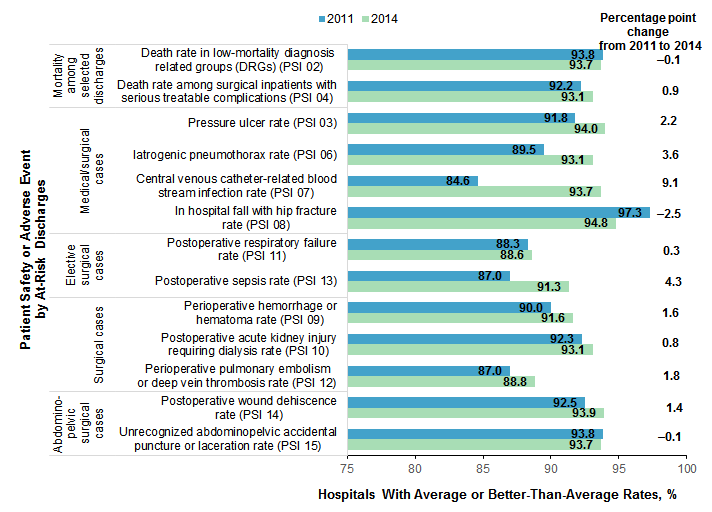
Hospital risk-adjusted rates for patient safety and adverse events were compared with the average across all hospitals in each year.10 For each PSI, a hospital was classified into one of three groups: better than average, average, or worse than average compared with all hospitals. Average hospital rates are displayed in Table 3 for each patient safety and adverse event and each year. Figure 2 presents the percentage of hospitals with rates that were average or better than the average hospital rate in 2011 and 2014. |
|
Figure 2. Percentage of hospitals classified as average or better than average on rates of patient safety and adverse events in 34 States, 2011 and 2014
Abbreviations: DRG, diagnosis related groups; PSI, Patient Safety Indicator Bar chart that shows the percentage of hospitals with average or better than average on rates of patient safety events in 34 States in 2011 and 2014, by Patient Safety Indicator. Mortality among selected discharges: Death rate in low-mortality diagnosis-related groups (PSI 02): 2011, 93.8%; 2014, 93.7%; net change, -0.1%. Death rate among surgical inpatients with serious treatable complications (PSI 04): 2011, 92.2%; 2014, 93.1; net change, 0.9%. Medical/surgical cases: pressure ulcer rate (PSI 03): 2011, 91.8%; 2014, 94.0%; net change, 2.2%. Iatrogenic pneumothorax rate (PSI 06): 2011, 89.5%; 2014, 93.1%; net change 3.6%. Central venous catheter-related blood stream infection rate (PSI 07): 2011, 84.6%; 2014, 93.7%; net change, 9.1%. In hospital fall with hip fraction rate (PSI 08): 2011, 97.3%; 2014, 94.8%; net change, -2.5%. Elective surgical cases: postoperative respiratory failure rate (PSI 11): 2011, 88.3%; 2014, 88.6%; net change, 0.3%. Postoperative sepsis rate (PSI 13): 2011, 87.0%; 2014, 91.3%; net change, 4.3%. Surgical cases: perioperative hemorrhage or hematoma rate (PSI 09): 2011, 90.0%; 2014, 91.6%; net change, 1.6%. Postoperative acute kidney injury requiring dialysis rate (PSI 10): 2011, 92.3%; 2014, 93.1%; net change, 0.8%. Perioperative pulmonary embolism or deep vein thrombosis rate (PSI 12): 2011, 87.0%; 2014, 88.8%; net change, 1.8%. Abdomino-pelvic surgical cases: postoperative wound dehiscence rate (PSI 14): 2011, 92.5%; 2014, 93.9%; net change, 1.4%. Unrecognized abdominopelvic accidental puncture or laceration rate (PSI 15): 2011, 93.8%; 2014, 93.7%; net change, -0.1%. |
Overall patient safety was measured by the Patient Safety and Adverse Events Composite (PSI 90). PSI 90 assigns a single score for each hospital based on 10 risk-adjusted component PSIs.11 The PSI 90 score is designed to vary around 1.0, with scores significantly below 1.0 indicating that hospitals perform better than average and scores significantly above 1.0 indicating that hospitals perform worse than average. Table 4 presents the range of hospital PSI 90 scores and the number and distribution of hospitals classified as better than average, average, or worse than average in overall patient safety and adverse events in 2011 and 2014, by select hospital geographic areas. Improvement in patient safety from 2011 to 2014 could be represented by either a decrease in the percentage of hospitals classified as worse than average or an increase in the percentage of hospitals classified as better than average. |
| Table 4. Range of Patient Safety and Adverse Events Composite (PSI 90) scores and percentage of hospitals classified as better than average, average, or worse than average on PSI 90 in 34 States, 2011 and 2014 | ||||||||||
| Hospital geographic area | Hospitals, N | PSI 90 scores, rangea | Hospital Classification | |||||||
|---|---|---|---|---|---|---|---|---|---|---|
| Better-than-average rate, % | Average rate, % | Worse-than-average rate, % | ||||||||
| 2011 | 2014 | 2011 | 2014 | 2011 | 2014 | 2011 | 2014 | 2011 | 2014 | |
| Overall | 2,779 | 2,837 | 0.21-2.37 | 0.13-2.58 | 3.4 | 5.5 | 87.1 | 87.8 | 9.5 | 6.7 |
| Location | ||||||||||
| Rural | 736 | 728 | 0.58-1.92 | 0.61-1.68 | 0.8 | 0.8 | 98.0 | 97.9 | 1.2 | 1.2 |
| Urban | 2,043 | 2,109 | 0.21-2.37 | 0.13-2.58 | 4.4 | 7.1 | 83.2 | 84.4 | 12.4 | 8.6 |
| Region | ||||||||||
| Northeast | 550 | 535 | 0.61-1.99 | 0.57-1.93 | 2.5 | 4.3 | 89.1 | 87.7 | 8.4 | 8.0 |
| Midwest | 588 | 628 | 0.61-1.92 | 0.52-2.02 | 3.2 | 4.6 | 88.3 | 89.5 | 8.5 | 5.9 |
| South | 998 | 1,010 | 0.21-2.37 | 0.24-2.58 | 3.0 | 4.9 | 85.2 | 88.3 | 11.8 | 6.8 |
| West | 643 | 664 | 0.61-1.84 | 0.13-1.91 | 5.0 | 8.1 | 87.4 | 85.7 | 7.6 | 6.2 |
| Abbreviation: PSI, Patient Safety Indicator a The PSI 90 score is designed to vary around 1.0. The average hospital score in a given year may vary slightly from the 2013 reference population in which the PSI 90 score was predetermined to equal 1.0. For 2011, the average PSI 90 score was 1.03. For 2014, the average PSI 90 score was 0.97. Scores less than the average for the year indicate hospitals doing well. Scores greater than the average for the year indicate hospitals doing poorly. Notes: Hospitals were included in the analysis of the adverse patient safety event composite if there were at least 10 at-risk denominator cases for at least 5 of the 10 component indicators in a given year. Data include discharges billed to all expected payers (Medicare, Medicaid, private insurance, no insurance, and other). Source: Agency for Healthcare Research and Quality (AHRQ), Center for Delivery, Organization, and Markets, Healthcare Cost and Utilization Project (HCUP), State Inpatient Databases (SID) from 34 States, 2011 and 2014 | ||||||||||
HCUP Statistical Briefs provide basic descriptive statistics on a variety of topics using HCUP administrative healthcare data. Topics include hospital inpatient, ambulatory surgery, and emergency department use and costs, quality of care, access to care, medical conditions, procedures, and patient populations, among other topics. The reports are intended to generate hypotheses that can be further explored in other research; the reports are not designed to answer in-depth research questions using multivariate methods. Data Source The estimates in this Statistical Brief are based upon data from the Healthcare Cost and Utilization Project (HCUP) 2011 and 2014 State Inpatient Databases (SID). To identify patient safety events arising during the hospitalization and to determine the timing for peri- and postoperative events, this Statistical Brief is limited to SID with indicators that the diagnoses were present on admission (POA) and with information on the number of days from admission to procedure. The following 34 States were used for comparisons of hospital-level rates for 2011 and 2014 because they had consistently good reporting of POA in both years: Arizona, Arkansas, California, Colorado, Florida, Georgia, Hawaii, Illinois, Indiana, Iowa, Kansas, Kentucky, Maine, Maryland, Massachusetts, Michigan, Minnesota, Montana, Nebraska, Nevada, New Jersey, New Mexico, New York, North Dakota, Oregon, Pennsylvania, Rhode Island, South Carolina, South Dakota, Tennessee, Texas, Vermont, Virginia, and Washington. Definitions Patient Safety Indicators The AHRQ Patient Safety Indicators (PSI; ICD-9-CM, version 6.0.2, released July 2017)12 were used for this analysis. The PSIs, a component of the AHRQ Quality Indicators™ (QIs), are a set of measures that can be used with hospital inpatient discharge and administrative data to provide a perspective on quality. PSIs screen for problems that patients experience as a result of exposure to the healthcare system. These problems are likely amenable to prevention by changes at the system or provider levels. PSIs are a measure of the potentially preventable complication for patients who received their initial care and the complication of care within the same hospitalization. No modifications were made to the version 6.0.2 PSI software. All rates were risk adjusted using the PSI software. Weighting of the individual component indicators for the Patient Safety and Adverse Events Composite (PSI 90) is based on two concepts in version 6.0.2 of the PSI software: the volume of the adverse event and the harm associated with the adverse event.13 The 10 risk-adjusted rates contributing to PSI 90 are as follows:
Further information on the AHRQ QIs, including documentation and free software downloads, is available at www.qualityindicators.ahrq.gov/. Hospital classification: better than average, average, worse than average Each hospital was classified as better than average, average, or worse than average for each PSI in the analysis in both 2011 and 2014. First, the PSI software was used to calculate each hospital's rate and a 95% confidence interval for each hospital's rate. Second, the average hospital rate-presented in Table 3-was calculated as the mean of the rate across hospitals. Third, the hospital average rate for each PSI was compared with the 95% confidence interval for each individual hospital's rate. If the hospital average rate (i.e., the average rate across hospitals) was within the 95% confidence interval for the individual hospital, then that hospital was classified as average. If the hospital average rate was outside the 95% confidence interval for the individual hospital, then that hospital was classified as either better than average or worse than average. Lower rates indicate better patient safety and fewer potentially avoidable complications. Therefore, the hospital was classified as worse than average if the low end of the 95% confidence interval around the risk-adjusted rate was greater than the across-hospital average. The hospital was classified as better than average if the upper end of the 95% confidence interval around the risk-adjusted rate was less than the across-hospital average. Similarly, for the Patient Safety and Adverse Events Composite (PSI 90), the hospitals were classified as better than average, average, or worse than average. The PSI 90 scores and confidence intervals were used as derived from the software for the calculation. Example calculations are provided in Table 5. |
| Table 5. Example hospital classification calculations | ||||
| Hospital | Calculated by the PSI software | Calculated by the authors | ||
|---|---|---|---|---|
| Hospital rate (per 1,000 discharges) for PSI | 95% confidence interval for PSI | Average hospital rate (i.e., the mean of the rate across hospitals) | Hospital classification | |
| Hospital A | 0.10 | (0.05-0.15) | 0.20 | Better than average |
| Hospital B | 0.20 | (0.15-0.25) | 0.20 | Average |
| Hospital C | 0.30 | (0.25-0.35) | 0.20 | Worse than average |
| Abbreviation: PSI, Patient Safety Indicator | ||||
Types of hospitals included in HCUP State Inpatient Databases This analysis used State Inpatient Databases (SID) limited to data from community hospitals, which are defined as short-term, non-Federal, general, and other hospitals, excluding hospital units of other institutions (e.g., prisons). Community hospitals include obstetrics and gynecology, otolaryngology, orthopedic, cancer, pediatric, public, and academic medical hospitals. Excluded for this analysis are long-term care facilities such as long-term acute care, rehabilitation, psychiatric, and alcoholism and chemical dependency hospitals. However, if a patient received long-term care, rehabilitation, or treatment for a psychiatric or chemical dependency condition in a community hospital, the discharge record for that stay was included in the analysis. Unit of analysis The unit of analysis for the calculation of the AHRQ PSI rates is the hospital discharge (i.e., hospital stay), not a person or patient (Table 2). The remaining tables and figures present information aggregated at the level of the hospital, as identified by each HCUP Partner organization. This may differ from the identification of hospitals according to the American Hospital Association that defines hospital entities based on financial ties.15 Hospitals were included in the analyses of risk-adjusted adverse patient safety events (PSIs 02-15) if there were at least 10 at-risk denominator cases in a given year. Hospitals were included in the analyses of the adverse patient safety event composite (PSI 90) if there were at least 10 at-risk denominator cases for at least 5 of the 10 component indicators in a given year. Hospital location The classification of whether a hospital is in an urban or rural location is based on Core Based Statistical Areas (CBSA). Hospitals located in counties with a CBSA type of "Division" or "Metro" were considered urban, and hospitals with a CBSA type of "Rural" or "Micropolitan" were classified as rural. The CBSA classification in 2011 was based on the 2000 Census; the CBSA classification in 2014 was based on the 2010 Census. Region Region is one of the four regions defined by the U.S. Census Bureau:
Payer is the expected payer for the hospital stay. To make coding uniform across all HCUP data sources, payer combines detailed categories into general groups:
About HCUP The Healthcare Cost and Utilization Project (HCUP, pronounced "H-Cup") is a family of healthcare databases and related software tools and products developed through a Federal-State-Industry partnership and sponsored by the Agency for Healthcare Research and Quality (AHRQ). HCUP databases bring together the data collection efforts of State data organizations, hospital associations, and private data organizations (HCUP Partners) and the Federal government to create a national information resource of encounter-level healthcare data. HCUP includes the largest collection of longitudinal hospital care data in the United States, with all-payer, encounter-level information beginning in 1988. These databases enable research on a broad range of health policy issues, including cost and quality of health services, medical practice patterns, access to healthcare programs, and outcomes of treatments at the national, State, and local market levels. HCUP would not be possible without the contributions of the following data collection Partners from across the United States: Alaska Department of Health and Social Services Alaska State Hospital and Nursing Home Association Arizona Department of Health Services Arkansas Department of Health California Office of Statewide Health Planning and Development Colorado Hospital Association Connecticut Hospital Association District of Columbia Hospital Association Florida Agency for Health Care Administration Georgia Hospital Association Hawaii Health Information Corporation Illinois Department of Public Health Indiana Hospital Association Iowa Hospital Association Kansas Hospital Association Kentucky Cabinet for Health and Family Services Louisiana Department of Health Maine Health Data Organization Maryland Health Services Cost Review Commission Massachusetts Center for Health Information and Analysis Michigan Health & Hospital Association Minnesota Hospital Association Mississippi State Department of Health Missouri Hospital Industry Data Institute Montana Hospital Association Nebraska Hospital Association Nevada Department of Health and Human Services New Hampshire Department of Health & Human Services New Jersey Department of Health New Mexico Department of Health New York State Department of Health North Carolina Department of Health and Human Services North Dakota (data provided by the Minnesota Hospital Association) Ohio Hospital Association Oklahoma State Department of Health Oregon Association of Hospitals and Health Systems Oregon Office of Health Analytics Pennsylvania Health Care Cost Containment Council Rhode Island Department of Health South Carolina Revenue and Fiscal Affairs Office South Dakota Association of Healthcare Organizations Tennessee Hospital Association Texas Department of State Health Services Utah Department of Health Vermont Association of Hospitals and Health Systems Virginia Health Information Washington State Department of Health West Virginia Department of Health and Human Resources, West Virginia Health Care Authority Wisconsin Department of Health Services Wyoming Hospital Association About the SID The HCUP State Inpatient Databases (SID) are hospital inpatient databases from data organizations participating in HCUP. The SID contain the universe of the inpatient discharge abstracts in the participating HCUP States, translated into a uniform format to facilitate multistate comparisons and analyses. Together, the SID encompass more than 95 percent of all U.S. community hospital discharges. The SID can be used to investigate questions unique to one State, to compare data from two or more States, to conduct market-area variation analyses, and to identify State-specific trends in inpatient care utilization, access, charges, and outcomes. About the AHRQ Quality Indicators™ AHRQ Quality Indicators (QIs) are standardized, evidence-based measures of healthcare quality that can be used with readily available hospital inpatient administrative data to measure and track clinical performance and outcomes. The evidence-based AHRQ QIs provide a standard, trusted approach to quality measurement to guide improvements in patient care. The QIs can be used to highlight potential quality improvement areas, identify areas for further study and investigation, and track changes over time. AHRQ offers free software to help organizations easily use the AHRQ QIs to generate actionable information about the quality of care they provide. The AHRQ QI modules include Prevention Quality Indicators, Inpatient Quality Indicators, Patient Safety Indicators, and Pediatric Quality Indicators. For more information, refer to the AHRQ Quality Indicator website located at www.qualityindicators.ahrq.gov. For More Information For other information on hospital patient safety and adverse events, refer to the HCUP Statistical Briefs located at www.hcup-us.ahrq.gov/reports/statbriefs/sb_adverse.jsp. For additional HCUP statistics, visit:
For a detailed description of HCUP and more information on the design of the State Inpatient Databases (SID), please refer to the following database documentation: Agency for Healthcare Research and Quality. Overview of the State Inpatient Databases (SID). Healthcare Cost and Utilization Project (HCUP). Rockville, MD: Agency for Healthcare Research and Quality. Updated April 2017. www.hcup-us.ahrq.gov/sidoverview.jsp. Accessed February 12, 2018. Suggested Citation Owens PL (AHRQ), Limcangco R (AHRQ), Barrett ML (M.L. Barrett, Inc.), Heslin KC (AHRQ), Moore BJ (IBM Watson Health). Patient Safety and Adverse Events, 2011 and 2014. HCUP Statistical Brief #237. February 2018. Agency for Healthcare Research and Quality, Rockville, MD. www.hcup-us.ahrq.gov/reports/statbriefs/sb237-Patient-Safety-Adverse-Events-2011-2014.pdf. *** AHRQ welcomes questions and comments from readers of this publication who are interested in obtaining more information about access, cost, use, financing, and quality of healthcare in the United States. We also invite you to tell us how you are using this Statistical Brief and other HCUP data and tools, and to share suggestions on how HCUP products might be enhanced to further meet your needs. Please e-mail us at hcup@ahrq.gov or send a letter to the address below:Sharon B. Arnold, Ph.D., Acting Director Center for Delivery, Organization, and Markets Agency for Healthcare Research and Quality 5600 Fishers Lane Rockville, MD 20857 This Statistical Brief was posted online on February 27, 2018. 1 U.S. Department of Health and Human Services. National Quality Strategy. 2015 Annual Progress Report to Congress: National Strategy for Quality Improvement in Health Care. www.ahrq.gov/sites/default/files/wysiwyg/workingforquality/nqs2015annlrpt.pdf. Accessed October 19, 2017. 2 Institute of Medicine. To Err Is Human: Building a Safer Health Care System. Washington, DC: National Academies Press; 1999. 3 Makary MA, Daniel M. Medical error-the third leading cause of death in the US. BMJ 2016; 353:i2139. 4 Wang Y, Eldridge N, Metersky ML, Verzier NR, Meehan TP, Pandolfi MM, et al. National trends in patient safety for four common conditions, 2005-2011. New England Journal of Medicine. 2014;370:341-51. 5 U.S. Department of Health and Human Services, 2015. Op cit. 6 More information is available at the AHRQ Quality Indicator website at www.qualityindicators.ahrq.gov/Modules/psi_resources.aspx. Accessed October 5, 2017. 7 Agency for Healthcare Research and Quality. Toolkit for Using the AHRQ Quality Indicators. Content last reviewed March 2017. Agency for Healthcare Research and Quality. www.ahrq.gov/professionals/systems/hospital/qitoolkit/index.html. Accessed November 2, 2017. 8 Agency for Healthcare Research and Quality. Patient Safety Indicators Technical Specifications Updates - Version 6.0 (ICD-9), July 2017. www.qualityindicators.ahrq.gov/Archive/PSI_TechSpec_ICD10_v60.aspx. Accessed October 27, 2021. 9 Calculated from HCUPnet. 2011 and 2014. Rockville, MD: Agency for Healthcare Research and Quality. In 2011, there were 29.1 million nonmaternal, nonneonatal discharges, and in 2014, there were 27.2 million nonmaternal, nonneonatal discharges. datatools.ahrq.gov/hcupnet. Accessed December 4, 2017. 10 The hospital was classified as worse than average if the low end of the 95% confidence interval around the risk-adjusted rate was larger than the across-hospital average; otherwise, the hospital was classified as average or better than average. For additional information, please see Hospital classification: better than average, average, worse than average in the Definitions section below. 11 The 10 risk-adjusted PSI rates contributing to PSI 90 are PSI 03, PSI 06, PSI 08, PSI 09, PSI 10, PSI 11, PSI 12, PSI 13, PSI 14, and PSI 15. For more details, see Patient Safety Indicators in the Definitions section or the AHRQ Quality Indicators PSI 90 Fact Sheet, available at www.qualityindicators.ahrq.gov/News/PSI90_Factsheet_FAQ_v2.pdf. 12 The PSI software is available at www.qualityindicators.ahrq.gov/Modules/psi_resources.aspx. 13 AHRQ Quality Indicators PSI 90 Fact Sheet. www.qualityindicators.ahrq.gov/News/PSI90_Factsheet_FAQ_v2.pdf. Accessed September 28, 2017. 14 Barrett ML, Owens PL, Bolhack J, Sheng M. Examination of the Coding of Present-on-Admission Indicators in Healthcare Cost and Utilization Project (HCUP) State Inpatient Databases (SID). 2015. HCUP Methods Series Report #2015-06 ONLINE. September 1, 2015. U.S. Agency for Healthcare Research and Quality. www.hcup-us.ahrq.gov/reports/methods/methods.jsp. Accessed December 20, 2017. 15 For additional information on HCUP hospital identifiers, please see www.hcup-us.ahrq.gov/db/maphosp.pdf. |
| Internet Citation: Statistical Brief #237. Healthcare Cost and Utilization Project (HCUP). February 2018. Agency for Healthcare Research and Quality, Rockville, MD. hcup-us.ahrq.gov/reports/statbriefs/sb237-Patient-Safety-Adverse-Events-2011-2014.jsp. |
| Are you having problems viewing or printing pages on this website? |
| If you have comments, suggestions, and/or questions, please contact hcup@ahrq.gov. |
| If you are experiencing issues related to Section 508 accessibility of information on this website, please contact hcup@ahrq.gov. |
| Privacy Notice, Viewers & Players |
| Last modified 2/22/18 |