STATISTICAL BRIEF #236 |
February 2018
Elisabeth Kato, M.D., M.R.P., Quyen Ngo-Metzger, M.D., M.P.H., Kathryn R. Fingar, Ph.D., M.P.H., Kimberly W. McDermott, Ph.D., and Anne Elixhauser, Ph.D. Introduction Atrial fibrillation, an abnormal heart rhythm or "arrhythmia" in which the upper chambers of the heart contract irregularly and inefficiently, affects 2.7-6.1 million Americans and is the most common type of heart arrhythmia.1 Atrial fibrillation occurs when underlying heart disease (such as ischemic heart disease, valvular heart disease, cardiomyopathy, or heart failure) damages the tissue of the atria and disrupts its ability to contract regularly. Symptoms include palpitations (fluttering sensation in the chest), dizziness, shortness of breath, syncope (fainting), and fatigue. However not all people with atrial fibrillation have symptoms, and some may be unaware that they have an arrhythmia. Atrial fibrillation is strongly associated with increasing age (affecting 0.2 percent of people under 55 years of age but 10 percent of those over 85 years old),2 obesity, and diabetes.3 These risk factors are becoming increasingly relevant in the United States, where the population is aging,4 the obesity epidemic is growing,5 and the prevalence of diabetes is rising.6 Other risk factors include hypertension, previous cardiothoracic surgery, smoking, prior stroke, sleep apnea, alcohol and drug use, and hyperthyroidism. The prevalence of atrial fibrillation has been increasing over the past few decades and is expected to continue to increase in coming years. This may be due to the increasing prevalence of some risk factors for atrial fibrillation (e.g., older age, obesity, and diabetes), although the prevalence of other risk factors is declining.7 Atrial fibrillation tends to progress over time, causing worsening symptoms and exacerbating heart failure. Atrial fibrillation also is an important cause of ischemic stroke. Without anticoagulation treatment, patients with atrial fibrillation have an approximately five-fold increased risk of stroke, and the strokes tend to be severe. Approximately one-third of patients with atrial fibrillation who experience a stroke die within the year, and up to 30 percent of survivors are permanently disabled.8 However for approximately 20 percent of patients who have a stroke associated with atrial fibrillation, the stroke is the first sign that they have atrial fibrillation.9,10,11 Treatment of atrial fibrillation has two components: managing the arrhythmia and preventing stroke. The arrhythmia can be managed through either controlling the heart rate to minimize symptoms (usually through medication) or putting the heart back into a normal rhythm. Methods for restoring normal rhythm include electrical or pharmacologic cardioversion and surgical or catheter ablation. There is some evidence that selected patients may be able to reverse atrial fibrillation through lifestyle changes that address the underlying causes of atrial fibrillation.12 For patients with atrial fibrillation whose stroke risk is high, the risk can be reduced through anticoagulation medications: originally warfarin, but more recently nonvitamin K antagonist oral anticoagulation drugs have become available. For nonpharmacologic approaches, a left atrial appendage closure device can also be used.13 Atrial fibrillation places a substantial burden on the U.S. healthcare system. A study of Medicare patients found that patients with atrial fibrillation were much more likely to be hospitalized (37.5 percent vs. 17.5 percent) and much more likely to die during hospitalization (2.1 percent vs. 0.1 percent) than were similar patients without atrial fibrillation.14 Hospital costs were $8,705 higher for patients with atrial fibrillation than for those without.15 This pattern of higher hospitalization costs has also been documented for younger patients with atrial fibrillation.16 This Healthcare Cost and Utilization Project (HCUP) Statistical Brief presents data on inpatient stays involving atrial fibrillation among adults from 1998 through 2014. First, age-related trends in inpatient stays involving atrial fibrillation are examined. Second, sociodemographic and clinical characteristics of inpatient stays involving atrial fibrillation among adults are presented. Common diagnoses and procedures for these stays are shown. Additionally, hospital stays involving atrial fibrillation as a co-occurring condition alongside ischemic stroke are examined within subgroups of patients. Differences of 10 percent or greater are noted in the text. Findings Age-related trends in inpatient stays involving atrial fibrillation, 1998-2014 Figure 1 displays trends in the unadjusted and age-adjusted population rates of inpatient stays involving any diagnosis (all-listed, principal or secondary) of atrial fibrillation from 1998 through 2014 per 100,000 adults aged 18 years or older. |
|
|
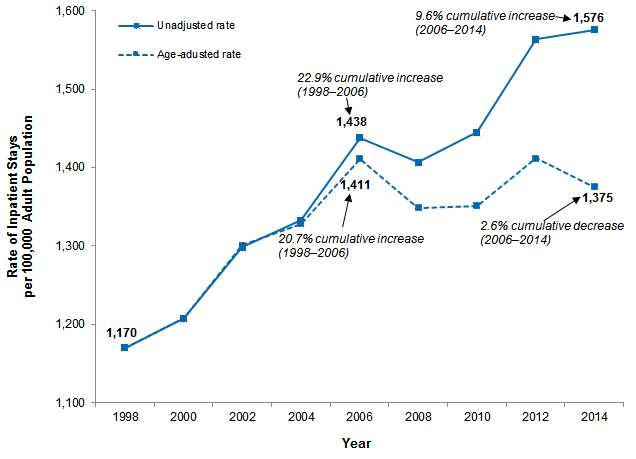
Figure 1. Population rates of inpatient stays involving atrial fibrillation among adults, unadjusted and adjusted for age, 1998-2014
Notes: Rates are based on all-listed diagnosis of atrial fibrillation. Age adjustment was performed using direct standardization with the 1998 age distribution as the reference population. Line graph that shows the rate of inpatient stays per 100,000 population for stays involving atrial fibrillation among adults from 1998 to 2014, unadjusted and adjusted for age. Unadjusted rate: increased steadily from 1,170 in 1998 to 1,438 in 2006, for a cumulative increase of 22.9% from 1998 to 2006; decreased to 1,407 in 2008, and then increased steadily to 1,576 in 2014, for a cumulative increase of 9.6% from 2006 to 2014. Age-adjusted rate: increased steadily from 1,170 in 1998 to 1,411 in 2006, for a cumulative increase of 20.7% from 1998 to 2006; decreased to 1,349 in 2008, increased steadily to 1,412 in 2012, and then decreased to 1,375 in 2014, for a cumulative decrease of 2.6% from 2006 to 2014.
|
|
|
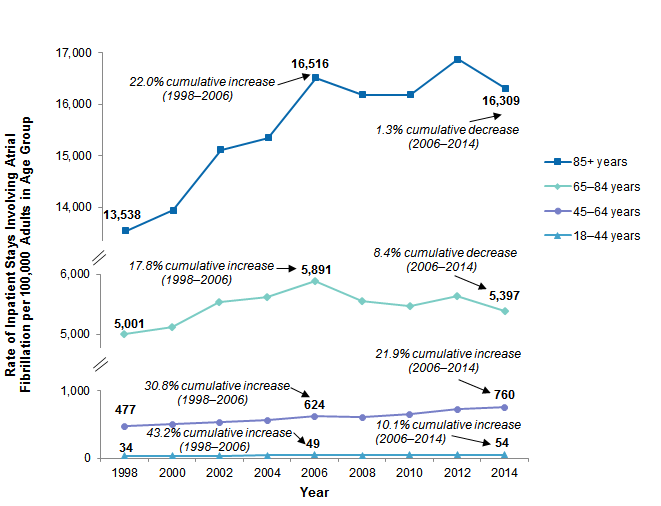
Figure 2. Population rate of inpatient stays involving atrial fibrillation among adults, by age group, with cumulative changes from 1998 to 2006 and from 2006 to 2014
Notes: Rates are based on all-listed diagnosis of atrial fibrillation. Cumulative changes are calculated using nonrounded rates. Line graph that shows the rate of inpatient stays involving atrial fibrillation per 100,000 adults by age from 1998 to 2014. 18-44 years: increased steadily from 34 in 1998 to 49 in 2006, for a cumulative increase of 43.2% from 1998 to 2006; decreased to 47 in 2008, and then increased steadily to 54 in 2014, for a cumulative increase of 10.1% from 2006 to 2014. 45-64 years: increased steadily from 477 in 1998 to 624 in 2006, for a cumulative increase of 30.8% from 1998 to 2006; decreased to 606 in 2008, and then increased steadily to 760 in 2014, for a cumulative increase of 21.9% from 2006 to 2014. 65-84 years: increased steadily from 5,001 in 1998 to 5,891 in 2006, for a cumulative increase of 17.8% from 1998 to 2006; decreased to 5,465 in 2010, increased to 5,637 in 2012, and then decreased to 5,397 in 2014, for a cumulative decrease of 8.4% from 2006 to 2014. 85+ years: increased steadily from 13,538 in 1998 to 16,516 in 2006, for a cumulative increase of 22.0% from 1998 to 2006; decreased to 16,181 in 2008, increased to 16,876 in 2012, and then decreased to 16,309 in 2014, for a cumulative decrease of 1.3% from 2006 to 2014. |
Table 1 presents the number and rate of inpatient stays among adults aged 18 years or older with all-listed diagnosis of atrial fibrillation by select patient and hospital characteristics in 2014. |
| Table 1. Characteristics of adult inpatient stays with atrial fibrillation, 2014 | |||||
| Characteristic | Number | Rate per 100,000 adult population | Characteristic | Number | Rate per 100,000 adult population |
|---|---|---|---|---|---|
| Total | 3,865,447 | 1,590 | Community-level income, quartile | ||
| Age group, years | First (poorest) | 986,156 | 1,662 | ||
| 18-44 | 62,130 | 54 | Second | 1,074,315 | 1,681 |
| 45-64 | 635,265 | 757 | Third | 912,185 | 1,526 |
| 65-84 | 2,163,051 | 5,520 | Fourth (wealthiest) | 823,466 | 1,370 |
| 85+ | 1,005,001 | 16,830 | Location of patient residence | ||
| Sex | Large metropolitan | 1,979,942 | 1,485 | ||
| Male | 1,985,726 | 1,679 | Small metropolitan | 1,179,376 | 1,595 |
| Female | 1,879,361 | 1,505 | Micropolitan | 394,854 | 1,866 |
| Race/ethnicity | Rural | 301,065 | 2,053 | ||
| White | 3,026,277 | 1,903 | Hospital region | ||
| Black | 307,765 | 1,080 | Northeast | 794,615 | 1,807 |
| Hispanic | 195,195 | 524 | Midwest | 952,399 | 1,840 |
| Asian/Pacific Islander | 66,425 | 523 | South | 1,453,682 | 1,601 |
| Other | 88,015 | 1,542 | West | 664,750 | 1,175 |
| Note: Number and rate are based on all-listed diagnosis of atrial fibrillation. Source: Agency for Healthcare Research and Quality (AHRQ), Center for Delivery, Organization, and Markets, Healthcare Cost and Utilization Project (HCUP), National Inpatient Sample (NIS), 2014 | |||||
|
| Table 2. Common diagnoses among adult inpatient stays involving atrial fibrillation, 2014 | |||
| Diagnosisa | Rank | Number | % |
|---|---|---|---|
| Secondary diagnosis among stays with a principal diagnosis of atrial fibrillation | 398,890 | 100.0 | |
| Coronary atherosclerosis and other heart disease | 1 | 249,190 | 62.5 |
| Congestive heart failure | 2 | 231,855 | 58.1 |
| Essential hypertension | 3 | 227,290 | 57.0 |
| Disorders of lipid metabolism | 4 | 204,345 | 51.2 |
| Screening and history of mental health and substance abuse | 5 | 124,005 | 31.1 |
| Cardiac dysrhythmias | 6 | 118,355 | 29.7 |
| Fluid and electrolyte disorders | 7 | 114,665 | 28.7 |
| Heart valve disorders | 8 | 106,565 | 26.7 |
| Diabetes mellitus without complication | 9 | 94,510 | 23.7 |
| Esophageal disorders | 10 | 83,780 | 21.0 |
| Principal diagnosis among stays with a secondary diagnosis of atrial fibrillation | 3,466,556 | 100.0 | |
| Congestive heart failure | 1 | 378,325 | 10.9 |
| Septicemia | 2 | 295,170 | 8.5 |
| Pneumonia | 3 | 157,010 | 4.5 |
| Acute cerebrovascular disease | 4 | 138,980 | 4.0 |
| Acute myocardial infarction | 5 | 108,185 | 3.1 |
| Chronic obstructive pulmonary disease | 6 | 99,070 | 2.9 |
| Cardiac dysrhythmias | 7 | 96,625 | 2.8 |
| Acute and unspecified renal failure | 8 | 93,945 | 2.7 |
| Complication of device; implant or graft | 9 | 83,430 | 2.4 |
| Respiratory failure; insufficiency; arrest | 10 | 82,775 | 2.4 |
| Notes: Diagnoses are grouped according to AHRQ's Clinical Classifications Software (CCS). Categories for residual codes and "other" categories that group a heterogenous set of codes are not shown. a The diagnoses shown correspond to all-listed secondary diagnoses among stays with a principal diagnosis of atrial fibrillation, or the principal co-occurring diagnosis among stays with a secondary diagnosis of atrial fibrillation. Source: Agency for Healthcare Research and Quality (AHRQ), Center for Delivery, Organization, and Markets, Healthcare Cost and Utilization Project (HCUP), National Inpatient Sample (NIS), 2014 | |||
|
|
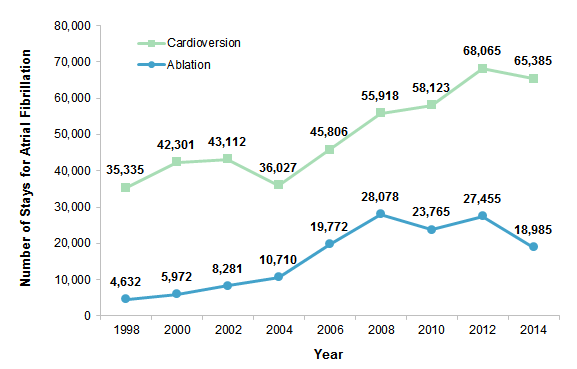
Figure 3. Number of cardioversion and ablation procedures among adult inpatient stays with a principal diagnosis of atrial fibrillation, 1998-2014
Notes: Data are based on all-listed procedures. Thus, if cardioversion and ablation were both indicated on the record, the stay was counted in both categories. Among stays with a secondary diagnosis of atrial fibrillation, cardioversion and ablation each constituted less than 2 percent of stays and are therefore not shown. Line graph that shows the number of cardioversions and ablations among adult inpatient stays with a principal diagnosis of atrial fibrillation from 1998 to 2014. Cardioversions: increased from 35,335 in 1998 to 43,112 in 2002, decreased to 36,027 in 2004, increased steadily to 68,065 in 2012, and decreased to 65,385 in 2014. Ablations: increased steadily from 4,632 in 1998 to 28,078 in 2008, decreased to 23,765 in 2010, increased to 27,455 in 2012, and decreased to 18,985 in 2014. |
|
|
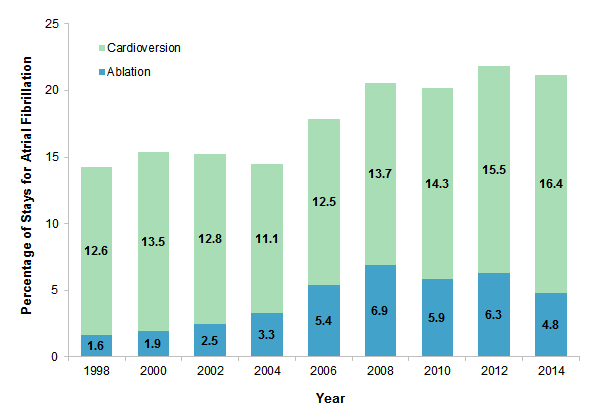
Figure 4. Percentage of stays involving cardioversion and ablation procedures among adult inpatient stays with a principal diagnosis of atrial fibrillation, 1998-2014
Note: Data are based on all-listed procedures. Thus, if cardioversion and ablation were both indicated on the record, the stay was counted in both categories. Bar chart showing the percentage of stays involving cardioversions and ablations among adult inpatient stays with a principal diagnosis of atrial fibrillation from 1998 to 2014. Cardioversions: 1998, 12.6; 2000, 13.5; 2002, 12.8; 2004, 11.1; 2006, 12.5; 2008, 13.7; 2010, 14.3; 2012, 15.5; 2014, 16.4. Ablations: 1998, 1.6; 2000, 1.9; 2002, 2.5; 2004, 3.3; 2006, 5.4; 2008, 6.9; 2010, 5.9; 2012, 6.3; 2014, 4.8. |
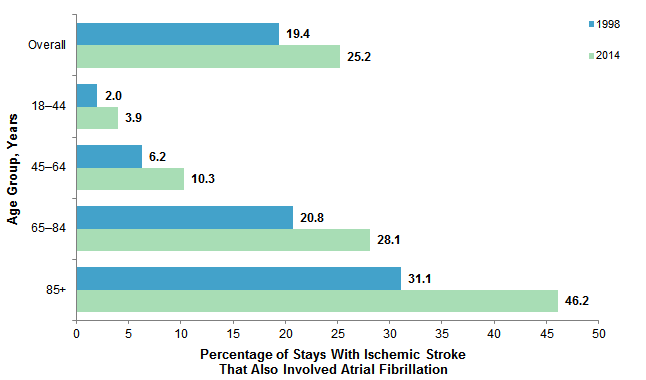
Inpatient stays involving ischemic stroke with atrial fibrillation, as compared with strokes of other etiologies, have become increasingly common. Analysis of these data shows that in 1998, stays for ischemic stroke involving etiologies other than atrial fibrillation were over 4 times more common than stays for ischemic stroke with atrial fibrillation (data not shown). Yet in 2014, stays for ischemic stroke involving etiologies other than atrial fibrillation were only 3 times more common than stays for ischemic stroke with atrial fibrillation (data not shown). Figure 5 presents the percentage of stays with an all-listed diagnosis of ischemic stroke for which atrial fibrillation was a co-occurring condition, overall and by age group, in 1998 versus 2014. |
|
Figure 5. Percentage of adult inpatient stays with ischemic stroke that also involved atrial fibrillation, overall and by age group, 1998 and 2014
Note: Percentages are based on all-listed diagnoses of atrial fibrillation and ischemic stroke. Bar chart that shows the percentage of adult inpatient stays involving atrial fibrillation among stays with ischemic stroke by age in 1998 and 2014. Overall: 1998, 19.4; 2014, 25.2. 18-44 years: 1998, 2.0; 2014, 3.9. 45-64 years: 1998, 6.2; 2014, 10.3. 65-84 years: 1998, 20.8; 2014, 28.1. 85+ years: 1998, 31.1; 2014, 46.2. |
|
|
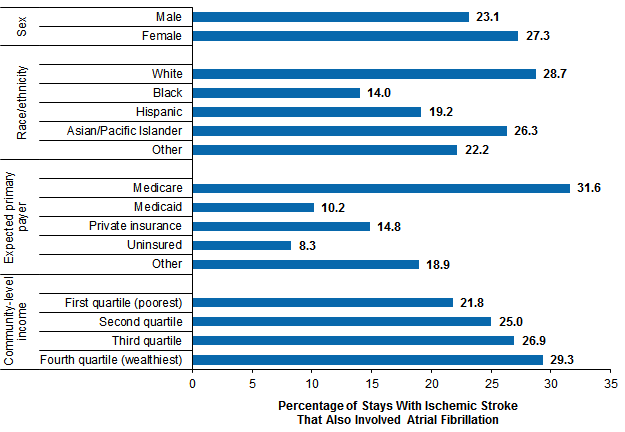
Figure 6. Percentage of adult inpatient stays with ischemic stroke that also involved atrial fibrillation, by patient characteristics, 2014
Source: Agency for Healthcare Research and Quality (AHRQ), Center for Delivery, Organization, and Markets, Healthcare Cost and Utilization Project (HCUP), National Inpatient Sample (NIS), 2014 Bar chart that shows the percentage of adult inpatient stays involving atrial fibrillation among stays with ischemic stroke by age in 1998 and 2014. Overall: 1998, 19.4; 2014, 25.2. 18-44 years: 1998, 2.0; 2014, 3.9. 45-64 years: 1998, 6.2; 2014, 10.3. 65-84 years: 1998, 20.8; 2014, 28.1. 85+ years: 1998, 31.1; 2014, 46.2. |
HCUP Statistical Briefs provide basic descriptive statistics on a variety of topics using HCUP administrative healthcare data. Topics include hospital inpatient, ambulatory surgery, and emergency department use and costs, quality of care, access to care, medical conditions, procedures, and patient populations, among other topics. The reports are intended to generate hypotheses that can be further explored in other research; the reports are not designed to answer in-depth research questions using multivariate methods. Data Source The estimates in this Statistical Brief are based upon data from the Healthcare Cost and Utilization Project (HCUP) 2014 National Inpatient Sample (NIS). Historical data were drawn from the 1998-2013 National (Nationwide) Inpatient Sample (NIS). Supplemental sources included population denominator data for use with HCUP databases, derived from information available from the U.S. Census Bureau17 and Claritas, a vendor that compiles and adds value to census data.18 Definitions Diagnoses, procedures, ICD-9-CM, Clinical Classifications Software (CCS) The principal diagnosis is that condition established after study to be chiefly responsible for the patient's admission to the hospital. Secondary diagnoses are concomitant conditions that coexist at the time of admission or develop during the stay. All-listed diagnoses include the principal diagnosis plus these additional secondary conditions. All-listed procedures include all procedures performed during the hospital stay, whether for definitive treatment or for diagnostic or exploratory purposes. The first-listed procedure is the procedure that is listed first on the discharge record. Inpatient data define this as the principal procedure—the procedure that is performed for definitive treatment rather than for diagnostic or exploratory purposes (i.e., the procedure that was necessary to take care of a complication). ICD-9-CM is the International Classification of Diseases, Ninth Revision, Clinical Modification, which assigns numeric codes to diagnoses and procedures. There are approximately 14,000 ICD-9-CM diagnosis codes. There are approximately 4,000 ICD-9-CM procedure codes. CCS categorizes ICD-9-CM diagnosis codes and procedure codes into a manageable number of clinically meaningful categories.19 This clinical grouper makes it easier to quickly understand patterns of diagnoses and procedure use. CCS categories identified as Other typically are not reported; these categories include miscellaneous, otherwise unclassifiable diagnoses and procedures that may be difficult to interpret as a group. Case definition Atrial fibrillation was defined using the following ICD-9-CM diagnosis code:
Types of hospitals included in the HCUP National (Nationwide) Inpatient Sample The National (Nationwide) Inpatient Sample (NIS) is based on data from community hospitals, which are defined as short-term, non-Federal, general, and other hospitals, excluding hospital units of other institutions (e.g., prisons). The NIS includes obstetrics and gynecology, otolaryngology, orthopedic, cancer, pediatric, public, and academic medical hospitals. Excluded are long-term care facilities such as rehabilitation, psychiatric, and alcoholism and chemical dependency hospitals. Beginning in 2012, long-term acute care hospitals are also excluded. However, if a patient received long-term care, rehabilitation, or treatment for a psychiatric or chemical dependency condition in a community hospital, the discharge record for that stay will be included in the NIS. Unit of analysis The unit of analysis is the hospital discharge (i.e., the hospital stay), not a person or patient. This means that a person who is admitted to the hospital multiple times in 1 year will be counted each time as a separate discharge from the hospital. Location of patients' residence Place of residence is based on a simplified adaptation of the Urban Influence Codes (UIC) developed by the United States Department of Agriculture (USDA) Economic Research Service (ERS). The 12 categories of the UIC are combined into 4 broader categories that differentiate between large metropolitan (at least 1 million residents), small metropolitan (less than 1 million residents), micropolitan, and rural areas. Community-level income Community-level income is based on the median household income of the patient's ZIP Code of residence. Quartiles are defined so that the total U.S. population is evenly distributed. Cut-offs for the quartiles are determined annually using ZIP Code demographic data obtained from Claritas, a vendor that adds value to data from the U.S. Census Bureau.20 The value ranges for the income quartiles vary by year. The income quartile is missing for patients who are homeless or foreign. Payer Payer is the expected payer for the hospital stay. To make coding uniform across all HCUP data sources, payer combines detailed categories into general groups:
For this Statistical Brief, when more than one payer is listed for a hospital discharge, the first-listed payer is used. Region Region is one of the four regions defined by the U.S. Census Bureau:
Data on Hispanic ethnicity are collected differently among the States and also can differ from the census methodology of collecting information on race (White, Black, Asian/Pacific Islander, American Indian/Alaska Native, Other (including mixed race)) separately from ethnicity (Hispanic, non-Hispanic). State data organizations often collect Hispanic ethnicity as one of several categories that include race. Therefore, for multistate analyses, HCUP creates the combined categorization of race and ethnicity for data from States that report ethnicity separately. When a State data organization collects Hispanic ethnicity separately from race, HCUP uses Hispanic ethnicity to override any other race category to create a Hispanic category for the uniformly coded race/ethnicity data element, while also retaining the original race and ethnicity data. This Statistical Brief reports race/ethnicity for the following categories: Hispanic, non-Hispanic White, non-Hispanic Black, Asian/Pacific Islander, and Other. About HCUP The Healthcare Cost and Utilization Project (HCUP, pronounced "H-Cup") is a family of healthcare databases and related software tools and products developed through a Federal-State-Industry partnership and sponsored by the Agency for Healthcare Research and Quality (AHRQ). HCUP databases bring together the data collection efforts of State data organizations, hospital associations, and private data organizations (HCUP Partners) and the Federal government to create a national information resource of encounter-level healthcare data. HCUP includes the largest collection of longitudinal hospital care data in the United States, with all-payer, encounter-level information beginning in 1988. These databases enable research on a broad range of health policy issues, including cost and quality of health services, medical practice patterns, access to healthcare programs, and outcomes of treatments at the national, State, and local market levels. HCUP would not be possible without the contributions of the following data collection Partners from across the United States: Alaska Department of Health and Social Services Alaska State Hospital and Nursing Home Association Arizona Department of Health Services Arkansas Department of Health California Office of Statewide Health Planning and Development Colorado Hospital Association Connecticut Hospital Association District of Columbia Hospital Association Florida Agency for Health Care Administration Georgia Hospital Association Hawaii Health Information Corporation Illinois Department of Public Health Indiana Hospital Association Iowa Hospital Association Kansas Hospital Association Kentucky Cabinet for Health and Family Services Louisiana Department of Health Maine Health Data Organization Maryland Health Services Cost Review Commission Massachusetts Center for Health Information and Analysis Michigan Health & Hospital Association Minnesota Hospital Association Mississippi State Department of Health Missouri Hospital Industry Data Institute Montana Hospital Association Nebraska Hospital Association Nevada Department of Health and Human Services New Hampshire Department of Health & Human Services New Jersey Department of Health New Mexico Department of Health New York State Department of Health North Carolina Department of Health and Human Services North Dakota (data provided by the Minnesota Hospital Association) Ohio Hospital Association Oklahoma State Department of Health Oregon Association of Hospitals and Health Systems Oregon Office of Health Analytics Pennsylvania Health Care Cost Containment Council Rhode Island Department of Health South Carolina Revenue and Fiscal Affairs Office South Dakota Association of Healthcare Organizations Tennessee Hospital Association Texas Department of State Health Services Utah Department of Health Vermont Association of Hospitals and Health Systems Virginia Health Information Washington State Department of Health West Virginia Department of Health and Human Resources, West Virginia Health Care Authority Wisconsin Department of Health Services Wyoming Hospital Association About the NIS The HCUP National (Nationwide) Inpatient Sample (NIS) is a nationwide database of hospital inpatient stays. The NIS is nationally representative of all community hospitals (i.e., short-term, non-Federal, nonrehabilitation hospitals). The NIS includes all payers. It is drawn from a sampling frame that contains hospitals comprising more than 95 percent of all discharges in the United States. The vast size of the NIS allows the study of topics at the national and regional levels for specific subgroups of patients. In addition, NIS data are standardized across years to facilitate ease of use. Over time, the sampling frame for the NIS has changed; thus, the number of States contributing to the NIS varies from year to year. The NIS is intended for national estimates only; no State-level estimates can be produced. The 2012 NIS was redesigned to optimize national estimates. The redesign incorporates two critical changes:
For More Information For other information on cardiovascular diseases in the United States, refer to the HCUP Statistical Briefs located at www.hcup-us.ahrq.gov/reports/statbriefs/sb_heart.jsp. For additional HCUP statistics, visit:
For a detailed description of HCUP and more information on the design of the National (Nationwide) Inpatient Sample (NIS), please refer to the following database documentation: Agency for Healthcare Research and Quality. Overview of the National (Nationwide) Inpatient Sample (NIS). Healthcare Cost and Utilization Project (HCUP). Rockville, MD: Agency for Healthcare Research and Quality. Updated December 2016. www.hcup-us.ahrq.gov/nisoverview.jsp. Accessed January 31, 2017. Suggested Citation Kato E (AHRQ), Ngo-Metzger Q (AHRQ), Fingar KR (IBM Watson Health), McDermott KW (IBM Watson Health), Elixhauser A (AHRQ). Inpatient Stays Involving Atrial Fibrillation, 1998-2014. HCUP Statistical Brief #236. February 2018. Agency for Healthcare Research and Quality, Rockville, MD. www.hcup-us.ahrq.gov/reports/statbriefs/sb236-Atrial-Fibrillation-Hospital-Stays-Trends.pdf. Acknowledgments The authors would like to acknowledge the contributions of Minya Sheng of IBM Watson Health. *** AHRQ welcomes questions and comments from readers of this publication who are interested in obtaining more information about access, cost, use, financing, and quality of healthcare in the United States. We also invite you to tell us how you are using this Statistical Brief and other HCUP data and tools, and to share suggestions on how HCUP products might be enhanced to further meet your needs. Please e-mail us at hcup@ahrq.gov or send a letter to the address below:Sharon B. Arnold, Ph.D., Acting Director Center for Delivery, Organization, and Markets Agency for Healthcare Research and Quality 5600 Fishers Lane Rockville, MD 20857 This Statistical Brief was posted online on February 2, 2018. 1 Centers for Disease Control and Prevention. Atrial Fibrillation Fact Sheet. Updated August 22, 2017. www.cdc.gov/dhdsp/data_statistics/fact_sheets/fs_atrial_fibrillation.htm. Accessed September 28, 2017. Original source is no longer available on the Web. For related information refer to: Centers for Disease Control and Prevention. Atrial Fibrillation. Updated September 27, 2021. www.cdc.gov/heartdisease/atrial_fibrillation.htm. Accessed October 27, 2021. 2 Go AS, Hylek EM, Phillips KA, Chang Y, Henault LE, Selby JV, et al. Prevalence of diagnosed atrial fibrillation in adults: national implications for rhythm management and stroke prevention: the AnTicoagulation and Risk Factors in Atrial Fibrillation (ATRIA) Study. JAMA. 2001;285(18):2370-5. 3 Centers for Disease Control and Prevention, 2017. Op. cit. 4 Ortman JM, Velkoff VA, Hogan H. An Aging Nation: The Older Population in the United States. May 2014. U.S. Census Bureau. www.census.gov/prod/2014pubs/p25-1140.pdf. Accessed November 20, 2017. 5 Ogden CL, Carroll MD, Fryar CD, Flegal KM. Prevalence of Obesity Among Adults and Youth: United States, 2011-2014. NCHS Data Brief #219. November 2015. Centers for Disease Control and Prevention. www.cdc.gov/nchs/data/databriefs/db219.pdf. Accessed November 20, 2017. 6 Centers for Disease Control and Prevention, Division of Diabetes Translation. Long-term Trends in Diabetes. April 2017. www.cdc.gov/diabetes/statistics/slides/long_term_trends.pdf. Accessed November 20, 2017. 7 Mozaffarian D, Benjamin EJ, Go AS, Arnett DK, Blaha MJ, Cushman M, et al. Heart disease and stroke statistics—2015 update: a report from the American Heart Association. Circulation. 2015;131:e29-e322. 8Menke J, Luthje L, Kastrup A, Larsen J. Thromboembolism in atrial fibrillation. American Journal of Cardiology. 2010;105(4):502-10. 9 Wolf PA, Kannel WB, McGee DL, Meeks SL, Bharucha NE, McNamara PM. Duration of atrial fibrillation and imminence of stroke: the Framingham study. Stroke. 1983t;14(5):664-7. 11 Hannon N, Sheehan O, Kelly L, Marnane M, Merwick A, Moore A, et al. Stroke associated with atrial fibrillation—incidence and early outcomes in the north Dublin population stroke study. Cerebrovascular Disease. 2010;29(1):43-9. 12 Pathak RK, Elliott A, Middeldorp ME, Meredith M, Mehta AB, Mahajan R, et al. Impact of CARDIOrespiratory FITness on arrhythmia recurrence in obese individuals with atrial fibrillation: the CARDIO-FIT Study. Journal of the American College of Cardiology. 2015;66(9):985-96. 13 Akin I, Nienaber CA. Left atrial appendage occlusion: a better alternative to anticoagulation?. World Journal of Cardiology. 2017 Feb 26;9(2):139–46. 14 Kim MH, Johnston SS, Chu BC, Dalal MR, Schulman KL. Estimation of total incremental healthcare costs in patients with atrial fibrillation in the United States. Circulation: Cardiovascular Quality and Outcomes. 2011;4:313-20. 15 Ibid. 16 Wang G, Joo H, Tong X, George M. Hospital costs associated with atrial fibrillation for patients with ischemic stroke aged 18-64 years in the United States. Stroke. 2015;46:1314-20. 17 Barrett M, McCarty J, Coffey R, Levit K. Population Denominator Data for Use with the HCUP Databases (Updated with 2015 Population Data). HCUP Methods Series Report #2016-04. September 29, 2016. U.S. Agency for Healthcare Research and Quality. www.hcup-us.ahrq.gov/reports/methods/2016-04.pdf. Accessed January 31, 2017. 18 Claritas. Claritas Demographic Profile. www.claritas.com. 19 Agency for Healthcare Research and Quality. HCUP Clinical Classifications Software (CCS) for ICD-9-CM. Healthcare Cost and Utilization Project (HCUP). Rockville, MD: Agency for Healthcare Research and Quality. Updated October 2016. www.hcup-us.ahrq.gov/toolssoftware/ccs/ccs.jsp. Accessed January 31, 2017. 20 Claritas. Claritas Demographic Profile. www.claritas.com. |
| Internet Citation: Statistical Brief #236. Healthcare Cost and Utilization Project (HCUP). February 2018. Agency for Healthcare Research and Quality, Rockville, MD. www.hcup-us.ahrq.gov/reports/statbriefs/sb236-Atrial-Fibrillation-Hospital-Stays-Trends.jsp?utm_source=ahrq&utm_medium=en1&utm_term=&utm_content=1&utm_campaign=ahrq_en2_6_2018. |
| Are you having problems viewing or printing pages on this website? |
| If you have comments, suggestions, and/or questions, please contact hcup@ahrq.gov. |
| Privacy Notice, Viewers & Players |
| Last modified 2/16/18 |