STATISTICAL BRIEF #228 |
October 2017
Adela M. Miller, B.S., Claudia A. Steiner, M.D., M.P.H., Marguerite L. Barrett, M.S., Kathryn R. Fingar, Ph.D., M.P.H., and Anne Elixhauser, Ph.D. Introduction After a mastectomy (surgical removal of the breast), a woman faces a complex and emotional decision about whether to have breast reconstruction or live without a breast or breasts. There are usually three main considerations in the decision: medical, sexual, and physical. Medical considerations include concerns that breast reconstruction surgery lengthens recovery time and increases the chance for infection and other postoperative complications. Sexual considerations involve the impact of the mastectomy on future sexual encounters. Physical features include how breasts may define femininity and sense of self.1 Several previous studies have shown an increase in breast reconstruction for mastectomy.2,3,4 One study used a 2007 national surgical database, another study used 2008 claims-based data of women insured through large private employers, and a third study used the Nationwide Inpatient Sample (NIS) for 2005-2011,5,6,7 part of the Healthcare Cost and Utilization Project (HCUP). This HCUP Statistical Brief presents data on reconstruction surgeries for mastectomy among adult women over a 5-year time period from 2009 through 2014, overall and by patient and hospital characteristics. Reconstructions are examined across two hospital settings: hospital inpatient and hospital-based ambulatory surgery. Reconstructions that occurred during the same surgical stay or visit as the mastectomy are examined separately from those that occurred during another stay or visit following the mastectomy. The total number of mastectomies in each year is also presented for reference. Reconstructive surgeries are examined as a rate per 100,000 adult females in the population and as a ratio relative to the total number of mastectomies in the calendar year in these data. For women who had breast reconstruction at a separate stay or visit following their mastectomy, we use the denominator of mastectomies for that calendar year, although the mastectomy may have occurred in previous years. This approach provides a stable denominator for both simultaneous and nonsimultaneous breast reconstructions for each calendar year. The analysis is limited to hospitals and ambulatory surgery centers within 22 States—representing 59 percent of the U.S. population—for which reconstructions and mastectomies could be identified in both the inpatient and ambulatory surgery settings. All differences between estimates noted in the text are at least 10 percent. |
|
Findings
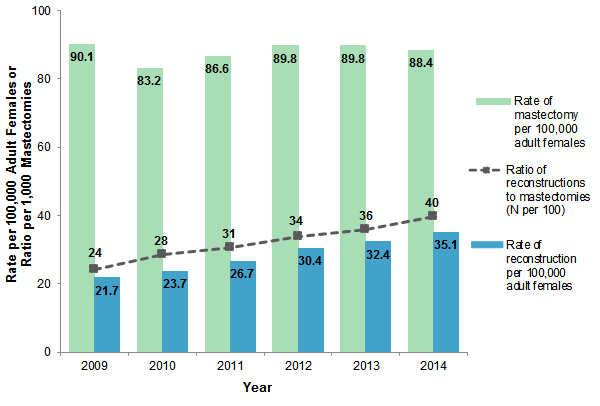
Trends in breast reconstructive surgeries for mastectomy, 2009-2014 Figure 1 displays the rate of mastectomy (unilateral and bilateral combined) and the rate of reconstructive surgery for mastectomy per 100,000 females in the population aged 18 years or older from 2009 through 2014. Inpatient and ambulatory surgeries are combined. The ratio of reconstructions to mastectomies also is shown. A higher ratio in one year, compared with another suggests that a greater number of women who underwent mastectomy had reconstructive surgery, regardless of whether the mastectomy was in the same year. |
|
Figure 1. Rates of mastectomy and breast reconstructive surgery for mastectomy, 2009-2014
Source: Agency for Healthcare Research and Quality (AHRQ), Center for Delivery, Organization, and Markets, Healthcare Cost and Utilization Project (HCUP), State Inpatient Databases (SID) and State Ambulatory Surgery and Services Databases (SASD) from 22 States, 2009-2014 Bar chart showing rates of mastectomy and breast reconstruction surgery per 100,000 adult females, 2009-2014. 2009: rate of mastectomy, 90.1; rate of reconstruction, 21.7; number of reconstructions per 100 mastectomies, 24. 2010: rate of mastectomy, 83.2; rate of reconstruction, 23.7; number of reconstructions per 100 mastectomies, 28. 2011: rate of mastectomy, 86.6; rate of reconstruction, 26.7; number of reconstructions per 100 mastectomies, 31. 2012: rate of mastectomy, 89.8; rate of reconstruction, 30.4; number of reconstructions per 100 mastectomies, 34. 2013: rate of mastectomy, 89.8; rate of reconstruction, 32.4; number of reconstructions per 100 mastectomies, 36. 2014: rate of mastectomy, 88.4; rate of reconstruction, 35.1; number of reconstructions per 100 mastectomies, 40.
|
|
| Table 1. Rates of mastectomy and reconstruction, ratio of all reconstructive surgeries to all mastectomies, and percent change, by patient and hospital characteristics, 2009 and 2014 | |||||||
| Characteristic | Rate of mastectomy per 100,000 adult females | Rate of reconstruction per 100,000 adult females | Ratio of all reconstructive surgeries to all mastectomies, N per 100 | Percent change in ratio, 2009-2014 | |||
|---|---|---|---|---|---|---|---|
| 2009 | 2014 | 2009 | 2014 | 2009 | 2014 | ||
| Total | 90.1 | 88.4 | 21.7 | 35.1 | 24 | 40 | 65 |
| Patient characteristic | |||||||
| Age, years | |||||||
| 18-34 | 8.9 | 11.6 | 3.1 | 5.6 | 35 | 48 | 37 |
| 35-44 | 65.3 | 75.1 | 24.4 | 41.2 | 37 | 55 | 47 |
| 45-54 | 119.9 | 122.8 | 44.2 | 70.4 | 37 | 57 | 56 |
| 55-64 | 143.8 | 130.0 | 38.7 | 55.1 | 27 | 42 | 57 |
| 65+ | 163.4 | 142.5 | 11.7 | 24.3 | 7 | 17 | 140 |
| Community income quartile | |||||||
| Quartile 1 (poorest) | 78.1 | 77.4 | 13.3 | 22.9 | 17 | 30 | 74 |
| Quartile 2 | 84.0 | 82.7 | 17.4 | 29.3 | 21 | 35 | 71 |
| Quartile 3 | 88.8 | 89.4 | 22.0 | 37.2 | 25 | 42 | 68 |
| Quartile 4 (wealthiest) | 101.5 | 98.4 | 31.5 | 48.2 | 31 | 49 | 58 |
| Patient residence | |||||||
| Urban | 89.5 | 88.0 | 22.6 | 36.2 | 25 | 41 | 63 |
| Rural | 92.0 | 90.3 | 15.9 | 26.5 | 17 | 29 | 70 |
| Expected payera | |||||||
| Medicare | —b | —b | —b | —b | 8 | 19 | 130 |
| Medicaid | —b | —b | —b | —b | 19 | 37 | 91 |
| Private | —b | —b | —b | —b | 35 | 52 | 51 |
| Uninsured | —b | —b | —b | —b | 21 | 44 | 104 |
| Hospital characteristic | |||||||
| Hospital location | |||||||
| Urban | —b | —b | —b | —b | 25 | 41 | 62 |
| Rural | —b | —b | —b | —b | 6 | 12 | 99 |
| Teaching status | |||||||
| Nonteaching | —b | —b | —b | —b | 20 | 26 | 26 |
| Teaching | —b | —b | —b | —b | 27 | 45 | 65 |
| a Other payers are not shown. b Population denominator data were unavailable to calculate rate. The ratio is calculated from the number of reconstructions and mastectomies. Source: Agency for Healthcare Research and Quality (AHRQ), Center for Delivery, Organization, and Markets, Healthcare Cost and Utilization Project (HCUP), State Inpatient Databases (SID) and State Ambulatory Surgery and Services Databases (SASD) from 22 States, 2009 and 2014. | |||||||
|
|
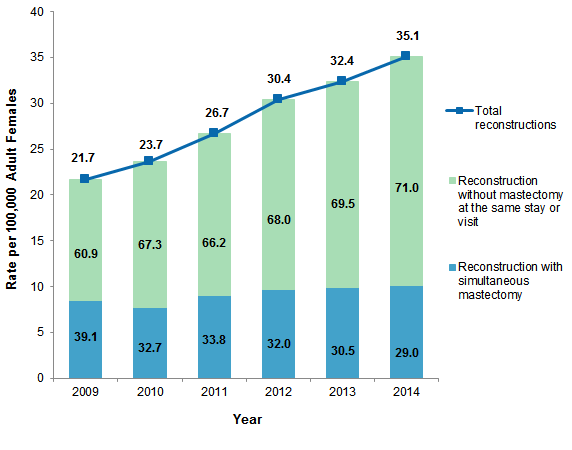
Figure 2. Rate of reconstructive surgery for mastectomy and the percentage performed at the same stay or visit as the mastectomy, 2009-2014
Source: Agency for Healthcare Research and Quality (AHRQ), Center for Delivery, Organization, and Markets, Healthcare Cost and Utilization Project (HCUP), State Inpatient Databases (SID) and State Ambulatory Surgery and Services Databases (SASD) from 22 States, 2009-2014 Bar chart showing rate of reconstructive surgery for mastectomy per 100,000 adult females and percentage performed at same stay or visit as mastectomy, 2009-2014. 2009: rate of reconstructions, 21.7; % reconstructions without mastectomy at same stay or visit, 60.9; % reconstructions with simultaneous mastectomy, 39.1. 2010: rate of reconstructions, 23.7; % reconstructions without mastectomy at same stay or visit, 67.3; % reconstructions with simultaneous mastectomy, 32.7. 2011: rate of reconstructions, 26.7; % reconstructions without mastectomy at same stay or visit, 66.2; % reconstructions with simultaneous mastectomy, 33.8. 2012: rate of reconstructions, 30.4; % reconstructions without mastectomy at same stay or visit, 68.0; % reconstructions with simultaneous mastectomy, 32.0. 2013: rate of reconstructions, 32.4; % reconstructions without mastectomy at same stay or visit, 69.5; % reconstructions with simultaneous mastectomy, 30.5. 2014: rate of reconstructions, 35.1; % reconstructions without mastectomy at same stay or visit, 71.0; % reconstructions with simultaneous mastectomy, 29.0.
|
|
|
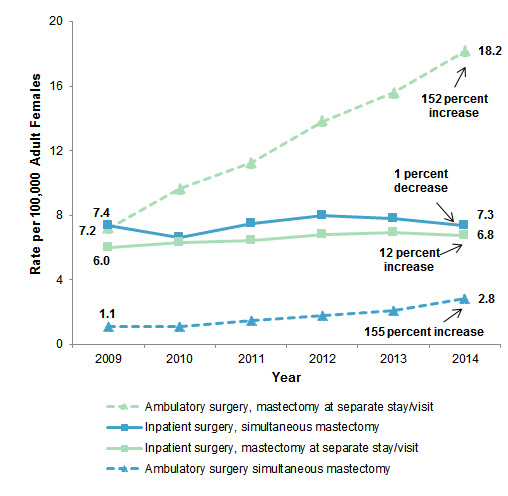
Figure 3. Population rate of reconstructive surgery for mastectomy, by surgical setting and whether the reconstruction was performed at the same stay or visit as the mastectomy, 2009-2014
Source: Agency for Healthcare Research and Quality (AHRQ), Center for Delivery, Organization, and Markets, Healthcare Cost and Utilization Project (HCUP), State Inpatient Databases (SID) and State Ambulatory Surgery and Services Databases (SASD) from 22 States, 2009-2014 Line graph showing population rate of reconstructive surgery for mastectomy per 100,000 adult females by surgical setting and whether reconstruction was performed at same stay or visit as mastectomy, 2009-2014. Rate of reconstruction with mastectomy at separate stay or visit, ambulatory surgery: rose steadily from 7.2 in 2009 to 18.2 in 2014; 152% increase. Rate of reconstruction with simultaneous mastectomy, inpatient surgery: 7.4 in 2009, 6.6 in 2010, 7.5 in 2011, 8.0 in 2012, 7.8 in 2013, 7.3 in 2014; 1% decrease. Rate of reconstruction with mastectomy at separate stay or visit, inpatient surgery: increased steadily from 6.0 in 2009 to 6.9 in 2013, decreased to 6.8 in 2014; 12% increase. Rate of reconstruction with simultaneous mastectomy, ambulatory surgery: increased steadily from 1.1 in 2009 to 2.8 in 2014; 155% increase.
|
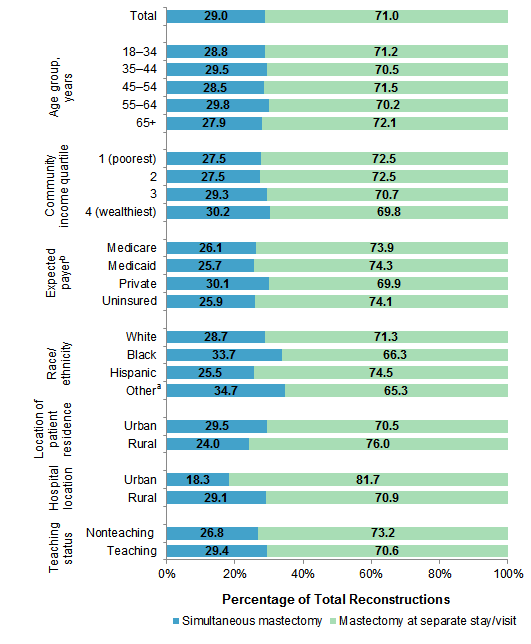
Figure 4 displays patient and hospital characteristics for reconstructive surgeries (simultaneous and subsequent) across all settings in 2014. |
|
Figure 4. Percentage of reconstructions performed at the same or a different encounter as the mastectomy, by patient and hospital characteristics, 2014
a Other races/ethnicities include non-Hispanic Asian/Pacific Islanders, Native Americans/Alaska Natives, and other races/ethnicities. Bar chart showing percentage of reconstructions for mastectomy performed at separate or different encounter as mastectomy by patient and hospital characteristics in 2014. Total: reconstruction with simultaneous mastectomy: 29.0%; reconstruction with mastectomy at separate stay or visit: 71.0%. Age group: 18-34 years: with simultaneous mastectomy, 28.8%; with mastectomy at separate stay or visit, 71.2%. 35-44 years: with simultaneous mastectomy; 29.5%; with mastectomy at separate stay or visit, 70.5%. 45-54 years: with simultaneous mastectomy, 28.5%; with mastectomy at separate stay or visit, 71.5%. 55-64 years: with simultaneous mastectomy, 29.8%; with mastectomy at separate stay or visit, 70.2%. 65+ years: with simultaneous mastectomy, 27.9%; with mastectomy at separate stay or visit, 72.1%. Community income quartile: 1 (poorest): with simultaneous mastectomy, 27.5%; with mastectomy at separate stay or visit, 72.5%. 2: with simultaneous mastectomy, 27.5%; with mastectomy at separate stay or visit, 72.5%. 3: with simultaneous mastectomy, 29.3%; with mastectomy at separate stay or visit, 70.7%. 4 (wealthiest): with simultaneous mastectomy, 30.2%; with mastectomy at separate stay or visit, 69.8%. Expected payer: Medicare: with simultaneous mastectomy, 26.1%; with mastectomy at separate stay or visit, 73.9%. Medicaid: with simultaneous mastectomy, 25.7%; with mastectomy at separate stay or visit, 74.3%. Private: with simultaneous mastectomy, 30.1%; with mastectomy at separate stay or visit, 69.9%. Uninsured: with simultaneous mastectomy, 25.9%; with mastectomy at separate stay or visit, 74.1%. Race/ethnicity: White: with simultaneous mastectomy, 28.7%; with mastectomy at separate stay or visit, 71.3%. Black: with simultaneous mastectomy, 33.7%; with mastectomy at separate stay or visit, 66.3%. Hispanic: with simultaneous mastectomy, 25.5%; with mastectomy at separate stay or visit, 74.5%. Other: with simultaneous mastectomy, 34.7%; with mastectomy at separate stay or visit, 65.3%. Location of patient residence: Urban: with simultaneous mastectomy, 29.5%; with mastectomy at separate stay or visit, 70.5%. Rural: with simultaneous mastectomy, 24.0%; with mastectomy at separate stay or visit, 76.0%. Hospital location: Urban: with simultaneous mastectomy, 18.3%; with mastectomy at separate stay or visit, 81.7%. Rural: with simultaneous mastectomy, 29.1%; with mastectomy at separate stay or visit, 70.9%. Teaching status: nonteaching: with simultaneous mastectomy, 26.8%; with mastectomy at separate stay or visit, 73.2%. Teaching: with simultaneous mastectomy, 29.4%; with mastectomy at separate stay or visit, 70.6%.
|
|
|
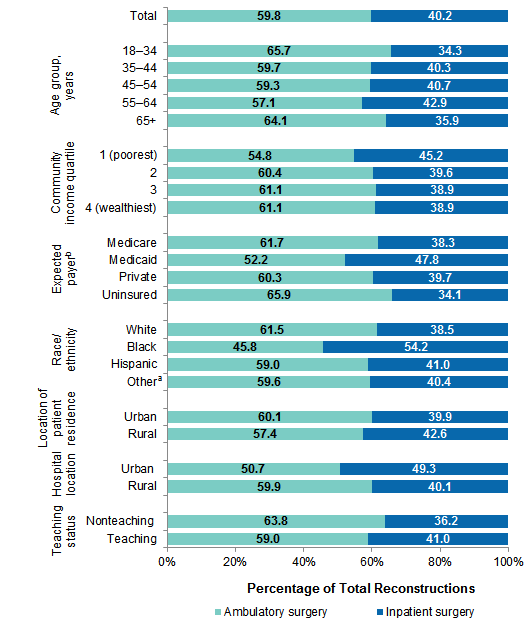
Figure 5. Percentage of reconstructions performed as ambulatory or inpatient surgeries, by patient and hospital characteristics, 2014
a Other races/ethnicities include non-Hispanic Asian/Pacific Islanders, Native Americans/Alaska Natives, and other races/ethnicities. Bar chart showing percentage of reconstructions for mastectomy performed as inpatient or ambulatory surgeries, by patient and hospital characteristics, 2014. Total: ambulatory surgery: 59.8%; inpatient surgery: 40.2%. Age group: 18-34 years: ambulatory surgery, 65.7%; inpatient surgery, 34.3%. 35-44 years: ambulatory surgery; 59.7%; inpatient surgery, 40.3%. 45-54 years: ambulatory surgery, 59.3%; inpatient surgery, 40.7%. 55-64 years: ambulatory surgery, 57.1%; inpatient surgery, 42.9%. 65+ years: ambulatory surgery, 64.1%; inpatient surgery, 35.9%. Community income quartile: 1 (poorest): ambulatory surgery, 54.8%; inpatient surgery, 45.2%. 2: ambulatory surgery, 60.4%; inpatient surgery, 39.6%. 3: ambulatory surgery, 61.1%; inpatient surgery, 38.9%. 4 (wealthiest): ambulatory surgery, 61.1%; inpatient surgery, 38.9%. Expected payer: Medicare: ambulatory surgery, 61.7%; inpatient surgery, 38.3%. Medicaid: ambulatory surgery, 52.2%; inpatient surgery, 47.8%. Private: ambulatory surgery, 60.3%; inpatient surgery, 39.7%. Uninsured: ambulatory surgery, 65.9%; inpatient surgery, 34.1%. Race/ethnicity: White: ambulatory surgery, 61.5%; inpatient surgery, 38.5%. Black: ambulatory surgery, 45.8%; inpatient surgery, 54.2%. Hispanic: ambulatory surgery, 59.0%; inpatient surgery, 41.0%. Other: ambulatory surgery, 59.6%; inpatient surgery, 40.4%. Location of patient residence: Urban: ambulatory surgery, 60.1%; inpatient surgery, 39.9%. Rural: ambulatory surgery, 57.4%; inpatient surgery, 42.6%. Hospital location: Urban: ambulatory surgery, 50.7%; inpatient surgery, 49.3%. Rural: ambulatory surgery, 59.9%; inpatient surgery, 40.1%. Teaching status: nonteaching: ambulatory surgery, 63.8%; inpatient surgery, 36.2%. Teaching: ambulatory surgery, 59.0%; inpatient surgery, 41.0%.
|
HCUP Statistical Briefs provide basic descriptive statistics on a variety of topics using HCUP administrative healthcare data. Topics include hospital inpatient, ambulatory surgery, and emergency department use and costs, quality of care, access to care, medical conditions, procedures, and patient populations, among other topics. The reports are intended to generate hypotheses that can be further explored in other research; the reports are not designed to answer in-depth research questions using multivariate methods. Data Source The volumes and rates in this Statistical Brief are based upon data from the Healthcare Cost and Utilization Project (HCUP) 2009-2014 State Inpatient Databases (SID) and State Ambulatory Surgery and Services Databases (SASD). This report evaluates inpatient and outpatient procedure data from 22 States that contributed to the 2009-2014 SID and SASD: California, Colorado, Connecticut, Florida, Georgia, Iowa, Indiana, Maryland, Michigan, Minnesota, Missouri, Nebraska, New Jersey, New York, North Carolina, Ohio, South Carolina, South Dakota, Tennessee, Utah, Vermont, and Wisconsin. Analysis was limited to hospitals within the 22 States that had cases in the inpatient and ambulatory surgery settings in each data year and for which reconstructions and mastectomies could be identified by International Classification of Diseases, Ninth Revision, Clinical Modification (ICD-9-CM) procedure codes; by Current Procedural Terminology (CPT®) procedure codes; or by both. Supplemental sources included population denominator data for use with HCUP databases, derived from information available from Claritas.8 Definitions Diagnoses, procedures, ICD-9-CM, and Current Procedural Terminology (CPT®) The principal diagnosis is that condition established after study to be chiefly responsible for the patient's admission to the hospital. Secondary diagnoses are concomitant conditions that coexist at the time of admission or develop during the stay. All-listed diagnoses include the principal diagnosis plus these additional secondary conditions. All-listed procedures include all procedures performed during the hospital stay, whether for definitive treatment or for diagnostic or exploratory purposes. ICD-9-CM is the International Classification of Diseases, Ninth Revision, Clinical Modification, which assigns numeric codes to diagnoses and procedures. There are approximately 14,000 ICD-9-CM diagnosis codes. There are approximately 4,000 ICD-9-CM procedure codes. CPT assigns numeric codes to procedures. There are approximately 9,600 CPT procedure codes. Procedures on inpatient hospitalization records are coded using the ICD-9-CM; procedures on ambulatory surgery and services records can be coded using either the ICD-9-CM or the CPT. Case definition The ICD-9-CM and CPT procedure codes defining mastectomies are shown in Table 2. |
| Table 2. ICD-9-CM and CPT procedure codes defining mastectomies | |
| Code | Description |
|---|---|
| ICD-9-CM procedure codes | |
| 8535 | Bilateral subcutaneous mammectomy with synchronous implant |
| 8536 | Other bilateral subcutaneous mammectomy |
| 8542 | Bilateral simple mastectomy |
| 8544 | Bilateral extended simple mastectomy |
| 8546 | Bilateral radical mastectomy |
| 8548 | Bilateral extended radical mastectomy |
| 8533 | Unilateral subcutaneous mammectomy with synchronous implant |
| 8534 | Other unilateral subcutaneous mammectomy |
| 8541 | Unilateral simple mastectomy |
| 8543 | Unilateral extended simple mastectomy |
| 8545 | Unilateral radical mastectomy |
| 8547 | Unilateral extended radical mastectomy |
| CPT procedure codes | |
| 19303 | Mastectomy, simple complete |
| 19304 | Mastectomy, subcutaneous |
| 19305 | Mastectomy, radical |
| 19306 | Mastectomy, radical, urban type |
| 19307 | Mastectomy, modified radical |
| Abbreviations: CPT, Current Procedural Terminology; ICD-9-CM, International Classification of Diseases, Ninth Revision, Clinical Modification | |
The codes used to define reconstructive surgeries for mastectomy are shown in Table 3. We did not verify that reconstruction occurred after mastectomy by linking records across patients. However, we can assume that all women included did have a mastectomy because we included codes for total breast reconstruction. These procedures would be done following a mastectomy but not following a lumpectomy or for cosmetic reasons unrelated to cancer, which would entail only a partial reconstruction. We also included select codes for partial reconstructions that were unique to ambulatory surgery records, if a code for total breast reconstruction was not present but a diagnosis of V510, Encounter for breast reconstruction following mastectomy, was present in any position.
|
| Table 3. ICD-9-CM and CPT procedure codes defining reconstructions for mastectomies | |
| Code | Description |
|---|---|
| ICD-9-CM procedure codes | |
| 8570 | Total reconstruction of breast, not otherwise specified |
| 8571 | Latissimus dorsi myocutaneous flap |
| 8572 | Transverse rectus abdominis myocutaneous (TRAM) flap, pedicled |
| 8573 | Transverse rectus abdominis myocutaneous (TRAM) flap, free |
| 8574 | Deep inferior epigastric artery perforator (DIEP) flap, free |
| 8575 | Superficial inferior epigastric artery (SIEA) flap, free |
| 8576 | Gluteal artery perforator (GAP) flap, free |
| 8579 | Other total reconstruction of breast |
| CPT procedure codes, if a mastectomy code in Table 2 was found on the record | |
| 19361 | Breast reconstruction with latissimus dorsi flap, without prosthetic implant |
| 19364 | Breast reconstruction with free flap |
| 19366 | Breast reconstruction with other technique |
| 19367 | Breast reconstruction with TRAM, single pedicle, including closure of donor site |
| 19368 | Breast reconstruction with TRAM, single pedicle, including closure of donor site; with microvascular anastomosis (supercharging) |
| 19369 | Breast reconstruction with TRAM, double pedicle, including closure of donor site |
| 19340 | Immediate insertion of breast prosthesis following mastopexy, mastectomy or in reconstruction |
| CPT procedure codes, if a mastectomy code in Table 2 was NOT found on the record | |
| 19361 | Breast reconstruction with latissimus dorsi flap, without prosthetic implant |
| 19364 | Breast reconstruction with free flap |
| 19366 | Breast reconstruction with other technique |
| 19367 | Breast reconstruction with TRAM, single pedicle, including closure of donor site |
| 19368 | Breast reconstruction with TRAM, single pedicle, including closure of donor site; with microvascular anastomosis (supercharging) |
| 19369 | Breast reconstruction with TRAM, double pedicle, including closure of donor site |
| 11970a | Replacement of tissue expander with permanent prosthesis |
| 19340a | Immediate insertion of breast prosthesis following mastopexy, mastectomy or in reconstruction |
| 19342a | Delayed insertion of breast prosthesis following mastopexy, mastectomy or in reconstruction |
| Abbreviation: CPT, Current Procedural Terminology; ICD-9-CM, International Classification of Diseases, Ninth Revision, Clinical Modification a If any of these three CPT codes were found on the record (without a CPT in the range 1936n), then the record was only counted as having reconstruction for mastectomy if there was also a diagnosis of V510, Encounter for breast reconstruction following mastectomy, in any position. | |
Types of hospitals included in HCUP State Inpatient Databases This analysis used State Inpatient Databases (SID) limited to data from community hospitals, which are defined as short-term, non-Federal, general, and other hospitals, excluding hospital units of other institutions (e.g., prisons). Community hospitals include obstetrics and gynecology, otolaryngology, orthopedic, cancer, pediatric, public, and academic medical hospitals. Excluded for this analysis are long-term care facilities such as rehabilitation, psychiatric, and alcoholism and chemical dependency hospitals. However, if a patient received long-term care, rehabilitation, or treatment for a psychiatric or chemical dependency condition in a community hospital, the discharge record for that stay was included in the analysis. Types of hospitals included in HCUP State Ambulatory Surgery and Services Databases This analysis used State Ambulatory Surgery and Services Databases (SASD) limited to data from hospital-owned ambulatory surgery facilities. Although some SASD include data from facilities not owned by a hospital, those facilities were excluded from this analysis. The designation of a facility as hospital-owned is specific to its financial relationship with a hospital that provides inpatient care and is not related to its physical location. Ambulatory surgery performed in hospital-owned facilities may be performed within the hospital, in a facility attached to the hospital, or in a facility physically separated from the hospital. The analysis was further limited to ambulatory surgeries performed at facilities owned by community hospitals. Community hospitals are defined as short-term, non-Federal, general, and other specialty hospitals, excluding hospital units of other institutions (e.g., prisons). The analysis was limited to hospitals that had at least one mastectomy procedure performed in both the SID and the SASD in each data year. Unit of analysis The unit of analysis is the hospital discharge (i.e., the hospital stay or ambulatory surgery visit), not a person or patient. This means that a person who is admitted to or visits the hospital multiple times in 1 year will be counted each time as a separate discharge or visit from the hospital. Location of patients' residence Place of residence is based on the Urban Influence Codes (UIC) urban-rural classification scheme for U.S. counties developed by the U.S. Department of Agriculture's Economic Research Service, as a refinement of the Office of Management and Budget Metropolitan Service Area definition. For this Statistical Brief, we collapsed the UIC categories into either urban or rural according to the following: Urban:
Community-level income is based on the median household income of the patient's ZIP Code of residence. Quartiles are defined so that the total U.S. population is evenly distributed. Cut-offs for the quartiles are determined annually using ZIP Code demographic data obtained from Claritas, a vendor that adds value to data from the U.S. Census Bureau.9 The value ranges for the income quartiles vary by year. The income quartile is missing for patients who are homeless or foreign. Payer Payer is the expected payer for the hospital stay. To make coding uniform across all HCUP data sources, payer combines detailed categories into general groups:
For this Statistical Brief, when more than one payer is listed for a hospital discharge, the first-listed payer is used. Reporting of race and ethnicity Data on Hispanic ethnicity are collected differently among the States and also can differ from the Census methodology of collecting information on race (White, Black, Asian/Pacific Islander, American Indian/Alaska Native, Other (including mixed race)) separately from ethnicity (Hispanic, non-Hispanic). State data organizations often collect Hispanic ethnicity as one of several categories that include race. Therefore, for multistate analyses, HCUP creates the combined categorization of race and ethnicity for data from States that report ethnicity separately. When a State data organization collects Hispanic ethnicity separately from race, HCUP uses Hispanic ethnicity to override any other race category to create a Hispanic category for the uniformly coded race/ethnicity data element, while also retaining the original race and ethnicity data. This Statistical Brief reports race/ethnicity for the following categories: Hispanic, non-Hispanic White, non-Hispanic Black, and non-Hispanic Other, including Asian/Pacific Islander, American Indian/Alaska Native, and Other. Trends were not reported because a higher percentage of records for reconstructive surgeries had missing data on race/ethnicity in 2009 (15.2 percent) than in 2014 (7.4 percent). In 2014, two States (Minnesota and Nebraska) did not provide data on race/ethnicity. Reporting of hospital location Hospital location is based on the Core Based Statistical Area (CBSA) urban-rural classification scheme for U.S. counties developed by the Office of Management and Budget. Hospitals residing in counties with a CBSA type of metropolitan were considered urban, whereas hospitals with a CBSA type of micropolitan or noncore were classified as rural. Reporting of hospital teaching status The hospital's teaching status was obtained from information included in the American Hospital Association Annual Survey of Hospitals. A hospital is considered to be a teaching hospital if it has an approved American Medical Association residency program, is a member of the Council of Teaching Hospitals, or has a ratio of full-time equivalent interns and residents to beds of .25 or higher. About HCUP The Healthcare Cost and Utilization Project (HCUP, pronounced "H-Cup") is a family of healthcare databases and related software tools and products developed through a Federal-State-Industry partnership and sponsored by the Agency for Healthcare Research and Quality (AHRQ). HCUP databases bring together the data collection efforts of State data organizations, hospital associations, and private data organizations (HCUP Partners) and the Federal government to create a national information resource of encounter-level healthcare data. HCUP includes the largest collection of longitudinal hospital care data in the United States, with all-payer, encounter-level information beginning in 1988. These databases enable research on a broad range of health policy issues, including cost and quality of health services, medical practice patterns, access to healthcare programs, and outcomes of treatments at the national, State, and local market levels. HCUP would not be possible without the contributions of the following data collection Partners from across the United States: Alaska Department of Health and Social Services Alaska State Hospital and Nursing Home Association Arizona Department of Health Services Arkansas Department of Health California Office of Statewide Health Planning and Development Colorado Hospital Association Connecticut Hospital Association District of Columbia Hospital Association Florida Agency for Health Care Administration Georgia Hospital Association Hawaii Health Information Corporation Illinois Department of Public Health Indiana Hospital Association Iowa Hospital Association Kansas Hospital Association Kentucky Cabinet for Health and Family Services Louisiana Department of Health Maine Health Data Organization Maryland Health Services Cost Review Commission Massachusetts Center for Health Information and Analysis Michigan Health & Hospital Association Minnesota Hospital Association Mississippi State Department of Health Missouri Hospital Industry Data Institute Montana Hospital Association Nebraska Hospital Association Nevada Department of Health and Human Services New Hampshire Department of Health & Human Services New Jersey Department of Health New Mexico Department of Health New York State Department of Health North Carolina Department of Health and Human Services North Dakota (data provided by the Minnesota Hospital Association) Ohio Hospital Association Oklahoma State Department of Health Oregon Association of Hospitals and Health Systems Oregon Office of Health Analytics Pennsylvania Health Care Cost Containment Council Rhode Island Department of Health South Carolina Revenue and Fiscal Affairs Office South Dakota Association of Healthcare Organizations Tennessee Hospital Association Texas Department of State Health Services Utah Department of Health Vermont Association of Hospitals and Health Systems Virginia Health Information Washington State Department of Health West Virginia Department of Health and Human Resources, West Virginia Health Care Wisconsin Department of Health Services Wyoming Hospital Association About the SID The HCUP State Inpatient Databases (SID) are hospital inpatient databases from data organizations participating in HCUP. The SID contain the universe of the inpatient discharge abstracts in the participating HCUP States, translated into a uniform format to facilitate multistate comparisons and analyses. Together, the SID encompass more than 95 percent of all U.S. community hospital discharges. The SID can be used to investigate questions unique to one State, to compare data from two or more States, to conduct market-area variation analyses, and to identify State-specific trends in inpatient care utilization, access, charges, and outcomes. About the SASD The HCUP State Ambulatory Surgery and Services Databases (SASD) include encounter-level data for ambulatory surgeries and may also include various types of outpatient services such as observation stays, lithotripsy, radiation therapy, imaging, chemotherapy, and labor and delivery. The specific types of ambulatory surgery and outpatient services included in each SASD vary by State and data year. All SASD include data from hospital-owned ambulatory surgery facilities. In addition, some States include data from facilities not owned by a hospital. The designation of a facility as hospital-owned is specific to its financial relationship with a hospital that provides inpatient care and is not related to its physical location. Hospital-owned ambulatory surgery and other outpatient care facilities may be contained within the hospital, physically attached to the hospital, or located in a different geographic area. In order to provide information that is comparable across all States, analysis was restricted to hospital-owned ambulatory surgery. For More Information For other information on mastectomies, including reconstructive surgeries following mastectomy, refer to the HCUP Statistical Briefs located at www.hcup-us.ahrq.gov/reports/statbriefs/sb_womens.jsp. For additional HCUP statistics, visit:
For a detailed description of HCUP and more information on the design of the State Inpatient Databases (SID) and the State Ambulatory Surgery and Services Databases (SASD), please refer to the following database documentation: Agency for Healthcare Research and Quality. Overview of the State Inpatient Databases (SID). Healthcare Cost and Utilization Project (HCUP). Rockville, MD: Agency for Healthcare Research and Quality. Updated June 2016. www.hcup-us.ahrq.gov/sidoverview.jsp. Accessed January 31, 2017. Agency for Healthcare Research and Quality. Overview of the State Ambulatory Surgery and Services Databases (SASD). Healthcare Cost and Utilization Project (HCUP). Rockville, MD: Agency for Healthcare Research and Quality. Updated June 2016. www.hcup-us.ahrq.gov/sasdoverview.jsp. Accessed January 31, 2017. Suggested Citation Miller AM (Rocky Vista University College of Osteopathic Medicine), Steiner CA (Institute for Health Research, Kaiser Permanente), Barrett ML (M.L. Barrett, Inc.), Fingar KR (IBM Watson Health), Elixhauser A (AHRQ). Breast Reconstruction Surgery for Mastectomy in Hospital Inpatient and Ambulatory Settings, 2009-2014. HCUP Statistical Brief #228. October 2017. Agency for Healthcare Research and Quality, Rockville, MD. www.hcup-us.ahrq.gov/reports/statbriefs/sb228-Breast-Reconstruction-For-Mastectomy.pdf. Acknowledgments The authors would like to acknowledge the contributions of Minya Sheng of IBM Watson Health. *** AHRQ welcomes questions and comments from readers of this publication who are interested in obtaining more information about access, cost, use, financing, and quality of healthcare in the United States. We also invite you to tell us how you are using this Statistical Brief and other HCUP data and tools, and to share suggestions on how HCUP products might be enhanced to further meet your needs. Please e-mail us at hcup@ahrq.gov or send a letter to the address below:Sharon B. Arnold, Ph.D., Acting Director Center for Delivery, Organization, and Markets Agency for Healthcare Research and Quality 5600 Fishers Lane Rockville, MD 20857 This Statistical Brief was posted online on October 10, 2017. 1 Weiss MC. Choosing Between Reconstruction and "Going Flat" After Breast Cancer. US News and World Report. December 13, 2016. http://health.usnews.com/health-care/for-better/articles/2016-12-13/choosing-between-reconstruction-and-going-flat-after-breast-cancer. 2 Lucas DJ, Sabino J, Shriver CD, Pawlik TM, Singh DP, Vertrees AE. Doing more: trends in breast cancer surgery, 2005 to 2011. American Surgeon. 2015;81(1):74-80. 3 Jagsi R, Jiang J, Momoh AO, Alderman A, Giordano SH, Buchholz TA, et al. Trends and variation in use of breast reconstruction in patients with breast cancer undergoing mastectomy in the United States. Journal of Clinical Oncology. 2014;32(9):919-26. 4 Wexelman B, Schwartz JA, Lee D, Estabrook A, Thu Ma AM. Socioeconomic and geographic differences in immediate reconstruction after mastectomy in the United States. 2014;20(4):339-46. 5 Lucas DJ et al., 2015. Op. cit. 6 Jagsi R et al., 2014. Op. cit. 7 Wexelman B et al., 2014. Op. cit. 8 Claritas. Claritas Demographic Profile. www.claritas.com. 9 Claritas. Claritas Demographic Profile. www.claritas.com. |