STATISTICAL BRIEF #224 |
June 2017
Audrey J. Weiss, Ph.D., Molly K. Bailey, Lauren O'Malley, Marguerite L. Barrett, M.S., Anne Elixhauser, Ph.D., and Claudia A. Steiner, M.D., M.P.H. Introduction Between 2005 and 2014 there was a dramatic increase nationally in hospitalizations involving opioids: the rate of opioid-related inpatient stays increased 64 percent, and the rate of opioid-related emergency department (ED) visits nearly doubled.1 In a series of Statistical Briefs, the Agency for Healthcare Research and Quality (AHRQ) is providing descriptive information on opioid-related hospitalizations nationally and at the State level, based on data from the Healthcare Cost and Utilization Project (HCUP) Fast Stats online tool.2 In a previous Statistical Brief, AHRQ reported that across States in 2014 the rate of opioid-related inpatient stays varied more than five-fold and the rate of opioid-related ED visits varied more than ten-fold.3 Rates were reported for each State at the overall State level. This HCUP Statistical Brief extends the previous report by presenting data from HCUP Fast Stats on the rate of opioid-related hospital inpatient stays and ED visits by patient sex and age group from 2005 to 2014. The patient sex and age groups with the highest opioid-related inpatient stay rates are presented for each of 44 States and the District of Columbia that provided inpatient data in 2014. Similarly, the patient sex and age groups with the highest opioid-related ED visit rates are presented for each of 30 States that provided ED visit data in 2014. Finally, States are ranked overall on the rates of opioid-related inpatient stays and ED visits by patient sex and age group in 2014. Identification of opioid-related stays and visits is based on all-listed diagnoses and includes events associated with prescription opioids or illicit opioids such as heroin. The population denominator specific to each sex or age group was used to calculate rates. Findings National rate of opioid-related inpatient stays and ED visits by patient sex, 2005-2014 Figure 1 presents the 10-year trends in the national rate of opioid-related inpatient stays and ED visits by patient sex, from 2005 to 2014. |
|
|
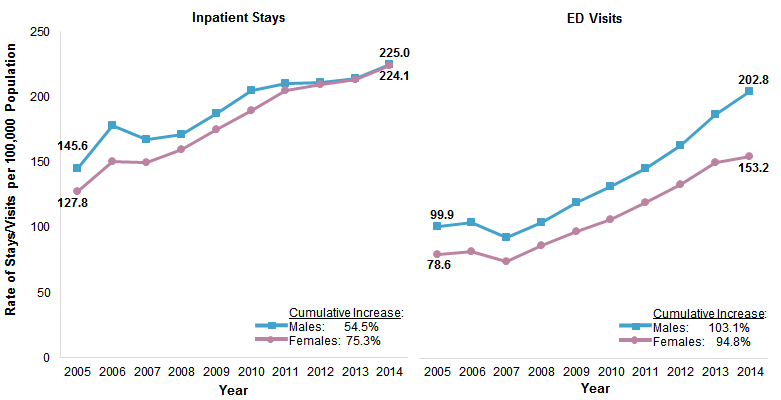
Figure 1. National rate of opioid-related inpatient stays and ED visits by patient sex, 2005-2014
Abbreviation: ED, emergency department Two line graphs that show the national rate of opioid-related inpatient stays and ED visits per 100,000 population from 2005 to 2014 by patient sex. Inpatient stays: male: Increased from 145.6 in 2005 to 178.2 in 2006, decreased to 167.5 in 2007, and then increased steadily to 225.0 in 2014; cumulative increase, 54.5%. Female: Increased from 127.8 in 2005 to 150.5 in 2006, decreased to 150.2 in 2007, and then increased steadily to 224.1 in 2014; cumulative increase, 75.3%. ED visits: male: Increased from 99.9 in 2005 to 102.9 in 2006, decreased to 91.9 in 2007, and then increased steadily to 202.8 in 2014; cumulative increase, 103.1%. Female: Increased from 78.6 in 2005 to 81.0 in 2006, decreased to 73.6 in 2007, and then increased steadily to 153.2 in 2014; cumulative increase, 94.8%. |
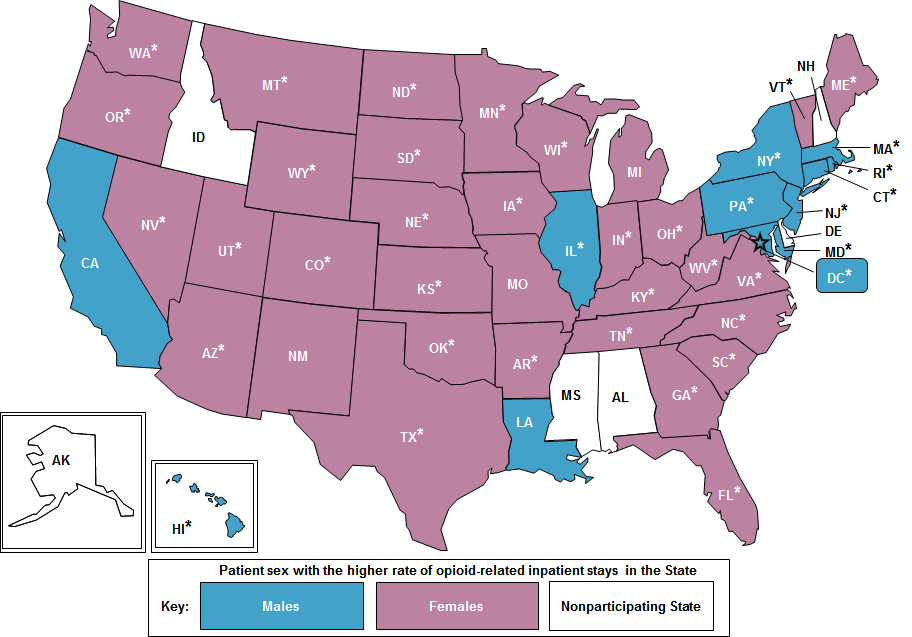
Figures 2 and 3 identify the patient sex with the higher rate of opioid-related inpatient stays (Figure 2) and ED visits (Figure 3) in each State in 2014. The sex with the higher rate overall is reported for each State. States where the difference between the male and female rates was 10 percent or greater are noted with an asterisk. Figure 2 reports the patient sex with the higher population rate of opioid-related inpatient stays for each of 44 States and the District of Columbia that provided inpatient data in 2014. Details on the sex-specific inpatient rates are shown in Appendix A. |
|
Figure 2. Patient sex with the higher ratea of opioid-related inpatient stays, by State, 2014
Note: Asterisks denote States where the difference between the higher and lower of the male and female rates was at least 10 percent. U.S. map that depicts for participating States which sex had the higher rate of opioid-related inpatient stays in 2014. Higher male rate of opioid-related inpatient stays: California, Louisiana, Illinois, New York, Massachusetts, Rhode Island, Connecticut, Pennsylvania, New Jersey, Maryland, District of Columbia, Hawaii. Higher female rate of opioid-related inpatient stays: Washington, Oregon, Nevada, Utah, Arizona, New Mexico, Colorado, Wyoming, Montana, North Dakota, South Dakota, Nebraska, Kansas, Oklahoma, Texas, Arkansas, Missouri, Iowa, Minnesota, Wisconsin, Michigan, Indiana, Ohio, Kentucky, Tennessee, West Virginia, Virginia, North Carolina, South Carolina, Georgia, Florida, Vermont, Maine. |
|
|
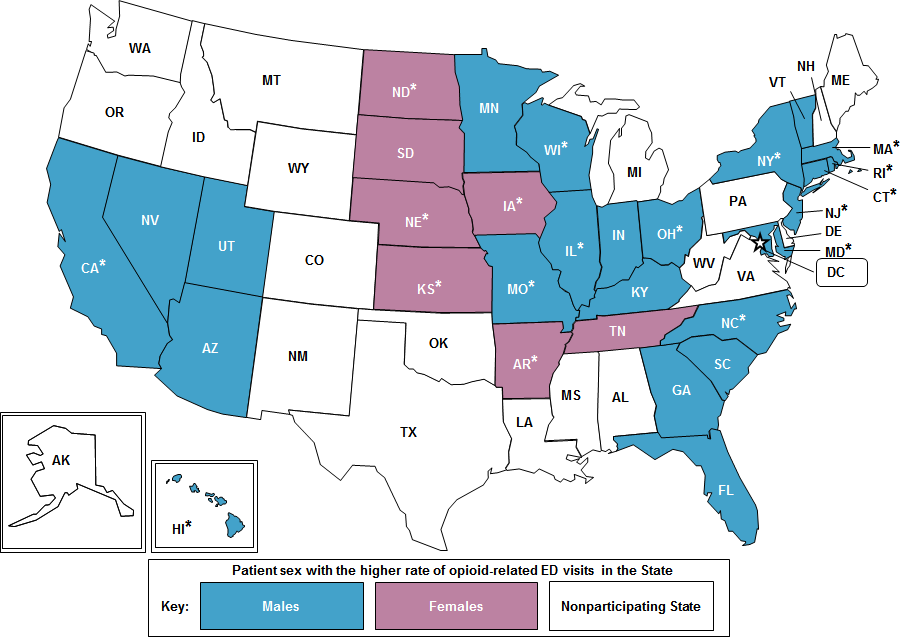
Figure 3. Patient sex with the higher ratea of opioid-related ED visits, by State, 2014
Abbreviation: ED, emergency department U.S. map that depicts for participating States which sex had the higher rate of opioid-related ED visits in 2014. Higher male rate of opioid-related ED visits: California, Nevada, Utah, Arizona, Minnesota, Missouri, Wisconsin, Illinois, Indiana, Kentucky, Ohio, Florida, Georgia, South Carolina, North Carolina, Maryland, New Jersey, New York, Connecticut, Rhode Island, Massachusetts, Vermont, Hawaii. Higher female rate of opioid-related ED visits: North Dakota, South Dakota, Nebraska, Kansas, Iowa, Arkansas, Tennessee.
|
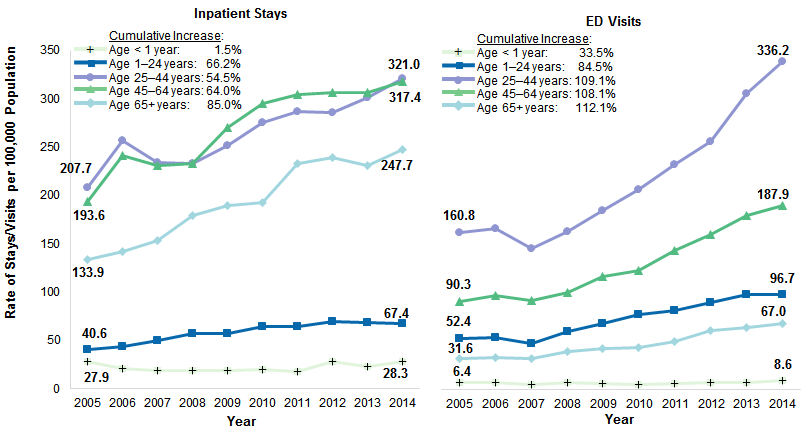
National rate of opioid-related inpatient stays and ED visits by patient age, 2005-2014 Figure 4 presents the 10-year trends in the national rate of opioid-related inpatient stays and ED visits by patient age group, from 2005-2014. |
|
Figure 4. National rate of opioid-related inpatient stays and ED visits by patient age, 2005-2014
Abbreviation: ED, emergency department Two line graphs that show the national rate of opioid-related inpatient stays and ED visits per 100,000 population from 2005 to 2014 by patient age. Inpatient stays: <1 year: 2005, 27.9; 2006, 20.5; 2007, 19.0; 2008, 18.6; 2009, 19.1; 2010, 19.2; 2011, 17.5; 2012, 27.9; 2013, 22.6; 2014, 28.3; cumulative increase, 1.5%. 1-24 years: Increased from 40.6 in 2005 to 57.5 in 2008, decreased to 57.4 in 2009, increased to 69.0 in 2012, and decreased to 67.4 in 2014; cumulative increase, 66.2%. 25-44 years: Increased from 207.7 in 2005 to 256.4 in 2006, decreased to 233.3 in 2008, increased to 286.9 in 2011, decreased to 285.6 in 2012, and increased to 321.0 in 2014; cumulative increase, 54.5%. 45-64 years: increased from 193.6 in 2005 to 241.5 in 2006, decreased to 230.6 in 2007, increased to 306.5 in 2012, decreased to 306.2 in 2013, and increased to 317.4 in 2014; cumulative increase, 64.0%. 65+ years: Increased steadily from 133.9 in 2005 to 238.7 in 2012, decreased to 230.7 in 2013, and then increased to 247.7 in 2014; cumulative increase, 85.0%. ED visits: < 1 year: 2005, 6.4; 2006, 7.1; 2007, 5.1; 2008, 7.0; 2009, 5.9; 2010, 5.3; 2011, 5.5; 2012, 7.1; 2013, 6.5; 2014, 8.6; cumulative increase, 33.5%. 1-24 years: Increased from 52.4 in 2005 to 53.4 in 2006, decreased to 46.9 in 2007, steadily increased to 96.9 in 2013, and then decreased to 96.7 in 2014; cumulative increase, 84.5%. 25-44 years: Increased from 160.8 in 2005 to 164.8 in 2006, decreased to 144.5 in 2007, increased steadily to 336.2 in 2014; cumulative increase, 109.1%. 45-64 years: Increased from 90.3 in 2005 to 95.7 in 2006, decreased to 91.2 in 2007, and then increased steadily to 187.9 in 2014; cumulative increase, 108.1%. 65+ years: Increased from 31.6 in 2005 to 33.0 in 2006, decreased to 31.6 in 2007, and then steadily increased to 67.0 in 2014; cumulative increase, 112.1%. |
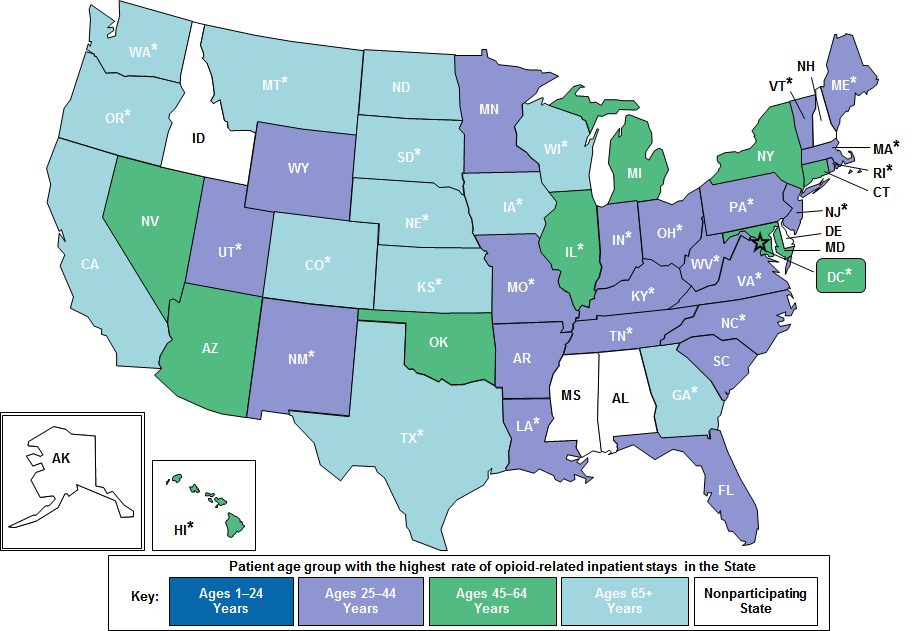
Patient age group with the highest rate of opioid-related inpatient stays and ED visits, by State, 2014 Figures 5 and 6 identify the patient age group with the highest rate of opioid-related inpatient stays (Figure 5) and ED visits (Figure 6) in each State in 2014. The age group with the highest rate overall is reported for each State. States where the difference between the highest and second highest rates was 10 percent or greater are noted with an asterisk. Figure 5 reports the patient age group with the highest population rate of opioid-related inpatient stays for each of 44 States and the District of Columbia in 2014. Details on the age-specific inpatient rates are shown in Appendix A. |
|
Figure 5. Patient age group with the highest ratea of opioid-related inpatient stays, by State, 2014
Note: Asterisks denote States where the difference between the highest and second highest rates in the State was at least 10 percent. U.S. map that depicts for participating States which age group had the highest rate of opioid-related inpatient stays in 2014. States with the highest rate of opioid-related inpatient stays for ages 25-44 years: Utah, Wyoming, New Mexico, Minnesota, Missouri, Arkansas, Louisiana, Indiana, Ohio, Kentucky, Tennessee, Florida, South Carolina, North Carolina, Virginia, West Virginia, Pennsylvania, New Jersey, Rhode Island, Massachusetts, Vermont, Maine. States with the highest rate of opioid-related inpatient stays for ages 45-64 years: Hawaii, Nevada, Arizona, Oklahoma, Illinois, Michigan, New York, Connecticut, District of Columbia, Maryland. States with highest rate of opioid-related inpatient stays for ages 65+ years: Washington, Oregon, California, Montana, Colorado, North Dakota, South Dakota, Nebraska, Kansas, Texas, Iowa, Wisconsin, Georgia. |
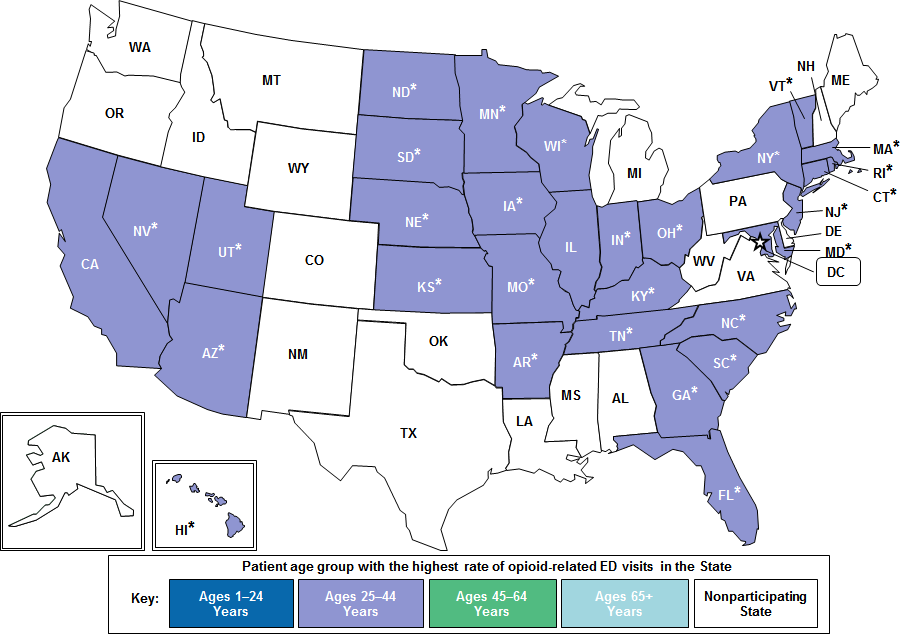
Figure 6 reports the patient age group with the highest population rate of opioid-related ED visits for each of 30 States that provided data in 2014. Details on the age-specific ED visit rates are shown in Appendix B. |
|
Figure 6. Patient age group with the highest ratea of opioid-related ED visits, by State, 2014
Abbreviation: ED, emergency department U.S. map that depicts for participating States which age group had the highest rate of opioid-related ED visits in 2014. States with the highest rate of opioid-related ED visits for ages 25-44 years: California, Nevada, Utah, Arizona, North Dakota, South Dakota, Nebraska, Kansas, Minnesota, Iowa, Missouri, Arkansas, Wisconsin, Illinois, Indiana, Ohio, Kentucky, Tennessee, Florida, Georgia, South Carolina, North Carolina, Maryland, New Jersey, New York, Connecticut, Rhode Island, Massachusetts, Vermont, Hawaii. |
State rankings in rate of opioid-related inpatient stays and ED visits by patient sex and age group, 2014 Tables 1 and 2 present the relative State rankings in the rate of opioid-related inpatient stays (Table 1) and ED visits (Table 2) by patient sex and age group in 2014. State rankings in each patient subgroup are reported based on four quartiles:
|
| Table 1. Ranking in State ratesa of opioid-related inpatient stays, by patient sex and age, 2014 | |||||||
| Key | ● States with the highest opioid-related inpatient rates (top 25 percent) in the patient subgroup | ||||||
| – States with the opioid-related inpatient rates in the middle 50 percent in the patient subgroup | |||||||
| ◉ States with the lowest opioid-related inpatient rates (bottom 25 percent) in the patient subgroup | |||||||
| State | Males | Females | Ages 1-24 years | Ages 25-44 years | Ages 45-64 years | Ages 65+ years | |
|---|---|---|---|---|---|---|---|
| Arizona | – | – | – | – | ● | ● | |
| Arkansas | ◉ | ◉ | ◉ | – | – | ◉ | |
| California | – | – | ◉ | ◉ | – | ● | |
| Colorado | – | – | – | – | – | ● | |
| Connecticut | ● | ● | – | ● | ● | ● | |
| District of Columbia | ● | ● | – | ◉ | ● | ● | |
| Florida | – | – | – | – | – | – | |
| Georgia | ◉ | ◉ | ◉ | ◉ | ◉ | – | |
| Hawaii | – | ◉ | ◉ | ◉ | – | ◉ | |
| Illinois | ● | – | – | – | ● | – | |
| Indiana | – | – | – | – | – | – | |
| Iowa | ◉ | ◉ | ◉ | ◉ | ◉ | ◉ | |
| Kansas | ◉ | ◉ | ◉ | ◉ | ◉ | – | |
| Kentucky | – | ● | ● | ● | – | ◉ | |
| Louisiana | – | ◉ | – | – | ◉ | ◉ | |
| Maine | – | ● | ● | ● | – | – | |
| Maryland | ● | ● | ● | ● | ● | – | |
| Massachusetts | ● | ● | ● | ● | ● | ● | |
| Michigan | – | – | – | – | – | – | |
| Minnesota | – | – | ● | – | – | ● | |
| Missouri | – | – | – | – | – | – | |
| Montana | – | – | – | – | – | ● | |
| Nebraska | ◉ | ◉ | ◉ | ◉ | ◉ | ◉ | |
| Nevada | – | – | – | ◉ | – | – | |
| New Jersey | ● | – | ● | ● | ● | – | |
| New Mexico | – | – | – | – | – | – | |
| New York | ● | – | ● | ● | ● | – | |
| North Carolina | – | – | – | – | – | – | |
| North Dakota | ◉ | – | – | – | ◉ | – | |
| Ohio | – | ● | ● | ● | – | – | |
| Oklahoma | ◉ | – | – | – | – | – | |
| Oregon | – | ● | – | – | ● | ● | |
| Pennsylvania | ● | – | – | ● | – | – | |
| Rhode Island | ● | ● | – | ● | ● | – | |
| South Carolina | ◉ | ◉ | ◉ | – | ◉ | ◉ | |
| South Dakota | ◉ | ◉ | ◉ | ◉ | ◉ | – | |
| Tennessee | – | – | – | – | – | – | |
| Texas | ◉ | ◉ | ◉ | ◉ | ◉ | ◉ | |
| Utah | – | – | – | – | – | – | |
| Vermont | – | – | ● | – | ◉ | ◉ | |
| Virginia | – | – | – | – | – | – | |
| Washington | ● | ● | ● | – | ● | ● | |
| West Virginia | ● | ● | ● | ● | – | ◉ | |
| Wisconsin | – | – | – | – | – | ● | |
| Wyoming | ◉ | ◉ | ◉ | ◉ | ◉ | ◉ | |
| a Opioid-related inpatient rates are per 100,000 population. The actual inpatient rates for both sexes and each age group by State are provided in Appendix A. Source: Agency for Healthcare Research and Quality (AHRQ), Center for Delivery, Organization, and Markets, Healthcare Cost and Utilization Project (HCUP), HCUP Fast Stats, Opioid-Related Hospital Use (https://datatools.ahrq.gov/hcup-fast-stats) based on the HCUP State Inpatient Databases (SID) | |||||||
Table 2 reports the relative rankings of opioid-related ED visits for each of 30 States that provided data in 2014. |
| Table 2. Ranking in State ratesa of opioid-related ED visits, by patient sex and age, 2014 | |||||||
| Key | ● States with the highest opioid-related ED visit rates (top 25 percent) in the patient subgroup | ||||||
| – States with the opioid-related ED visit rates int he middle 50 percent in the patient subgroup | |||||||
| ◉ States with the lowest opioid-related ED visit rates (bottom 25 percent) in the patient subgroup | |||||||
| State | Males | Females | Ages 1-24 years | Ages 25-44 years | Ages 45-64 years | Ages 65+ years | |
|---|---|---|---|---|---|---|---|
| Arizona | – | ● | – | – | ● | ● | |
| Arkansas | ◉ | ◉ | ◉ | ◉ | ◉ | ◉ | |
| California | – | – | – | – | – | ● | |
| Connecticut | ● | – | ● | ● | ● | ◉ | |
| Florida | – | – | – | – | – | ◉ | |
| Georgia | ◉ | ◉ | ◉ | ◉ | ◉ | – | |
| Hawaii | – | ◉ | ◉ | ◉ | – | – | |
| Illinois | – | – | – | – | ● | – | |
| Indiana | – | – | – | – | – | – | |
| Iowa | ◉ | ◉ | ◉ | ◉ | ◉ | ◉ | |
| Kansas | ◉ | ◉ | ◉ | ◉ | ◉ | – | |
| Kentucky | – | ● | ● | ● | – | – | |
| Maryland | ● | ● | ● | ● | ● | ● | |
| Massachusetts | ● | ● | ● | ● | ● | ◉ | |
| Minnesota | – | – | – | – | – | – | |
| Missouri | – | – | – | – | – | – | |
| Nebraska | ◉ | ◉ | ◉ | ◉ | ◉ | – | |
| Nevada | – | – | – | – | – | ● | |
| New Jersey | ● | – | – | – | ● | ◉ | |
| New York | ● | – | – | – | – | ◉ | |
| North Carolina | – | – | – | – | – | ● | |
| North Dakota | ◉ | – | – | – | ◉ | – | |
| Ohio | ● | ● | ● | ● | – | – | |
| Rhode Island | ● | ● | ● | ● | ● | – | |
| South Carolina | – | – | – | – | – | – | |
| South Dakota | ◉ | ◉ | ◉ | ◉ | ◉ | – | |
| Tennessee | – | – | – | – | – | ● | |
| Utah | – | – | – | – | – | ● | |
| Vermont | – | ● | ● | ● | – | – | |
| Wisconsin | – | – | – | – | – | – | |
| Abbreviation: ED, emergency department a Opioid-related ED visit rates are per 100,000 population. The actual ED visit rates for both sexes and each age group by State are provided in Appendix B. Source: Agency for Healthcare Research and Quality (AHRQ), Center for Delivery, Organization, and Markets, Healthcare Cost and Utilization Project (HCUP), HCUP Fast Stats, Opioid-Related Hospital Use (https://datatools.ahrq.gov/hcup-fast-stats) based on the HCUP State Emergency Department Databases (SEDD) | |||||||
|
| Appendix A. State-level ratesa of opioid-related inpatient stays, by patient sex and age group, 2014 | ||||||
| State | Males | Females | Ages 1-24 years | Ages 25-44 years | Ages 45-64 years | Ages 65+ years |
|---|---|---|---|---|---|---|
| Arizona | 229.7 | 264.1 | 65.9 | 275.8 | 399.0 | 371.2 |
| Arkansas | 118.0 | 159.8 | 37.9 | 206.0 | 194.2 | 160.9 |
| California | 168.8 | 167.9 | 40.4 | 159.3 | 286.1 | 303.1 |
| Colorado | 166.0 | 206.4 | 58.5 | 192.4 | 263.6 | 353.7 |
| Connecticut | 377.3 | 299.8 | 78.3 | 490.3 | 515.5 | 297.3 |
| District of Columbia | 472.0 | 312.8 | 62.2 | 186.3 | 1138.8 | 330.8 |
| Florida | 219.8 | 249.3 | 67.1 | 335.9 | 331.7 | 232.6 |
| Georgia | 104.5 | 133.9 | 27.1 | 135.4 | 185.9 | 214.4 |
| Hawaii | 163.6 | 119.3 | 36.7 | 163.1 | 233.4 | 161.8 |
| Illinois | 349.2 | 265.4 | 54.6 | 365.7 | 598.7 | 249.6 |
| Indiana | 176.7 | 216.4 | 63.5 | 320.9 | 240.1 | 226.3 |
| Iowa | 63.0 | 82.3 | 20.1 | 75.8 | 95.3 | 143.8 |
| Kansas | 87.2 | 121.2 | 23.9 | 127.5 | 148.9 | 185.9 |
| Kentucky | 255.8 | 304.2 | 112.4 | 561.4 | 280.3 | 175.1 |
| Louisiana | 155.7 | 155.1 | 52.9 | 287.3 | 176.2 | 132.5 |
| Maine | 273.6 | 326.3 | 115.6 | 620.4 | 254.7 | 274.8 |
| Maryland | 442.7 | 367.2 | 100.8 | 592.2 | 640.7 | 284.7 |
| Massachusetts | 433.4 | 356.3 | 132.3 | 689.0 | 466.8 | 307.6 |
| Michigan | 222.3 | 236.6 | 61.1 | 330.6 | 336.6 | 239.3 |
| Minnesota | 228.2 | 266.0 | 106.1 | 325.4 | 309.1 | 324.2 |
| Missouri | 259.8 | 263.0 | 92.0 | 461.8 | 298.7 | 243.8 |
| Montana | 163.4 | 264.2 | 50.2 | 269.3 | 273.6 | 351.9 |
| Nebraska | 63.4 | 93.5 | 26.6 | 85.6 | 105.4 | 145.7 |
| Nevada | 150.1 | 198.5 | 51.2 | 185.7 | 272.4 | 267.5 |
| New Jersey | 327.3 | 251.9 | 97.7 | 470.3 | 398.5 | 182.6 |
| New Mexico | 205.4 | 225.2 | 83.6 | 340.7 | 266.7 | 219.9 |
| New York | 467.1 | 260.2 | 118.7 | 533.0 | 555.7 | 213.9 |
| North Carolina | 198.8 | 240.0 | 78.4 | 333.6 | 273.1 | 247.8 |
| North Dakota | 133.4 | 190.4 | 55.2 | 231.3 | 184.1 | 244.7 |
| Ohio | 276.6 | 306.7 | 109.8 | 565.4 | 314.6 | 209.9 |
| Oklahoma | 122.9 | 186.7 | 45.9 | 199.4 | 224.2 | 221.2 |
| Oregon | 266.9 | 346.4 | 62.8 | 296.9 | 435.6 | 599.9 |
| Pennsylvania | 299.8 | 271.0 | 94.6 | 506.5 | 339.0 | 237.1 |
| Rhode Island | 421.8 | 335.8 | 86.9 | 623.6 | 540.1 | 281.2 |
| South Carolina | 123.8 | 158.3 | 37.5 | 200.7 | 191.9 | 182.1 |
| South Dakota | 108.6 | 148.2 | 45.5 | 163.8 | 154.8 | 218.4 |
| Tennessee | 222.9 | 279.2 | 83.7 | 372.7 | 336.4 | 261.3 |
| Texas | 90.9 | 106.1 | 29.5 | 115.5 | 147.2 | 178.2 |
| Utah | 189.7 | 219.3 | 69.9 | 325.0 | 288.4 | 270.6 |
| Vermont | 147.6 | 257.4 | 95.3 | 449.0 | 147.4 | 170.4 |
| Virginia | 156.2 | 176.5 | 55.8 | 238.6 | 211.3 | 206.5 |
| Washington | 279.1 | 347.2 | 102.2 | 368.9 | 416.9 | 505.4 |
| West Virginia | 326.7 | 371.2 | 168.5 | 739.9 | 320.9 | 177.6 |
| Wisconsin | 187.1 | 238.2 | 73.8 | 294.0 | 247.1 | 324.5 |
| Wyoming | 74.0 | 118.1 | 24.4 | 142.5 | 125.8 | 133.95 |
| a Opioid-related inpatient rates are per 100,000 population. Source: Agency for Healthcare Research and Quality (AHRQ), Center for Delivery, Organization, and Markets, Healthcare Cost and Utilization Project (HCUP), HCUP Fast Stats, Opioid-Related Hospital Use (https://datatools.ahrq.gov/hcup-fast-stats) based on the HCUP State Inpatient Databases (SID) | ||||||
| Appendix B. State-level ratesa of opioid-related ED visits, by patient sex and age group, 2014 | ||||||
| State | Males | Females | Ages 1-24 years | Ages 25-44 years | Ages 45-64 years | Ages 65+ years |
|---|---|---|---|---|---|---|
| Arizona | 224.4 | 205.4 | 128.5 | 358.1 | 255.0 | 112.6 |
| Arkansas | 63.3 | 79.6 | 35.3 | 130.1 | 81.6 | 41.5 |
| California | 169.0 | 144.0 | 74.3 | 228.6 | 214.9 | 110.9 |
| Connecticut | 323.7 | 188.9 | 157.2 | 549.1 | 231.1 | 47.2 |
| Florida | 110.5 | 107.8 | 59.7 | 220.3 | 111.7 | 41.2 |
| Georgia | 96.3 | 94.5 | 48.4 | 166.1 | 101.6 | 64.9 |
| Hawaii | 130.9 | 93.5 | 46.8 | 179.1 | 158.4 | 56.9 |
| Illinois | 204.4 | 135.0 | 70.5 | 272.9 | 248.9 | 62.0 |
| Indiana | 159.6 | 145.1 | 95.6 | 316.4 | 124.4 | 61.1 |
| Iowa | 37.0 | 53.1 | 22.4 | 69.2 | 51.4 | 47.9 |
| Kansas | 70.7 | 91.4 | 36.0 | 147.6 | 98.6 | 54.5 |
| Kentucky | 230.3 | 209.4 | 131.8 | 494.1 | 159.8 | 60.4 |
| Maryland | 353.5 | 251.1 | 146.9 | 510.2 | 398.3 | 77.1 |
| Massachusetts | 598.8 | 310.4 | 299.1 | 1071.3 | 284.4 | 41.0 |
| Minnesota | 134.6 | 133.7 | 88.1 | 240.6 | 129.0 | 66.8 |
| Missouri | 187.3 | 152.2 | 94.4 | 362.2 | 148.2 | 61.5 |
| Nebraska | 47.0 | 58.2 | 28.0 | 82.6 | 60.2 | 50.3 |
| Nevada | 186.3 | 179.9 | 99.4 | 294.7 | 219.8 | 101.1 |
| New Jersey | 265.4 | 166.1 | 115.4 | 401.2 | 250.0 | 45.1 |
| New York | 252.0 | 123.5 | 109.6 | 340.8 | 204.8 | 40.2 |
| North Carolina | 187.8 | 169.5 | 109.6 | 351.0 | 157.5 | 73.1 |
| North Dakota | 86.4 | 114.7 | 61.2 | 191.5 | 94.3 | 54.2 |
| Ohio | 319.6 | 257.6 | 178.1 | 686.8 | 202.2 | 54.7 |
| Rhode Island | 383.0 | 218.9 | 166.0 | 625.2 | 294.4 | 64.7 |
| South Carolina | 109.5 | 102.3 | 52.1 | 209.9 | 108.4 | 49.1 |
| South Dakota | 61.2 | 65.0 | 33.8 | 118.5 | 59.5 | 51.0 |
| Tennessee | 140.3 | 150.7 | 72.5 | 272.8 | 152.4 | 78.6 |
| Utah | 179.4 | 166.8 | 91.3 | 330.1 | 169.4 | 95.3 |
| Vermont | 226.7 | 220.8 | 139.5 | 558.1 | 145.3 | 68.9 |
| Wisconsin | 165.0 | 148.8 | 103.7 | 333.6 | 118.7 | 59.9 |
| a Opioid-related ED visit rates are per 100,000 population. Source: Agency for Healthcare Research and Quality (AHRQ), Center for Delivery, Organization, and Markets, Healthcare Cost and Utilization Project (HCUP), HCUP Fast Stats, Opioid-Related Hospital Use (https://datatools.ahrq.gov/hcup-fast-stats) based on the HCUP State Emergency Department Databases (SEDD) | ||||||
Data Source
The estimates in this Statistical Brief are based upon data from the Healthcare Cost and Utilization Project (HCUP) 2005-2014 National (Nationwide) Inpatient Sample (NIS), 2005-2014 Nationwide Emergency Department Sample (NEDS), 2014 State Inpatient Databases (SID), and 2014 State Emergency Department Databases (SEDD). The statistics were generated from HCUP Fast Stats, a free, online tool that provides users with easy access to the latest HCUP-based statistics for health information topics, including opioid-related hospital use.4 Inpatient statistics from HCUP Fast Stats were available for the following 44 individual States and the District of Columbia in 2014: Arizona, Arkansas, California, Colorado, Connecticut, District of Columbia, Florida, Georgia, Hawaii, Illinois, Indiana, Iowa, Kansas, Kentucky, Louisiana, Maine, Maryland, Massachusetts, Michigan, Minnesota, Missouri, Montana, Nebraska, Nevada, New Jersey, New Mexico, New York, North Carolina, North Dakota, Ohio, Oklahoma, Oregon, Pennsylvania, Rhode Island, South Carolina, South Dakota, Tennessee, Texas, Utah, Vermont, Virginia, Washington, West Virginia, Wisconsin, and Wyoming. Emergency department (ED) statistics from HCUP Fast Stats were available for the following 30 individual States in 2014: Arizona, Arkansas, California, Connecticut, Florida, Georgia, Hawaii, Illinois, Indiana, Iowa, Kansas, Kentucky, Maryland, Massachusetts, Minnesota, Missouri, Nebraska, Nevada, New Jersey, New York, North Carolina, North Dakota, Ohio, Rhode Island, South Carolina, South Dakota, Tennessee, Utah, Vermont, and Wisconsin. Rates are presented in HCUP Fast Stats using population data obtained from the Claritas, a vendor that compiles and adds value to data from the U.S. Census Bureau.5 Definitions Diagnoses and ICD-9-CM The principal diagnosis is that condition established after study to be chiefly responsible for the patient's admission to the hospital. Secondary diagnoses are concomitant conditions that coexist at the time of admission or develop during the stay. All-listed diagnoses include the principal diagnosis plus these additional secondary conditions. ICD-9-CM is the International Classification of Diseases, Ninth Revision, Clinical Modification, which assigns numeric codes to diagnoses. There are approximately 14,000 ICD-9-CM diagnosis codes. Case definition Opioid-related hospital use was identified using the following all-listed ICD-9-CM diagnosis codes:
It should be noted that ICD-9-CM diagnosis codes related to opioid dependence or abuse “"in remission" were not used to identify opioid-related hospital use because remission does not indicate active use of opioids. Potential changes in the use of ICD-9-CM codes identifying opioid use cannot be isolated in these analyses. These codes include opioid-related use stemming from illicit opioids such as heroin, illegal use of prescription opioids, and the use of opioids as prescribed. Each type of opioid use is important for understanding and addressing the opioid epidemic in the United States.6 While there may be interest in examining how much each type of opioid use contributes to the overall opioid problem, many of the opioid-related codes under the ICD-9-CM clinical coding system do not allow heroin-related cases to be explicitly identified (e.g., in the 304.0x series, heroin is not distinguished from other opioids). In addition, the codes do not distinguish between illegal use of prescription drugs and their use as prescribed. Types of hospitals included in the HCUP National (Nationwide) Inpatient Sample The National (Nationwide) Inpatient Sample (NIS) is based on data from community hospitals, which are defined as short-term, non-Federal, general, and other hospitals, excluding hospital units of other institutions (e.g., prisons). The NIS includes obstetrics and gynecology, otolaryngology, orthopedic, cancer, pediatric, public, and academic medical hospitals. Excluded are long-term care facilities such as rehabilitation, psychiatric, and alcoholism and chemical dependency hospitals. Beginning in 2012, long-term acute care hospitals are also excluded. However, if a patient received long-term care, rehabilitation, or treatment for a psychiatric or chemical dependency condition in a community hospital, the discharge record for that stay will be included in the NIS. Types of hospitals included in the HCUP Nationwide Emergency Department Sample The Nationwide Emergency Department Sample (NEDS) is based on data from community hospitals, which are defined as short-term, non-Federal, general, and other hospitals, excluding hospital units of other institutions (e.g., prisons). The NEDS includes specialty, pediatric, public, and academic medical hospitals. Excluded are long-term care facilities such as rehabilitation, psychiatric, and alcoholism and chemical dependency hospitals. Hospitals included in the NEDS have hospital-owned emergency departments (EDs) and no more than 90 percent of their ED visits resulting in admission. Types of hospitals included in HCUP State Inpatient Databases This analysis used State Inpatient Databases (SID) limited to data from community hospitals, which are defined as short-term, non-Federal, general, and other hospitals, excluding hospital units of other institutions (e.g., prisons). Community hospitals include obstetrics and gynecology, otolaryngology, orthopedic, cancer, pediatric, public, and academic medical hospitals. Excluded for this analysis are long-term care facilities such as rehabilitation, psychiatric, and alcoholism and chemical dependency hospitals. However, if a patient received long-term care, rehabilitation, or treatment for a psychiatric or chemical dependency condition in a community hospital, the discharge record for that stay was included in the analysis. Types of hospitals included in HCUP State Emergency Department Databases This analysis used State Emergency Department Databases (SEDD) limited to data from community hospitals with a hospital-owned emergency department. Community hospitals are defined as short-term, non-Federal, general, and other hospitals, excluding hospital units of other institutions (e.g., prisons). Community hospitals include specialty, pediatric, public, and academic medical hospitals. Excluded for this analysis are long-term care facilities such as rehabilitation, psychiatric, and alcoholism and chemical dependency hospitals. Unit of analysis The unit of analysis for inpatient data is the hospital discharge (i.e., the hospital stay), not a person or patient. This means that a person who is admitted to the hospital multiple times in 1 year will be counted each time as a separate discharge from the hospital. Inpatient stays include those for patients admitted through the emergency department (ED). Patients transferred between inpatient hospitals are counted only once. The unit of analysis for ED data is the ED visit, not a person or patient. This means that a person who is seen in the ED multiple times in 1 year will be counted each time as a separate visit in the ED. ED visits exclude those for patients admitted to the same hospital and also exclude patients transferred to another hospital. About HCUP The Healthcare Cost and Utilization Project (HCUP, pronounced "H-Cup") is a family of healthcare databases and related software tools and products developed through a Federal-State-Industry partnership and sponsored by the Agency for Healthcare Research and Quality (AHRQ). HCUP databases bring together the data collection efforts of State data organizations, hospital associations, and private data organizations (HCUP Partners) and the Federal government to create a national information resource of encounter-level healthcare data. HCUP includes the largest collection of longitudinal hospital care data in the United States, with all-payer, encounter-level information beginning in 1988. These databases enable research on a broad range of health policy issues, including cost and quality of health services, medical practice patterns, access to healthcare programs, and outcomes of treatments at the national, State, and local market levels. HCUP would not be possible without the contributions of the following data collection Partners from across the United States: Alaska Department of Health and Social Services Alaska State Hospital and Nursing Home Association Arizona Department of Health Services Arkansas Department of Health California Office of Statewide Health Planning and Development Colorado Hospital Association Connecticut Hospital Association District of Columbia Hospital Association Florida Agency for Health Care Administration Georgia Hospital Association Hawaii Health Information Corporation Illinois Department of Public Health Indiana Hospital Association Iowa Hospital Association Kansas Hospital Association Kentucky Cabinet for Health and Family Services Louisiana Department of Health Maine Health Data Organization Maryland Health Services Cost Review Commission Massachusetts Center for Health Information and Analysis Michigan Health & Hospital Association Minnesota Hospital Association Mississippi State Department of Health Missouri Hospital Industry Data Institute Montana Hospital Association Nebraska Hospital Association Nevada Department of Health and Human Services New Hampshire Department of Health & Human Services New Jersey Department of Health New Mexico Department of Health New York State Department of Health North Carolina Department of Health and Human Services North Dakota (data provided by the Minnesota Hospital Association) Ohio Hospital Association Oklahoma State Department of Health Oregon Association of Hospitals and Health Systems Oregon Office of Health Analytics Pennsylvania Health Care Cost Containment Council Rhode Island Department of Health South Carolina Revenue and Fiscal Affairs Office South Dakota Association of Healthcare Organizations Tennessee Hospital Association Texas Department of State Health Services Utah Department of Health Vermont Association of Hospitals and Health Systems Virginia Health Information Washington State Department of Health West Virginia Health Care Authority Wisconsin Department of Health Services Wyoming Hospital Association About Statistical Briefs HCUP Statistical Briefs are descriptive summary reports presenting statistics on hospital inpatient, ambulatory surgery, and emergency department use and costs, quality of care, access to care, medical conditions, procedures, patient populations, and other topics. The reports use HCUP administrative healthcare data. About the NIS The HCUP National (Nationwide) Inpatient Sample (NIS) is a nationwide database of hospital inpatient stays. The NIS is nationally representative of all community hospitals (i.e., short-term, non-Federal, nonrehabilitation hospitals). The NIS includes all payers. It is drawn from a sampling frame that contains hospitals comprising more than 95 percent of all discharges in the United States. The vast size of the NIS allows the study of topics at the national and regional levels for specific subgroups of patients. In addition, NIS data are standardized across years to facilitate ease of use. Over time, the sampling frame for the NIS has changed; thus, the number of States contributing to the NIS varies from year to year. The NIS is intended for national estimates only; no State-level estimates can be produced. The 2012 NIS was redesigned to optimize national estimates. The redesign incorporates two critical changes:
The new sampling strategy is expected to result in more precise estimates than those that resulted from the previous NIS design by reducing sampling error: for many estimates, confidence intervals under the new design are about half the length of confidence intervals under the previous design. The change in sample design for 2012 necessitates recomputation of prior years' NIS data to enable analyses of trends that use the same definitions of discharges and hospitals. About the NEDS The HCUP Nationwide Emergency Department Database (NEDS) is a unique and powerful database that yields national estimates of emergency department (ED) visits. The NEDS was constructed using records from both the HCUP State Emergency Department Databases (SEDD) and the State Inpatient Databases (SID). The SEDD capture information on ED visits that do not result in an admission (i.e., patients who were treated in the ED and then released from the ED, or patients who were transferred to another hospital); the SID contain information on patients initially seen in the ED and then admitted to the same hospital. The NEDS was created to enable analyses of ED utilization patterns and support public health professionals, administrators, policymakers, and clinicians in their decision making regarding this critical source of care. The NEDS is produced annually beginning in 2006. Over time, the sampling frame for the NEDS has changed; thus, the number of States contributing to the NEDS varies from year to year. The NEDS is intended for national estimates only; no State-level estimates can be produced. About the SID The HCUP State Inpatient Databases (SID) are hospital inpatient databases from data organizations participating in HCUP. The SID contain the universe of the inpatient discharge abstracts in the participating HCUP States, translated into a uniform format to facilitate multistate comparisons and analyses. Together, the SID encompass more than 95 percent of all U.S. community hospital discharges. The SID can be used to investigate questions unique to one State, to compare data from two or more States, to conduct market-area variation analyses, and to identify State-specific trends in inpatient care utilization, access, charges, and outcomes. About the SEDD The HCUP State Emergency Department Databases (SEDD) include information from hospital-owned emergency departments (EDs) from data organizations participating in HCUP, translated into a uniform format to facilitate multistate comparisons and analyses. The SEDD capture information on ED visits that do not result in an admission to the same hospital (i.e., patients who are treated in the ED and then discharged, transferred to another hospital, left against medical advice, or died). The SEDD contain a core set of clinical and nonclinical information on all patients, including individuals covered by Medicare, Medicaid, or private insurance, as well as those who are uninsured. The SEDD can be used to investigate questions unique to one State, to compare data from two or more States, to conduct market-area variation analyses, and to identify State-specific trends in injury surveillance, emerging infections, and other conditions treated in the ED. About HCUP Fast Stats HCUP Fast Stats (https://datatools.ahrq.gov/hcup-fast-stats) is an interactive, online tool that provides easy access to the quarterly HCUP-based statistics for select State and national health information topics. HCUP Fast Stats uses side-by-side comparisons of visual statistical displays, trend figures, or simple tables to convey complex information at a glance. Topics currently available in HCUP Fast Stats include State Trends in Hospital Use by Payer; National Hospital Utilization and Costs; and Opioid-Related Hospital Use, National and State. HCUP Fast Stats presents statistics using data from HCUP's National (Nationwide) Inpatient Sample (NIS), the Nationwide Emergency Department Sample (NEDS), the State Inpatient Databases (SID), and the State Emergency Department Databases (SEDD). For More Information For other information on mental health and substance abuse, including opioids, refer to the HCUP Statistical Briefs located at www.hcup-us.ahrq.gov/reports/statbriefs/sb_mhsa.jsp. For additional HCUP statistics, visit:
For more information about HCUP, visit www.hcup-us.ahrq.gov/. For a detailed description of HCUP and more information on the design of the National (Nationwide) Inpatient Sample, Nationwide Emergency Department Sample (NEDS), State Inpatient Databases (SID), or State Emergency Department Databases (SEDD), please refer to the following database documentation: Agency for Healthcare Research and Quality. Overview of the National (Nationwide) Inpatient Sample (NIS). Healthcare Cost and Utilization Project (HCUP). Rockville, MD: Agency for Healthcare Research and Quality. Updated December 2016. www.hcup-us.ahrq.gov/nisoverview.jsp. Accessed January 31, 2017. Agency for Healthcare Research and Quality. Overview of the Nationwide Emergency Department Sample (NEDS). Healthcare Cost and Utilization Project (HCUP). Rockville, MD: Agency for Healthcare Research and Quality. Updated December 2016.www.hcup-us.ahrq.gov/nedsoverview.jsp. Accessed January 31, 2017. Agency for Healthcare Research and Quality. Overview of the State Inpatient Databases (SID). Healthcare Cost and Utilization Project (HCUP). Rockville, MD: Agency for Healthcare Research and Quality. Updated June 2016. www.hcup-us.ahrq.gov/sidoverview.jsp. Accessed January 31, 2017. Agency for Healthcare Research and Quality. Overview of the State Emergency Department Databases (SEDD). Healthcare Cost and Utilization Project (HCUP). Rockville, MD: Agency for Healthcare Research and Quality. Updated June 2016. www.hcup-us.ahrq.gov/seddoverview.jsp. Accessed January 31, 2017. Suggested Citation Weiss AJ (IBM Watson Health), Bailey MK (IBM Watson Health), O'Malley L (IBM Watson Health), Barrett ML (M.L. Barrett, Inc.), Elixhauser A (AHRQ), Steiner CA (Institute for Health Research, Kaiser Permanente). Patient Characteristics of Opioid-Related Inpatient Stays and Emergency Department Visits Nationally and by State, 2014. HCUP Statistical Brief #224. June 2017. Agency for Healthcare Research and Quality, Rockville, MD. www.hcup-us.ahrq.gov/reports/statbriefs/sb224-Patient-Characteristics-Opioid-Hospital-Stays-ED-Visits-by-State.pdf. Acknowledgments The authors would like to acknowledge the contributions of Brian Eppert of Coding Leap, LLC, and Minya Sheng of IBM Watson Health. *** AHRQ welcomes questions and comments from readers of this publication who are interested in obtaining more information about access, cost, use, financing, and quality of healthcare in the United States. We also invite you to tell us how you are using this Statistical Brief and other HCUP data and tools, and to share suggestions on how HCUP products might be enhanced to further meet your needs. Please e-mail us at hcup@ahrq.gov or send a letter to the address below:Sharon B. Arnold, Ph.D., Acting Director Center for Delivery, Organization, and Markets Agency for Healthcare Research and Quality 5600 Fishers Lane Rockville, MD 20857 This Statistical Brief was posted online on June 20, 2017. 1 Weiss AJ, Elixhauser A, Barrett ML, Steiner CA, Bailey MK, O'Malley L. Opioid-Related Inpatient Stays and Emergency Department Visits by State, 2009-2014. HCUP Statistical Brief #219. December 2016. Agency for Healthcare Research and Quality, Rockville, MD. www.hcup-us.ahrq.gov/reports/statbriefs/sb219-Opioid-Hospital-Stays-ED-Visits-by-State.pdf. Accessed February 9, 2017. 2 Agency for Healthcare Research and Quality. HCUP Fast Stats website, Opioid- Related Hospital Use path. https://datatools.ahrq.gov/hcup-fast-stats. Accessed January 26, 2017. 3 Weiss et al., 2016. Op. cit. 4 Agency for Healthcare Research and Quality. HCUP Fast Stats website, Opioid-Related Hospital Use path. https://datatools.ahrq.gov/hcup-fast-stats. Accessed January 26, 2017. 5 Claritas. Claritas Demographic Profile. www.claritas.com. 6 Compton WM, Jones CM, Baldwin GT. Relationship between nonmedical prescription-opioid use and heroin use. The New England Journal of Medicine. 2016;374:154-63. |