STATISTICAL BRIEF #220 |
January 2017
Pamela L. Owens, Ph.D., Kathryn R. Fingar, Ph.D., M.P.H., Kevin C. Heslin, Ph.D., Ryan Mutter, Ph.D., and Chelsea L. Booth, Ph.D. If You Know Someone in Crisis Call the toll-free National Suicide Prevention Lifeline1 at 1-800-273-TALK (8255), 24 hours a day, 7 days a week. The service is available to everyone. All calls are confidential. You can also visit the Lifeline's website at http://www.suicidepreventionlifeline.org Introduction Suicide is a major public health concern that causes immeasurable pain and suffering to individuals, families, and communities nationwide. Suicide is the tenth leading cause of death overall and the second leading cause among Americans aged 10-44 years.2 In 2014, the suicide rate reached a 30-year high, accounting for nearly 43,000 deaths.3,4 Suicide is preventable, however. Suicidal thoughts or actions are signs of extreme distress, and require intervention. Emergency departments (EDs) have been identified as an important site of care to identify individuals at risk, to provide timely support and intervention, and to facilitate entry into more intensive treatment, if appropriate.5 This Healthcare Cost and Utilization Project (HCUP) Statistical Brief presents information on ED visits related to suicidal ideation among adults aged 18 years or older in 2006, 2010, and 2013. Trends in the population-based rate of ED visits related to suicidal ideation are presented overall and by patient and hospital characteristics. Trends in the number of admissions to the same hospital are examined over time, as well as the cost and length of these inpatient stays. ED visits related to suicidal ideation are then compared with all other adult ED visits in 2013, including overall visits, and by patient characteristics, expected payer, and disposition status. Finally, co-occurring injuries and mental and substance use disorders for patients with ED visits related to suicidal ideation in 2013 are presented. Differences greater than 10 percent are noted in the text. Findings Trends in ED visits related to suicidal ideation, 2006-2013 Figure 1 presents population-based rates of ED visits related to suicidal ideation by patient characteristics, including sex, age, and community-level income based on the patient's ZIP Code of residence. |
|
|
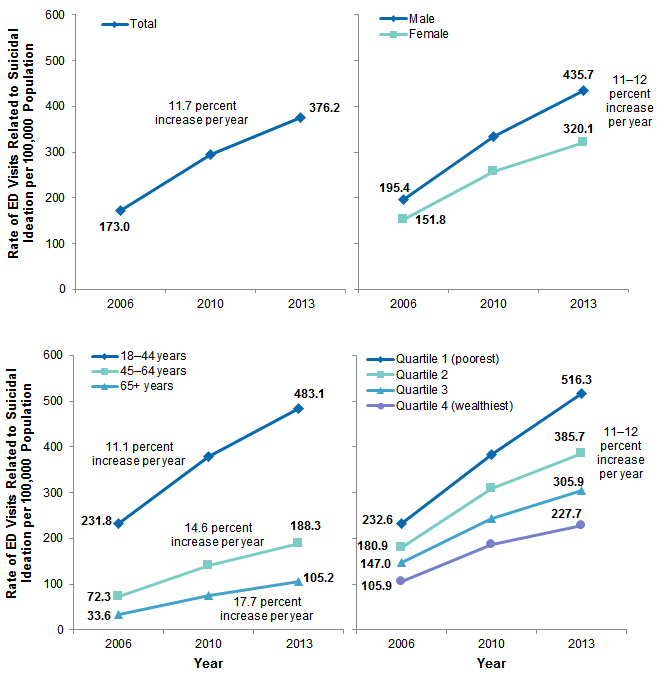
Figure 1. Population-based rates of ED visits related to suicidal ideation among adults: overall and by sex, age, and community-level income, 2006-2013
Abbreviation: ED, emergency department Four line graphs that show the rate of ED visits related to suicidal ideation per 100,000 population. Total: increased steadily from 173.0 in 2006 to 376.2 in 2013. By sex: male: increased steadily from 195.4 in 2006 to 435.7 in 2013; female: increased steadily from 151.8 in 2006 to 320.1 in 2013. By age: 18-44 years: increased steadily from 231.8 in 2006 to 483.1 in 2013; 45-64 years: increased steadily from 72.3 in 2006 to 188.3 in 2013; 65+ years: increased steadily from 33.6 in 2006 to 105.2 in 2013. By income quartile: quartile 1 (poorest): increased steadily from 232.6 in 2006 to 516.3 in 2013; quartile 2: increased steadily from 180.9 in 2006 to 385.7 in 2013; quartile 3: increased steadily from 147.0 in 2006 to 305.9 in 2013; quartile 4 (wealthiest): increased steadily from 105.9 in 2006 to 227.7 in 2013.
|
Table 1 presents the detailed population-based rates of ED visits related to suicidal ideation by patient and hospital characteristics in 2006, 2010, and 2013. The average annual percent change in population-based rates from 2006 to 2013 is also provided. |
| Table 1. Population-based rates of ED visits related to suicidal ideation among adults by patient and hospital characteristics, 2006-2013 | ||||
| Characteristic | 2006 | 2010 | 2013 | Average annual percent change, 2006-2013 |
|---|---|---|---|---|
| Total ED visits related to suicidal ideation | ||||
| N | 388,100 | 690,200 | 903,400 | N/A |
| % of all ED visits | 0.4 | 0.7 | 0.8 | |
| Rate per 100,000 population | 173.0 | 294.9 | 376.2 | 11.7 |
| Sex | age, rate per 100,000 population | ||||
| Male | 195.4 | 334.7 | 435.7 | 12.1 |
| 18-24 years | 206.4 | 383.4 | 486.5 | 13.0 |
| 25-44 years | 266.1 | 409.7 | 546.2 | 10.8 |
| 45-64 years | 177.2 | 344.8 | 451.8 | 14.3 |
| 65-84 years | 37.6 | 84.3 | 118.5 | 17.8 |
| 85+ years | 41.0 | 91.2 | 130.7 | 18.0 |
| Female | 151.8 | 257.1 | 320.1 | 11.2 |
| 18-24 years | 216.2 | 387.8 | 485.3 | 12.2 |
| 25-44 years | 212.0 | 340.3 | 417.6 | 10.2 |
| 45-64 years | 131.6 | 234.4 | 299.4 | 12.5 |
| 65-84 years | 31.7 | 71.9 | 96.7 | 17.3 |
| 85+ years | 24.3 | 54.8 | 79.9 | 18.5 |
| Community-level income based on ZIP Code, rate per 100,000 population | ||||
| Quartile 1 (poorest) | 232.6 | 383.2 | 516.3 | 12.1 |
| Quartile 2 | 180.9 | 308.2 | 385.7 | 11.4 |
| Quartile 3 | 147.0 | 243.9 | 305.9 | 11.0 |
| Quartile 4 (wealthiest) | 105.9 | 187.8 | 227.7 | 11.6 |
| Region (hospital location), rate per 100,000 population | ||||
| Northeast | 200.9 | 317.0 | 364.2 | 8.9 |
| Midwest | 172.1 | 331.1 | 451.3 | 14.8 |
| South | 198.0 | 304.3 | 393.2 | 10.3 |
| West | 111.0 | 228.9 | 289.1 | 14.7 |
| Abbreviations: ED, emergency department; N/A, not applicable Source: Agency for Healthcare Research and Quality (AHRQ), Center for Delivery, Organization, and Markets, Healthcare Cost and Utilization Project (HCUP), Nationwide Emergency Department Sample (NEDS), 2006, 2010, and 2013 | ||||
Table 2 presents the number and percentage of ED visits related to suicidal ideation that resulted in admission to the same hospital or transfer to another hospital or facility from 2006 to 2013. The average length of the inpatient stay and aggregate and average costs are shown for those visits that resulted in admission to the same hospital. Costs include those incurred in the ED combined with those incurred during inpatient care. The average annual percent change from 2006 to 2013 also is presented. ED visits unrelated to suicidal ideation are presented for comparison. |
| Table 2. Trends in inpatient admissions and transfers among ED visits related and unrelated to suicidal ideation among adults, 2006-2013 | ||||
| Variable | 2006 | 2010 | 2013 | Average Annual Percentage Change, 2006-2013 |
|---|---|---|---|---|
| ED visits related to suicidal ideation, N | 388,100 | 690,200 | 903,400 | 12.8 |
| Transferred to other hospital or facility or admitted to the same hospital | ||||
| N | 258,900 | 485,700 | 649,000 | 14.0 |
| % | 66.7 | 70.4 | 71.8 | 1.1 |
| Transferred to other hospital or facility | ||||
| N | 128,400 | 210,200 | 275,500 | 11.6 |
| % | 33.1 | 30.5 | 30.6 | -1.1 |
| Admitted to same hospital | ||||
| N | 130,500 | 275,500 | 372,400 | 16.2 |
| % | 33.6 | 39.9 | 41.2 | 3.0 |
| Average length of inpatient stay, days | 5.1 | 5.8 | 5.6 | 1.5 |
| ED and inpatient costs combined | ||||
| Aggregate cost in millions, $ | 600 | 1,700 | 2,200 | 20.4 |
| Average cost per stay, $ | 5,000 | 6,200 | 6,000 | 2.6 |
| Average cost per day, $ | 1,200 | 1,300 | 1,200 | 0.0 |
| All other ED visits, N | 93,218,400 | 102,760,100 | 107,363,200 | 2.0 |
| Transferred to other hospital or facility or admitted to the same hospital | ||||
| N | 19,555,700 | 21,028,200 | 20,797,300 | 0.9 |
| % | 21.0 | 20.4 | 19.4 | -1.1 |
| Transferred to other hospital or facility | ||||
| N | 2,309,100 | 2,584,900 | 2,858,000 | 3.1 |
| % | 2.5 | 2.5 | 2.7 | 1.0 |
| Admitted to same hospital | ||||
| N | 17,246,600 | 18,443,400 | 17,939,300 | 0.6 |
| % | 18.5 | 17.9 | 16.7 | -1.4 |
| Average length of inpatient stay, days | 5.0 | 4.9 | 4.9 | -0.5 |
| ED and inpatient costs combined | ||||
| Aggregate cost in millions, $ | 184,000 | 195,900 | 195,800 | 0.9 |
| Average cost per stay, $ | 10,700 | 10,800 | 11,100 | 0.5 |
| Average cost per day, $ | 2,400 | 2,600 | 2,700 | 1.7 |
| Abbreviation: ED, emergency department; N, number Notes: Inflation-adjusted costs are presented in 2013 dollars. Length of stay and cost of the inpatient stay are presented for ED visits resulting in admission to the same hospital and do not include those that were transferred to another hospital or facility. Source: Agency for Healthcare Research and Quality (AHRQ), Center for Delivery, Organization, and Markets, Healthcare Cost and Utilization Project (HCUP), Nationwide Emergency Department Sample (NEDS), 2006, 2010, and 2013 | ||||
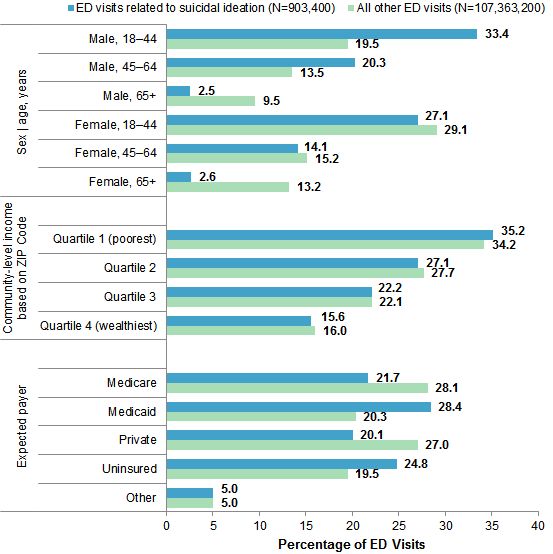
Characteristics and disposition of ED visits related to suicidal ideation, compared with other visits, 2013 Figure 2 displays the percentage of selected patient characteristics among adult ED visits related to suicidal ideation in 2013. Patient characteristics of all other types of ED visits are also presented for comparison. |
|
Figure 2. Characteristics of ED visits related and unrelated to suicidal ideation among adults aged 18 years and older, 2013
Abbreviation: ED, emergency department Bar chart that shows characteristics of ED visits related (N=903,400) and unrelated (N=107,363,200) to suicidal ideation among adults aged 18 years and older in 2013. Sex/age in years: male, 18-44: 33.4% of ED visits related to suicidal ideation, 19.5% of other ED visits; male, 45-64: 20.3% of ED visits related to suicidal ideation, 13.5% of other ED visits; male, 65+: 2.5% of ED visits related to suicidal ideation, 9.5% of other ED visits; female, 18-44: 27.1% of ED visits related to suicidal ideation, 29.1% of other ED visits; female, 45-64: 14.1% of ED visits related to suicidal ideation, 15.2% of other ED visits; female, 65+: 2.6% of ED visits related to suicidal ideation, 13.2% of other ED visits. Community-level income based on ZIP Code: Quartile 1 (poorest): 35.2% of ED visits related to suicidal ideation, 34.2% of other ED visits; Quartile 2: 27.1% of ED visits related to suicidal ideation, 27.7% of other ED visits; Quartile 3: 22.2% of ED visits related to suicidal ideation, 22.1% of other ED visits; Quartile 4 (wealthiest): 15.6% of ED visits related to suicidal ideation, 16.0% of other ED visits. Expected payer: Medicare: 21.7% of ED visits related to suicidal ideation, 28.1% of other ED visits; Medicaid: 28.4% of ED visits related to suicidal ideation, 20.3% of other ED visits; Private: 20.1% of ED visits related to suicidal ideation, 27.0% of other ED visits; Uninsured: 24.8% of ED visits related to suicidal ideation, 19.5% of other ED visits; Other: 5.0% of ED visits related to suicidal ideation, 5.0% of other ED visits.
|
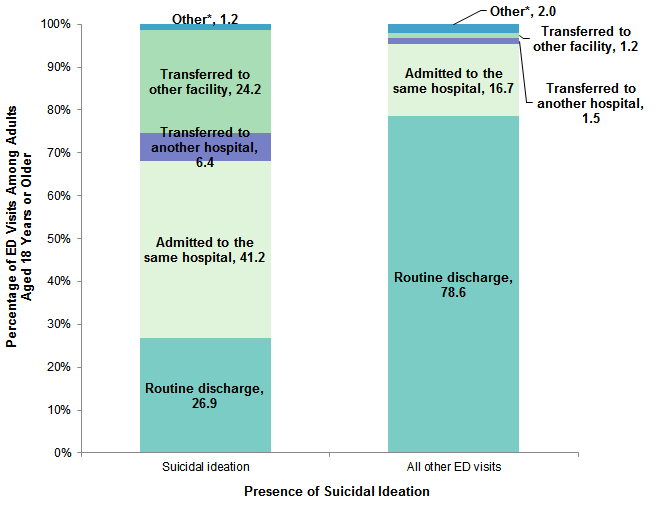
Figure 3 displays the disposition following ED visits related to suicidal ideation in 2013. The disposition following all other types of ED visits is presented for comparison. |
|
Figure 3. Disposition of ED visits related and unrelated to suicidal ideation among adults, 2013
Abbreviation: ED, emergency department Stacked bar chart showing the disposition of ED visits related and unrelated to suicidal ideation among adults aged 18 years or older in 2013. Suicidal ideation: routine discharge, 26.9%; admitted to the same hospital, 41.2%; transferred to another hospital, 6.4%; transferred to another facility, 24.2%; other, 1.2%. All other ED visits: routine discharge, 78.6%; admitted to the same hospital, 16.7%; transferred to another hospital, 1.5%; transferred to another facility, 1.2%; other, 2.0%.
|
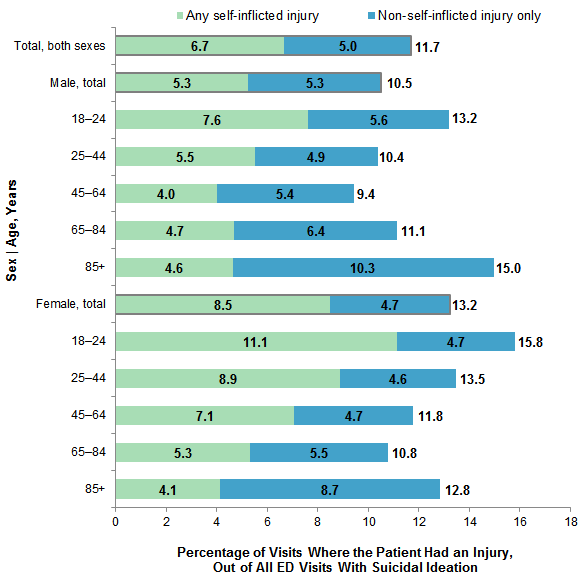
Co-occurring conditions associated with suicidal ideation-related ED visits, 2013 Figure 4 displays the percentage of ED visits related to suicidal ideation in which the patient also had a diagnosis for a self-inflicted or non-self-inflicted injury, overall and by patient sex and age, in 2013. |
|
Figure 4. Prevalence of injuries associated with ED visits related to suicidal ideation among adults, overall and by patient sex and age, 2013
Abbreviation: ED, emergency department Stacked bar chart that shows the percentage of ED visits where patient had an injury out of all ED visits with suicidal ideation in 2013 by sex and age. Total, both sexes: 6.7% any self-inflicted injury; 5.0% non-self-inflicted injury. Male, total: 5.3% any self-inflicted injury; 5.3% non-self-inflicted injury. Male, 18-24 years: 7.6% any self-inflicted injury; 5.6% non-self-inflicted injury. Male, 25-44 years: 5.5% any self-inflicted injury; 4.9% non-self-inflicted injury. Male, 45-64 years: 4.0% any self-inflicted injury; 5.4% non-self-inflicted injury. Male, 65-84 years: 4.7% any self-inflicted injury; 6.4% non-self-inflicted injury. Male, 85+ years: 4.6% any self-inflicted injury; 10.3% non-self-inflicted injury. Female, total: 8.5% any self-inflicted injury; 4.7% non-self-inflicted injury. Female, 18-24 years: 11.1% any self-inflicted injury; 4.7% non-self-inflicted injury. Female, 25-44 years: 8.9% any self-inflicted injury; 4.6% non-self-inflicted injury. Female, 45-64 years: 7.1% any self-inflicted injury; 4.7% non-self-inflicted injury. Female, 65-84 years: 5.3% any self-inflicted injury; 5.5% non-self-inflicted injury. Female, 85+ years: 4.1% any self-inflicted injury; 8.7% non-self-inflicted injury.
|
Table 3 presents the leading co-occurring mental and substance use disorders among patients with an ED visit related to suicidal ideation by patient age, in 2013. Patients may have more than one mental or substance use disorder listed on their record; thus percentages in Table 3 total more than 100. |
| Table 3. Top five co-occurring mental and substance use disorder diagnoses for ED visits related to suicidal ideation among adults, by patient age, 2013 | ||||||||||||
| Any-Listed Diagnoses | Total | 18-24 years | 25-44 years | 45-64 years | 65-84 years | 85+ years | ||||||
|---|---|---|---|---|---|---|---|---|---|---|---|---|
| Rank | % | Rank | % | Rank | % | Rank | % | Rank | % | Rank | % | |
| Total, N | 903,400 | 152,300 | 394,300 | 310,600 | 40,500 | 5,700 | ||||||
| Mood disorders | 1 | 75.9 | 1 | 75.0 | 1 | 75.6 | 1 | 77.0 | 1 | 76.4 | 1 | 64.5 |
| Substance-related disorders | 2 | 42.8 | 2 | 41.4 | 2 | 50.7 | 3 | 38.2 | - | - | - | - |
| Alcohol-related disorders | 3 | 29.6 | 4 | 13.9 | 3 | 27.8 | 2 | 41.2 | 3 | 21.2 | - | - |
| Anxiety disorders | 4 | 26.1 | 3 | 25.4 | 4 | 27.2 | 4 | 25.1 | 2 | 26.9 | 3 | 18.2 |
| Schizophrenia and other psychotic disorders | 5 | 18.1 | 5 | 13.3 | 5 | 19.4 | 5 | 19.6 | 5 | 13.2 | 4 | 9.7 |
| Delirium, dementia, amnestic, other cognitive disorders | - | - | - | - | - | - | - | - | 4 | 20.5 | 2 | 59.3 |
| Adjustment disorders | - | - | - | - | - | - | - | - | - | - | 25 | 5.0 |
| Note: A dash indicates that the condition did not rank among the top five diagnoses. Source: Agency for Healthcare Research and Quality (AHRQ), Center for Delivery, Organization, and Markets, Healthcare Cost and Utilization Project (HCUP), Nationwide Emergency Department Sample (NEDS), 2013 | ||||||||||||
Data Source The estimates in this Statistical Brief are based upon data from the Healthcare Cost and Utilization Project (HCUP) 2006, 2010, and 2013 Nationwide Emergency Department Sample (NEDS). Supplemental sources included population denominator demographic data provided by the Nielsen Company, a vendor that compiles and adds value to the U.S. Bureau of Census data. Nielsen uses intracensus methods to estimate household and demographic statistics by ZIP Code. 6 Definitions Diagnoses, ICD-9-CM, and Clinical Classifications Software (CCS) The principal diagnosis is that condition established after study to be chiefly responsible for the patient's admission to the hospital. Secondary diagnoses are concomitant conditions that coexist at the time of admission or develop during the stay. All-listed diagnoses include the principal diagnosis plus these additional secondary conditions. ICD-9-CM is the International Classification of Diseases, Ninth Revision, Clinical Modification, which assigns numeric codes to diagnoses. There are approximately 14,000 ICD-9-CM diagnosis codes. CCS categorizes ICD-9-CM diagnosis codes into a manageable number of clinically meaningful categories.7 This clinical grouper makes it easier to quickly understand patterns of diagnoses use. CCS categories identified as Other and Screening and history of mental health and substance abuse typically are not reported; these categories include miscellaneous, otherwise unclassifiable diagnoses that may be difficult to interpret as a group. Case definition Suicidal ideation was defined using all-listed diagnoses and the ICD-9-CM code V62.84. Diagnoses related to mental and substance use disorders were defined according to the CCS categories listed in Table 4. |
| Table 4. Codes used to define mental and substance use disorders | |
| CCS Description | Description |
|---|---|
| 650 | Adjustment disorders |
| 651 | Anxiety disorders |
| 652 | Attention-deficit, conduct, and disruptive behavior disorders |
| 653 | Delirium, dementia, and amnestic and other cognitive disorders |
| 655 | Disorders usually diagnosed in infancy, childhood, or adolescence |
| 656 | Impulse control disorders, NEC |
| 657 | Mood disorders |
| 658 | Personality disorders |
| 659 | Schizophrenia and other psychotic disorders |
| 660 | Alcohol-related disorders |
| 661 | Substance-related disorders |
| 670 | Miscellaneous mental health disorders |
Self-inflicted injuries were defined using all-listed diagnoses in which a self-inflicted external cause of injury code (E code) was specified.8 Non-self-inflicted injuries were defined using all-listed diagnoses in which either an E code for another injury intent (e.g., unintentional injury) or an ICD-9-CM diagnosis code for an injury was specified. ED visits were categorized according to a hierarchy as having any self-inflicted injury or another type of injury without evidence of self-inflicted injury. Injury E codes and descriptions are listed in Table 5.
|
| ICD-9 E code | Description |
|---|---|
| E950-E959 | Self-inflicted injury |
| E800-E869, E880-E929 | Unintentional injury |
| E960-E969, E979, E999.1 | Assault-related injury |
| E980-E989 | Injury of undetermined intent |
| E970-E978, E990-E999.0 | Injury of other intent |
| ICD-9 Diagnosis Code | Description |
| 800-829 | Fracture |
| 830-839 | Dislocation |
| 840-848 | Sprain/strain |
| 850-854, 860-869, 952, 995.55 | Internal injury |
| 870-884, 890-894 | Open wound |
| 885-887, 895v897 | Amputation |
| 900-904 | Blood vessels |
| 910-924 | Contusion/superficial |
| 925-929 | Crush |
| 940-949 | Burns |
| 950-951, 953-957 | Nerves |
| 959 | Unspecified |
| Sources: E codes were obtained from the Centers for Disease Control and Prevention, Matrix of E-code Groupings, available at http://www.cdc.gov/injury/wisqars/ecode_matrix.html. | |
Types of hospitals included in the HCUP Nationwide Emergency Department Sample
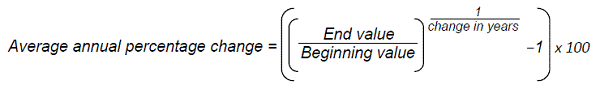
The Nationwide Emergency Department Sample (NEDS) is based on data from community hospitals, which are defined as short-term, non-Federal, general, and other hospitals, excluding hospital units of other institutions (e.g., prisons). The NEDS includes specialty, pediatric, public, and academic medical hospitals. Excluded are long-term care facilities such as rehabilitation, psychiatric, and alcoholism and chemical dependency hospitals. Hospitals included in the NEDS have hospital-owned emergency departments (EDs) and no more than 90 percent of their ED visits resulting in admission. Unit of analysis The unit of analysis is the emergency department (ED) encounter, not a person or patient. This means that a person who is seen in the same ED multiple times in 1 year will be counted each time as a separate encounter in the ED. Average annual percent change Average annual percent change was calculated using the following formula:
Average annual percentage change equals open parenthesis, open parenthesis, end value divided by beginning value, close parenthesis, to the power of 1 divided by change in years, minus 1, close parenthesis, multiplied by 100.
Costs and charges Total hospital charges were converted to costs using HCUP Cost-to-Charge Ratios based on hospital accounting reports from the Centers for Medicare & Medicaid Services (CMS).9 Costs reflect the actual expenses incurred in the production of hospital services, such as wages, supplies, and utility costs; charges represent the amount a hospital billed for the case. For each hospital, a hospital-wide cost-to-charge ratio is used. Hospital charges reflect the amount the hospital billed for the entire hospital stay and do not include professional (physician) fees. For the purposes of this Statistical Brief, costs are reported to the nearest hundred. Annual costs were inflation adjusted using the Gross Domestic Product (GDP) Price Index from the U.S. Department of Commerce, Bureau of Economic Analysis (BEA), with 2013 as the index base.10 That is, all costs are expressed in 2013 dollars. Mean cost per day is calculated as the mean cost per stay divided by the mean length of stay. How HCUP estimates of costs differ from National Health Expenditure Accounts There are a number of differences between the costs cited in this Statistical Brief and spending as measured in the National Health Expenditure Accounts (NHEA), which are produced annually by CMS.11 The largest source of difference comes from the HCUP coverage of inpatient treatment only in contrast to the NHEA inclusion of outpatient costs associated with emergency departments and other hospital-based outpatient clinics and departments as well. The outpatient portion of hospitals' activities has been growing steadily and may exceed half of all hospital revenue in recent years. On the basis of the American Hospital Association Annual Survey, 2012 outpatient gross revenues (or charges) were about 44 percent of total hospital gross revenues.12 Smaller sources of differences come from the inclusion in the NHEA of hospitals that are excluded from HCUP. These include Federal hospitals (Department of Defense, Veterans Administration, Indian Health Services, and Department of Justice [prison] hospitals) as well as psychiatric, substance abuse, and long-term care hospitals. A third source of difference lies in the HCUP reliance on billed charges from hospitals to payers, adjusted to provide estimates of costs using hospital-wide cost-to-charge ratios, in contrast to the NHEA measurement of spending or revenue. HCUP costs estimate the amount of money required to produce hospital services, including expenses for wages, salaries, and benefits paid to staff as well as utilities, maintenance, and other similar expenses required to run a hospital. NHEA spending or revenue measures the amount of income received by the hospital for treatment and other services provided, including payments by insurers, patients, or government programs. The difference between revenues and costs include profit for for-profit hospitals or surpluses for nonprofit hospitals. Median community-level income Median community-level income is the median household income of the patient's ZIP Code of residence. Income levels are separated into population-based quartiles with cut-offs determined using ZIP Code demographic data obtained from the Nielsen Company. The income quartile is missing for patients who are homeless or foreign. Payer Payer is the expected payer for the ED visit. To make coding uniform across all HCUP data sources, payer combines detailed categories into general groups:
For this Statistical Brief, when more than one payer is listed for a hospital discharge, the first-listed payer is used. Hospital region Region is one of the four regions defined by the U.S. Census Bureau:
Discharge status reflects the disposition of the patient at discharge from the hospital and includes the following six categories: routine (to home); transfer to another short-term hospital; other transfers (including skilled nursing facility, intermediate care, and another type of facility such as a nursing home); home healthcare; against medical advice (AMA); or died in the hospital. About HCUP The Healthcare Cost and Utilization Project (HCUP, pronounced "H-Cup") is a family of healthcare databases and related software tools and products developed through a Federal-State-Industry partnership and sponsored by the Agency for Healthcare Research and Quality (AHRQ). HCUP databases bring together the data collection efforts of State data organizations, hospital associations, and private data organizations (HCUP Partners) and the Federal government to create a national information resource of encounter-level healthcare data. HCUP includes the largest collection of longitudinal hospital care data in the United States, with all-payer, encounter-level information beginning in 1988. These databases enable research on a broad range of health policy issues, including cost and quality of health services, medical practice patterns, access to healthcare programs, and outcomes of treatments at the national, State, and local market levels. HCUP would not be possible without the contributions of the following data collection Partners from across the United States: Alaska State Hospital and Nursing Home Association Arizona Department of Health Services Arkansas Department of Health California Office of Statewide Health Planning and Development Colorado Hospital Association Connecticut Hospital Association District of Columbia Hospital Association Florida Agency for Health Care Administration Georgia Hospital Association Hawaii Health Information Corporation Illinois Department of Public Health Indiana Hospital Association Iowa Hospital Association Kansas Hospital Association Kentucky Cabinet for Health and Family Services Louisiana Department of Health and Hospitals Maine Health Data Organization Maryland Health Services Cost Review Commission Massachusetts Center for Health Information and Analysis Michigan Health & Hospital Association Minnesota Hospital Association Mississippi Department of Health Missouri Hospital Industry Data Institute Montana MHA - An Association of Montana Health Care Providers Nebraska Hospital Association Nevada Department of Health and Human Services New Hampshire Department of Health & Human Services New Jersey Department of Health New Mexico Department of Health New York State Department of Health North Carolina Department of Health and Human Services North Dakota (data provided by the Minnesota Hospital Association) Ohio Hospital Association Oklahoma State Department of Health Oregon Association of Hospitals and Health Systems Oregon Office of Health Analytics Pennsylvania Health Care Cost Containment Council Rhode Island Department of Health South Carolina Revenue and Fiscal Affairs Office South Dakota Association of Healthcare Organizations Tennessee Hospital Association Texas Department of State Health Services Utah Department of Health Vermont Association of Hospitals and Health Systems Virginia Health Information Washington State Department of Health West Virginia Health Care Authority Wisconsin Department of Health Services Wyoming Hospital Association About Statistical Briefs HCUP Statistical Briefs are descriptive summary reports presenting statistics on hospital inpatient and emergency department use and costs, quality of care, access to care, medical conditions, procedures, patient populations, and other topics. The reports use HCUP administrative healthcare data. About the NEDS The HCUP Nationwide Emergency Department Database (NEDS) is a unique and powerful database that yields national estimates of emergency department (ED) visits. The NEDS was constructed using records from both the HCUP State Emergency Department Databases (SEDD) and the State Inpatient Databases (SID). The SEDD capture information on ED visits that do not result in an admission (i.e., patients who were treated in the ED and then released from the ED to return home, or patients who were transferred to another hospital); the SID contain information on patients initially seen in the ED and then admitted to the same hospital. The NEDS was created to enable analyses of ED utilization patterns and support public health professionals, administrators, policymakers, and clinicians in their decision making regarding this critical source of care. The NEDS is produced annually beginning in 2006. Over time, the sampling frame for the NEDS has changed; thus, the number of States contributing to the NEDS varies from year to year. The NEDS is intended for national estimates only; no State-level estimates can be produced. For More Information For other information on mental health and substance abuse refer to the HCUP Statistical Briefs located at http://www.hcup-us.ahrq.gov/reports/statbriefs/sb_mhsa.jsp. For additional HCUP statistics, visit:
For a detailed description of HCUP and more information on the design of the Nationwide State Emergency Databases (NEDS), please refer to the following database documentation: Agency for Healthcare Research and Quality. Overview of the Nationwide Emergency Department Sample (NEDS). Healthcare Cost and Utilization Project (HCUP). Rockville, MD: Agency for Healthcare Research and Quality. Updated December 2016. http://www.hcup-us.ahrq.gov/nedsoverview.jsp. Accessed January 5, 2017. Suggested Citation Owens PL (AHRQ), Fingar KR (IBM Watson Health), Heslin KC (AHRQ), Mutter R (SAMHSA), Booth CL (SAMHSA). Emergency Department Visits Related to Suicidal Ideation, 2006-2013. HCUP Statistical Brief #220. January 2017. Agency for Healthcare Research and Quality, Rockville, MD. http://www.hcup-us.ahrq.gov/reports/statbriefs/sb220-Suicidal-Ideation-ED-Visits.pdf. Acknowledgments The authors would like to acknowledge the contributions of Minya Sheng of IBM Watson Health. *** AHRQ welcomes questions and comments from readers of this publication who are interested in obtaining more information about access, cost, use, financing, and quality of healthcare in the United States. We also invite you to tell us how you are using this Statistical Brief and other HCUP data and tools, and to share suggestions on how HCUP products might be enhanced to further meet your needs. Please e-mail us at hcup@ahrq.gov or send a letter to the address below:Sharon Arnold, Ph.D., Acting Director Center for Delivery, Organization, and Markets Agency for Healthcare Research and Quality 5600 Fishers Lane Rockville, MD 20857 This Statistical Brief was posted online on January 31, 2017. 1 The service is available to everyone. The National Suicide Prevention Lifeline is funded by the U.S. Department of Health and Human Services Substance Abuse and Mental Health Services Administration (DHHS / SAMHSA). 2 Centers for Disease Control and Prevention. 10 Leading Causes of Death by Age Group, United States - 2014. National Center for Injury Prevention and Control. http://www.cdc.gov/injury/images/lc-charts/leading_causes_of_death_age_group_2014_1050w760h.gif. Accessed October 5, 2016. 3 Ibid. 4 Tavernise S. U.S. Suicide Rate Surges to a 30-Year High. The New York Times. April 22, 2016. http://www.nytimes.com/2016/04/22/health/us-suicide-rate-surges-to-a-30-year-high.html. 5 Office of the Surgeon General (US); National Action Alliance for Suicide Prevention (US). 2012 National Strategy for Suicide Prevention: Goals and Objectives for Action: A Report of the U.S. Surgeon General and of the National Action Alliance for Suicide Prevention. Washington, DC: U.S. Department of Health & Human Services; September 2012. http://www.surgeongeneral.gov/library/reports/national-strategy-suicide-prevention/. Accessed October 31, 2016. 6 The Nielsen Company. Nielsen Demographics Data. https://www.claritas.com/. 7 Agency for Healthcare Research and Quality. HCUP Clinical Classifications Software (CCS). Healthcare Cost and Utilization Project (HCUP). Rockville, MD: Agency for Healthcare Research and Quality. Updated October 2016. http://www.hcup-us.ahrq.gov/toolssoftware/ccs/ccs.jsp. Accessed January 5, 2017. 8 Center for Disease Control and Prevention. Matrix of E-code Groupings, Table 1. Recommended Framework of E-code Groupings for Presenting Injury Mortality and Morbidity Data (August 10, 2011). http://www.cdc.gov/injury/wisqars/ecode_matrix.html. 9 Agency for Healthcare Research and Quality. HCUP Cost-to-Charge Ratio (CCR) Files. Healthcare Cost and Utilization Project (HCUP). 2001-2014. Rockville, MD: Agency for Healthcare Research and Quality. Updated November 2016. http://www.hcup-us.ahrq.gov/db/state/costtocharge.jsp. Accessed January 5, 2017. 10 U.S. Bureau of Economic Analysis. National Income and Product Account Tables, Table 1.1.4 Price Indexes for Gross Domestic Product. http://www.bea.gov/iTable/iTable.cfm?ReqID=9&step=1#reqid=9&step=1&isuri=1. Accessed January 5, 2017. 11 For additional information about the NHEA, see Centers for Medicare & Medicaid Services (CMS). National Health Expenditure Data. CMS website May 2014. http://www.cms.gov/Research-Statistics-Data-and-Systems/Statistics-Trends-and-Reports/NationalHealthExpendData/index.html?redirect=/NationalHealthExpendData/. Accessed January 5, 2017. 12 American Hospital Association. TrendWatch Chartbook, 2014. Table 4.2. Distribution of Inpatient vs. Outpatient Revenues, 1992-2012. Original source is no longer available on the Web; for related information refer to TrendWatch Chartbook, 2018. Table 4.2. Distribution of Inpatient vs. Outpatient Revenues, 1995-2016. www.aha.org/system/files/2018-05/2018-chartbook-table-4-2.pdf. |
| Internet Citation: Statistical Brief #220. Healthcare Cost and Utilization Project (HCUP). January 2017. Agency for Healthcare Research and Quality, Rockville, MD. www.hcup-us.ahrq.gov/reports/statbriefs/sb220-Suicidal-Ideation-ED-Visits.jsp?utm_source=ahrq&utm_medium=en1&utm_term=&utm_content=1&utm_campaign=ahrq_en2_28_2017. |
| Are you having problems viewing or printing pages on this website? |
| If you have comments, suggestions, and/or questions, please contact hcup@ahrq.gov. |
| Privacy Notice, Viewers & Players |
| Last modified 1/30/17 |