STATISTICAL BRIEF #214 |
November 2016
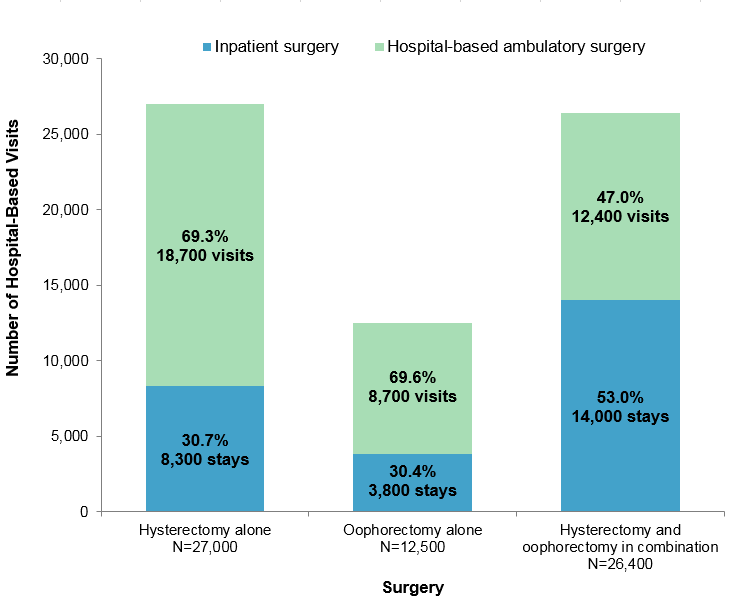
Brian J. Moore, Ph.D., Claudia A. Steiner, M.D., M.P.H., P. Hannah Davis, M.S., Carol Stocks, Ph.D., R.N., and Marguerite L. Barrett, M.S. Introduction Hysterectomy—removal of the uterus—is the second most common surgical procedure among women in the United States, with more than 265,000 hysterectomies performed annually in the inpatient setting.1 Recent research has shown a decrease in the overall rate of hysterectomies and a large increase in the proportion of hysterectomies performed in an outpatient setting.2,3 However, these studies were restricted to either commercially insured women without cancer or women receiving treatment for benign uterine fibroids. Oophorectomy is a surgical procedure that removes one or both ovaries. Nearly 200,000 oophorectomies are performed annually in the inpatient setting among women in the United States.4 Elective oophorectomy is routinely offered to older women at the time of hysterectomy to prevent the development of ovarian cancer.5 Similar patterns of decreasing overall rates of oophorectomy with increasing proportions performed in an outpatient setting have been identified among commercially insured women.6 This Healthcare Cost and Utilization Project (HCUP) Statistical Brief presents data on hysterectomies and oophorectomies among adult women using all-payer data in two hospital settings: hospital inpatient and hospital-based ambulatory surgery. The analysis is limited to adult women undergoing a hysterectomy, an oophorectomy, or both in combination in five States (Connecticut, Indiana, Kansas, Ohio, and South Carolina) for which hysterectomies and oophorectomies could be identified in both the inpatient and ambulatory surgery settings using International Classification of Diseases, 9th Revision, Clinical Modification (ICD-9-CM) codes.7 These five States represented 9.3 percent of the total U.S. population in 2013. In this Statistical Brief we provide an overview of patient and hospital characteristics for hysterectomies alone, oophorectomies alone, and surgeries when both procedures were performed during the same hospital-based visit—hysterectomy and oophorectomy surgeries "in combination." Trends from 2005 through 2013 in the rates of hysterectomies and oophorectomies, overall and by hospital setting (inpatient and ambulatory surgery), are presented. The distribution in 2013 of surgeries performed by related condition and by age is also provided. Findings Distribution of hospital-based hysterectomies and oophorectomies, 2013 Figure 1 presents the number of hospital-based visits for hysterectomy, oophorectomy, or both in combination, and the distribution by hospital setting—inpatient or ambulatory surgery—in five States in 2013. |
|
|
Figure 1. Number and distribution of hysterectomy and oophorectomy surgeries by hospital setting, in five States, 2013
Source: Agency for Healthcare Research and Quality (AHRQ), Center for Delivery, Organization, and Markets, Healthcare Cost and Utilization Project (HCUP), State Inpatient Databases (SID) and State Ambulatory Surgery and Services Databases (SASD) from five States (Connecticut, Indiana, Kansas, Ohio, and South Carolina), 2013 Stacked bar chart showing the distribution of hysterectomy and oophorectomy, alone and in combination, by hospital setting in 2013. Hysterectomy alone: total 27,000; inpatient, 8,300 stays, 30.7%; hospital-based ambulatory surgery, 18,700 visits, 69.3%. Oophorectomy alone: total 12,500; inpatient, 3,800 stays, 30.4%; hospital-based ambulatory surgery, 8,700 visits, 69.6%. Hysterectomy and oophorectomy combined: total 26,400; inpatient, 14,000 stays, 53.0%; hospital-based ambulatory surgery, 12,400 visits, 47.0%.
|
Patient and hospital characteristics related to hysterectomy and oophorectomy surgeries, 2013 Table 1 presents characteristics related to hysterectomy and oophorectomy surgeries comparing surgeries performed in the hospital inpatient setting with those performed in the hospital-based ambulatory surgery setting in 2013. |
| Table 1. Patient characteristics and outcomes related to hysterectomy and oophorectomy surgeries by setting, in five States, 2013 | ||||||
| Characteristics | Hysterectomy alone | Oophorectomy alone | Hysterectomy and oophorectomy in combination | |||
|---|---|---|---|---|---|---|
| Inpatient surgery | Hospital-based ambulatory surgery | Inpatient surgery | Hospital-based ambulatory surgery | Inpatient surgery | Hospital-based ambulatory surgery | |
| Patient characteristics | ||||||
| Age, mean years | 44.6 | 43.6 | 49.1 | 45.0 | 52.9 | 49.4 |
| Age, years, rate per 100,000 womena | ||||||
| 18-34 | 36.4 | 96.3 | 26.7 | 61.4 | 26.7 | 35.6 |
| 35-54 | 152.4 | 338.6 | 40.2 | 121.7 | 189.9 | 191.4 |
| 55+ | 26.0 | 50.3 | 31.4 | 43.9 | 128.7 | 83.5 |
| Race/ethnicity, rate per 100,000 womena | ||||||
| White | 58.0 | 155.1 | 31.2 | 76.2 | 118.4 | 113.4 |
| Black | 143.7 | 206.1 | 43.3 | 61.7 | 136.9 | 55.3 |
| Hispanic | 69.2 | 71.8 | 18.2 | 38.4 | 58.5 | 36.5 |
| Otherb | 46.6 | 73.8 | 20.3 | 50.8 | 85.6 | 54.3 |
| Expected primary payer, % | ||||||
| Medicare | 10.3 | 8.1 | 26.3 | 12.7 | 23.6 | 14.5 |
| Medicaid | 17.9 | 14.3 | 15.3 | 14.8 | 10.9 | 10.7 |
| Private insurance | 62.7 | 70.2 | 46.7 | 64.6 | 56.8 | 68.8 |
| Uninsured | 5.0 | 2.9 | 7.8 | 4.3 | 5.7 | 3.2 |
| Other | 4.1 | 4.4 | 3.9 | 3.5 | 3.0 | 2.9 |
| Outcomes of hospital stays | ||||||
| Inpatient length of stay, mean days | 2.3 | — | 4.7 | — | 3.2 | — |
| Total hospital charges, mean $c | 33,400 | 30,000 | 49,300 | 22,500 | 41,900 | 32,800 |
| a The denominator for rates is the age- and race-specific female resident population aged 18 years and older in the five States. b Other race/ethnicity includes Asian/Pacific Islander, American Indian, and Alaskan Native. c We report hospital charges rather than costs because Cost-to-Charge Ratios are not available for ambulatory surgery data. Source: Agency for Healthcare Research and Quality (AHRQ), Center for Delivery, Organization, and Markets, Healthcare Cost and Utilization Project (HCUP), State Inpatient Databases (SID) and State Ambulatory Surgery and Services Databases (SASD) from five States (Connecticut, Indiana, Kansas, Ohio, and South Carolina), 2013 | ||||||
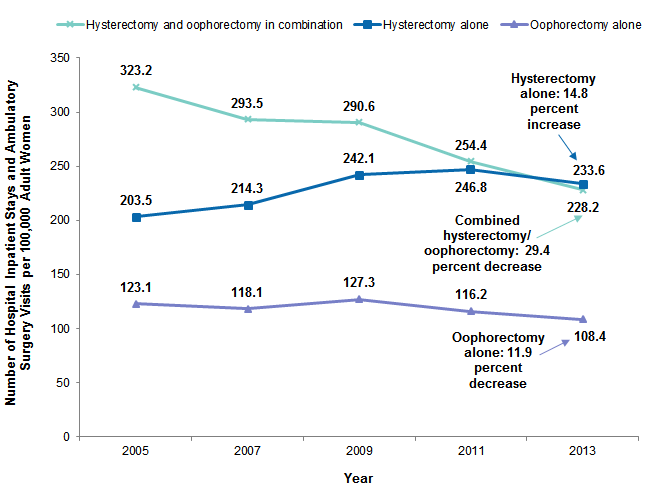
Trends in hospital-based hysterectomies and oophorectomies, 2005-2013 Figure 2 presents trends in the rates of hysterectomy and oophorectomy surgeries from 2005 through 2013 for inpatient and ambulatory surgery settings collectively. |
|
Figure 2. Rates of hysterectomy and oophorectomy surgeries, in five States, 2005-2013
Note: Inpatient and ambulatory surgery settings have been added together in this figure. Line graph showing the number of hysterectomy and oophorectomy surgeries, alone and in combination, per 100,000 adult women, 2005-2013. Combined hysterectomy and oophorectomy: 2005, 323.2; 2007, 293.5; 2009, 290.6; 2011, 254.4; 2013, 228.2—a 29.4% decrease. Oophorectomy alone: 2005, 123.1; 2007, 118,1; 2009, 127.3; 2011, 116.2; 2013, 108.4—a 11.9% decrease. Hysterectomy alone: 2005, 203.5; 2007, 214.3; 2009, 242.1; 2011, 246.8; 2013, 233.6—a 14.8% increase.
|
Table 2 breaks down trends from Figure 2 across the hospital inpatient and ambulatory surgery settings from 2005 through 2013. |
| Table 2. Rates of hysterectomy and oophorectomy surgeries by hospital setting, in five States, 2005-2013 | ||||||
| Characteristics | Hysterectomy alone | Oophorectomy alone | Hysterectomy and oophorectomy in combination | |||
|---|---|---|---|---|---|---|
| Inpatient surgery | Hospital-based ambulatory surgery | Inpatient surgery | Hospital-based ambulatory surgery | Inpatient surgery | Hospital-based ambulatory surgery | |
| Rate per 100,000 adult women | ||||||
| 2005 | 172.1 | 31.4 | 67.3 | 55.8 | 294.7 | 28.5 |
| 2007 | 158.7 | 55.6 | 58.2 | 60.0 | 253.9 | 39.6 |
| 2009 | 150.9 | 91.2 | 56.5 | 70.8 | 230.8 | 59.8 |
| 2011 | 110.3 | 136.6 | 41.9 | 74.2 | 167.5 | 87.0 |
| 2013 | 72.1 | 161.6 | 33.1 | 75.3 | 121.2 | 107.0 |
| Change in rate, % | ||||||
| 2005-2013 | -58.0 | 414.4 | -50.8 | 35.0 | -58.9 | 275.9 |
| Average annual change, % | -10.3 | 22.7 | -8.5 | 3.8 | -10.5 | 18.0 |
| Source: Agency for Healthcare Research and Quality (AHRQ), Center for Delivery, Organization, and Markets, Healthcare Cost and Utilization Project (HCUP), State Inpatient Databases (SID) and State Ambulatory Surgery and Services Databases (SASD) from five States (Connecticut, Indiana, Kansas, Ohio, and South Carolina), 2005, 2007, 2009, 2011, and 2013 | ||||||
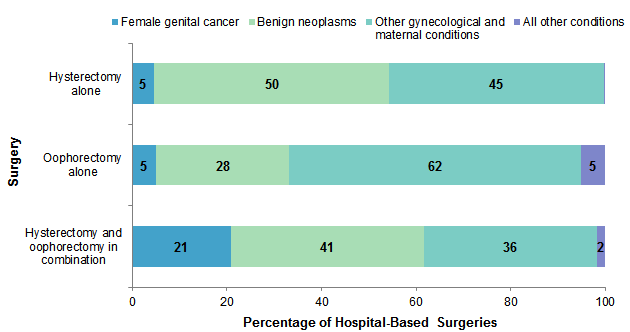
Conditions related to hysterectomy and oophorectomy, 2013 Hospital inpatient stays and hospital-based ambulatory surgery visits were grouped using the most frequent conditions related to the surgeries. Three related condition groups were defined on the basis of their association with hysterectomy and oophorectomy—female genital cancer, benign neoplasms (e.g., leiomyoma or uterine fibroids), and other gynecological and maternal conditions (e.g., endometriosis, menstrual disorders, menopausal disorders, ectopic pregnancy, prolapse of female genital organs).8 A fourth residual category comprised all other conditions, which included abdominal pain or hernia, diverticulosis, and other gastrointestinal disorders. Figure 3 presents the distribution of groups of conditions most frequently related to hysterectomy and oophorectomy in 2013. |
|
Figure 3. Percent distribution of groups of conditions most frequently related to hysterectomy and oophorectomy surgeries, in five States, 2013
Notes: Inpatient and ambulatory surgery settings have been added together in this figure. Surgeries are classified into related condition groups using all-listed diagnoses. Stacked bar chart showing the distribution of conditions frequently related to hysterectomy and oophorectomy surgeries, alone or in combination. Hysterectomy alone: female genital cancer, 5%; benign neoplasms, 50%; other gynecological and maternal conditions, 45%. Oophorectomy alone: female genital cancer, 5%; benign neoplasms, 28%; other gynecological and maternal conditions, 62%; all other conditions, 5%. Hysterectomy and oophorectomy in combination: female genital cancer, 21%; benign neoplasms, 41%; other gynecological and maternal conditions, 36%; all other conditions, 2%.
|
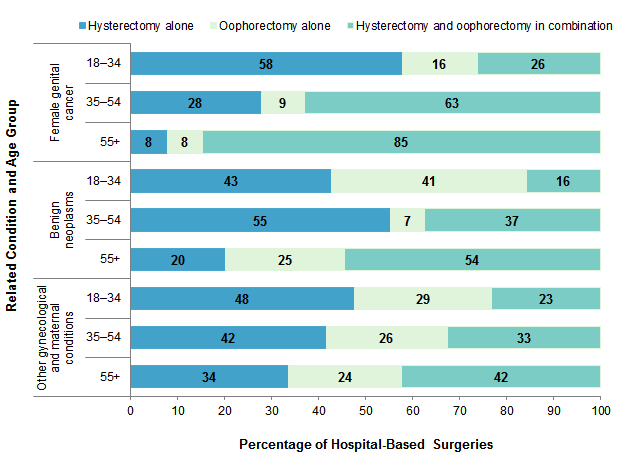
Figure 4 presents the distribution of hysterectomy and oophorectomy by related condition and age group in 2013. |
|
Figure 4. Percent distribution of hysterectomy and oophorectomy, alone and in combination, by related condition and patient age group, in five States, 2013
Notes: Inpatient and ambulatory surgery settings have been added together in this figure. Surgeries are classified into related condition groups using all-listed diagnoses. Stacked bar chart showing the distribution of hysterectomy and oophorectomy, alone and in combination, by related condition and age group. Female genital cancer: 18-34 years—58% hysterectomy alone; 16% oophorectomy alone; 26% hysterectomy and oophorectomy in combination; 35-54 years—28% hysterectomy alone; 9% oophorectomy alone; 63% hysterectomy and oophorectomy in combination; 55+ years—8% hysterectomy alone; 8% oophorectomy alone; 85% hysterectomy and oophorectomy in combination. Benign neoplasms: 18-34 years—43% hysterectomy alone; 41% oophorectomy alone; 16% hysterectomy and oophorectomy in combination; 35-54 years—55% hysterectomy alone; 7% oophorectomy alone; 37% hysterectomy and oophorectomy in combination; 55+ years—20% hysterectomy alone; 25% oophorectomy alone; 54% hysterectomy and oophorectomy in combination. Other gynecological and maternal conditions: 18-34 years—48% hysterectomy alone; 29% oophorectomy alone; 23% hysterectomy and oophorectomy in combination; 35-54 years—42% hysterectomy alone; 26% oophorectomy alone; 33% hysterectomy and oophorectomy in combination; 55+ years—34% hysterectomy alone; 24% oophorectomy alone; 42% hysterectomy and oophorectomy in combination.
|
Data Source The volumes and rates in this Statistical Brief are based upon data from the Healthcare Cost and Utilization Project (HCUP) 2013 State Inpatient Databases (SID) and State Ambulatory Surgery and Services Databases (SASD). This report evaluates inpatient and outpatient surgery data from five States that contributed to the 2013 SID and 2013 SASD: Connecticut, Indiana, Kansas, Ohio, and South Carolina. Historical data were drawn from the same five States in the 2005, 2007, 2009, and 2011 SID and SASD. Analysis was limited to hospitals within the five States that had cases in the inpatient and ambulatory surgery settings in each data year. States were included only if they provided complete outpatient procedure coding that would allow the identification of outpatient procedures by International Classification of Diseases, Ninth Revision, Clinical Modification (ICD-9-CM) procedure codes. Identification of these surgeries using Current Procedural Terminology (CPT®) procedure codes was not possible because of ambiguity in the reporting of oophorectomy procedures. Supplemental sources included population denominator data for use with HCUP databases, derived from information available from the Nielsen Company.9 Definitions Diagnoses, procedures, ICD-9-CM, and Clinical Classifications Software (CCS) The principal diagnosis is that condition established after study to be chiefly responsible for the patient's hospital inpatient stay or outpatient visit. Secondary diagnoses are concomitant conditions that coexist at the time of the admission or visit or that develop during the stay. All-listed procedures include all procedures performed during the hospital inpatient stay or outpatient visit, whether for definitive treatment or for diagnostic or exploratory purposes. The first-listed procedure is the procedure that is listed first on the discharge record. Inpatient data define this as the principal procedure—the procedure that is performed for definitive treatment rather than for diagnostic or exploratory purposes (i.e., the procedure that was necessary to take care of a complication). ICD-9-CM is the International Classification of Diseases, Ninth Revision, Clinical Modification, which assigns numeric codes to diagnoses and procedures. There are approximately 14,000 ICD-9-CM diagnosis codes. There are approximately 4,000 ICD-9-CM procedure codes. CCS categorizes ICD-9-CM diagnosis codes into a manageable number of clinically meaningful categories.10 This clinical grouper makes it easier to quickly understand patterns of diagnoses. CCS categories identified as Other typically are not reported; these categories include miscellaneous, otherwise unclassifiable diagnoses that may be difficult to interpret as a group. Case definition Hospital discharge and ambulatory surgery records with a hysterectomy or oophorectomy were defined based on all-listed procedure codes as identified using the CCS categories for ICD-9-CM procedures. The hysterectomy and oophorectomy in combination category required procedures from both CCS categories on the same hospital-based visit.
The related conditions for hospital visits presented in Figures 3 and 4 were defined on the basis of the ICD-9-CM and CCS diagnosis codes in Table 3. Each related condition was defined using all-listed diagnoses (i.e., the principal diagnosis and up to 24 secondary diagnoses). The assignment was based on a hierarchy that first looked for the presence of a female genital cancer diagnosis, then benign neoplasms, then other gynecological and maternal conditions, and finally all other conditions. |
| Table 3. ICD-9-CM and CCS diagnosis codes for defining related condition for hospital visit | |
| Related condition for hospital visit | Definition |
|---|---|
| Female genital cancer | Any ICD-9-CM diagnosis codes:
|
| Female genital cancer | Any ICD-9-CM diagnosis codes:
|
| Benign neoplasms | Any diagnosis for inpatient stays or ambulatory surgery visits with CCS diagnosis category:
|
| Other gynecological and maternal conditions | Any diagnosis for inpatient stays or ambulatory surgery visits with CCS diagnosis categories:
|
| All other conditions | All other diagnoses including but not limited to cancer of breast (CCS category 24), cancer of colon (CCS category 14), other gastrointestinal disorders (CCS category 155), abdominal pain (CCS category 251), and diverticulosis and diverticulitis (CCS category 146). |
| Abbreviations: CCS, Clinical Classifications Software; ICD-9-CM, International Classification of Diseases, Ninth Revision, Clinical Modification; OB, obstetric. | |
Types of hospitals included in HCUP State Inpatient Databases
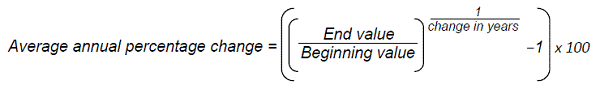
This analysis used State Inpatient Databases (SID) limited to data from community hospitals, which are defined as short-term, non-Federal, general, and other hospitals, excluding hospital units of other institutions (e.g., prisons). Community hospitals include obstetrics and gynecology, otolaryngology, orthopedic, cancer, pediatric, public, and academic medical hospitals. Excluded for this analysis are long-term care facilities such as rehabilitation, psychiatric, and alcoholism and chemical dependency hospitals. However, if a patient received long-term care, rehabilitation, or treatment for a psychiatric or chemical dependency condition in a community hospital, the discharge record for that stay was included in the analysis. The analysis was limited to hospitals that had at least one hysterectomy or oophorectomy performed in both the SID and the SASD in each data year. Types of hospitals included in HCUP State Ambulatory Surgery and Services Databases This analysis used State Ambulatory Surgery and Services Databases (SASD) limited to data from hospital-owned ambulatory surgery facilities. Although some SASD include data from facilities not owned by a hospital, those facilities were excluded from this analysis. The designation of a facility as hospital-owned is specific to its financial relationship with a hospital that provides inpatient care and is not related to its physical location. Ambulatory surgery performed in hospital-owned facilities may be performed within the hospital, in a facility attached to the hospital, or in a facility physically separated from the hospital. The analysis was further limited to ambulatory surgeries performed at facilities owned by community hospitals. Community hospitals are defined as short-term, non-Federal, general, and other specialty hospitals, excluding hospital units of other institutions (e.g., prisons). The analysis was limited to hospitals that had at least one hysterectomy or oophorectomy performed in both the SID and the SASD in each data year. Unit of analysis The unit of analysis is the hospital discharge (i.e., the hospital stay) for an inpatient stay or ambulatory surgery, not a person or patient. This means that a person who is admitted to the hospital to have surgery multiple times in 1 year will be counted each time as a separate discharge from the hospital. Average annual percentage change Average annual percentage change was calculated using the following formula:
Average annual percentage change equals open parenthesis, open parenthesis, end value divided by beginning value, close parenthesis, to the power of 1 divided by change in years, minus 1, close parenthesis, multiplied by 100.
Charges Charges represent what the hospital billed for the discharge. Hospital charges reflect the amount the hospital charged for the entire hospital stay and do not include professional (physician) fees. For the purposes of this Statistical Brief, charges are rounded to the nearest hundred dollars. Payer Payer is the expected payer for the hospital stay. To make coding uniform across all HCUP data sources, payer combines detailed categories into general groups:
For this Statistical Brief, when more than one payer is listed for a hospital discharge, the first-listed payer is used. Reporting of race and ethnicity Data on Hispanic ethnicity are collected differently among the States and also can differ from the Census methodology of collecting information on race (White, Black, Asian/Pacific Islander, American Indian/Alaska Native, Other (including mixed race)) separately from ethnicity (Hispanic, non-Hispanic). State data organizations often collect Hispanic ethnicity as one of several categories that include race. Therefore, for multistate analyses, HCUP creates the combined categorization of race and ethnicity for data from States that report ethnicity separately. When a State data organization collects Hispanic ethnicity separately from race, HCUP uses Hispanic ethnicity to override any other race category to create a Hispanic category for the uniformly coded race/ethnicity data element, while also retaining the original race and ethnicity data. All of the States included in the analyses for this Statistical Brief report Hispanic ethnicity. This Statistical Brief reports race/ethnicity for the following categories: Hispanic, non-Hispanic White, non-Hispanic Black, and non-Hispanic Other (includes non-Hispanic Asian/Pacific Islander and non-Hispanic American Indian/Alaska Native). About HCUP The Healthcare Cost and Utilization Project (HCUP, pronounced "H-Cup") is a family of healthcare databases and related software tools and products developed through a Federal-State-Industry partnership and sponsored by the Agency for Healthcare Research and Quality (AHRQ). HCUP databases bring together the data collection efforts of State data organizations, hospital associations, and private data organizations (HCUP Partners) and the Federal government to create a national information resource of encounter-level healthcare data. HCUP includes the largest collection of longitudinal hospital care data in the United States, with all-payer, encounter-level information beginning in 1988. These databases enable research on a broad range of health policy issues, including cost and quality of health services, medical practice patterns, access to healthcare programs, and outcomes of treatments at the national, State, and local market levels. HCUP would not be possible without the contributions of the following data collection Partners from across the United States: Alaska State Hospital and Nursing Home Association Arizona Department of Health Services Arkansas Department of Health California Office of Statewide Health Planning and Development Colorado Hospital Association Connecticut Hospital Association District of Columbia Hospital Association Florida Agency for Health Care Administration Georgia Hospital Association Hawaii Health Information Corporation Illinois Department of Public Health Indiana Hospital Association Iowa Hospital Association Kansas Hospital Association Kentucky Cabinet for Health and Family Services Louisiana Department of Health and Hospitals Maine Health Data Organization Maryland Health Services Cost Review Commission Massachusetts Center for Health Information and Analysis Michigan Health & Hospital Association Minnesota Hospital Association Mississippi Department of Health Missouri Hospital Industry Data Institute Montana MHA - An Association of Montana Health Care Providers Nebraska Hospital Association Nevada Department of Health and Human Services New Hampshire Department of Health & Human Services New Jersey Department of Health New Mexico Department of Health New York State Department of Health North Carolina Department of Health and Human Services North Dakota (data provided by the Minnesota Hospital Association) Ohio Hospital Association Oklahoma State Department of Health Oregon Association of Hospitals and Health Systems Oregon Office of Health Analytics Pennsylvania Health Care Cost Containment Council Rhode Island Department of Health South Carolina Revenue and Fiscal Affairs Office South Dakota Association of Healthcare Organizations Tennessee Hospital Association Texas Department of State Health Services Utah Department of Health Vermont Association of Hospitals and Health Systems Virginia Health Information Washington State Department of Health West Virginia Health Care Authority Wisconsin Department of Health Services Wyoming Hospital Association About Statistical Briefs HCUP Statistical Briefs are descriptive summary reports presenting statistics on hospital inpatient and emergency department use and costs, quality of care, access to care, medical conditions, procedures, patient populations, and other topics. The reports use HCUP administrative healthcare data. About the SID The HCUP State Inpatient Databases (SID) are hospital inpatient databases from data organizations participating in HCUP. The SID contain the universe of the inpatient discharge abstracts in the participating HCUP States, translated into a uniform format to facilitate multistate comparisons and analyses. Together, the SID encompass more than 95 percent of all U.S. community hospital discharges. The SID can be used to investigate questions unique to one State, to compare data from two or more States, to conduct market-area variation analyses, and to identify State-specific trends in inpatient care utilization, access, charges, and outcomes. About the SASD The HCUP State Ambulatory Surgery and Services Databases (SASD) include encounter-level data for ambulatory surgeries and may also include various types of outpatient services such as observation stays, lithotripsy, radiation therapy, imaging, chemotherapy, and labor and delivery. The specific types of ambulatory surgery and outpatient services included in each SASD vary by State and data year. All SASD include data from hospital-owned ambulatory surgery facilities. In addition, some States include data from facilities not owned by a hospital. The designation of a facility as hospital-owned is specific to its financial relationship with a hospital that provides inpatient care and is not related to its physical location. Hospital-owned ambulatory surgery and other outpatient care facilities may be contained within the hospital, physically attached to the hospital, or located in a different geographic area. This analysis was restricted to hospital-owned ambulatory surgery. For More Information For other information on women's health, including hysterectomies, refer to the HCUP Statistical Briefs located at http://www.hcup-us.ahrq.gov/reports/statbriefs/sb_womens.jsp. For additional HCUP statistics, visit:
For more information about HCUP, visit http://www.hcup-us.ahrq.gov/. For a detailed description of HCUP and more information on the design of the State Inpatient Databases (SID) and State Ambulatory Surgery and Services Databases (SASD), please refer to the following database documentation: Agency for Healthcare Research and Quality. Overview of the State Inpatient Databases (SID). Healthcare Cost and Utilization Project (HCUP). Rockville, MD: Agency for Healthcare Research and Quality. Updated January 2016. http://www.hcup-us.ahrq.gov/sidoverview.jsp. Accessed February 17, 2016. Agency for Healthcare Research and Quality. Overview of the State Ambulatory Surgery and Services Databases (SASD). Healthcare Cost and Utilization Project (HCUP). Rockville, MD: Agency for Healthcare Research and Quality. Updated November 2015. http://www.hcup-us.ahrq.gov/sasdoverview.jsp. Accessed February 17, 2016. Suggested Citation Moore BJ (Truven Health Analytics), Steiner CA (AHRQ), Davis PH (AHRQ), Stocks C (AHRQ), Barrett ML (M.L. Barrett, Inc.). Trends in Hysterectomies and Oophorectomies in Hospital Inpatient and Ambulatory Settings, 2005-2013. HCUP Statistical Brief #214. November 2016. Agency for Healthcare Research and Quality, Rockville, MD. http://www.hcup-us.ahrq.gov/reports/statbriefs/sb214-Hysterectomy-Oophorectomy-Trends.pdf. Acknowledgments The authors would like to acknowledge the contributions of Minya Sheng and Cary Rizor of Truven Health Analytics and Anne Casto of The Ohio State University. *** AHRQ welcomes questions and comments from readers of this publication who are interested in obtaining more information about access, cost, use, financing, and quality of healthcare in the United States. We also invite you to tell us how you are using this Statistical Brief and other HCUP data and tools, and to share suggestions on how HCUP products might be enhanced to further meet your needs. Please e-mail us at hcup@ahrq.gov or send a letter to the address below:David Knutson, Director Center for Delivery, Organization, and Markets Agency for Healthcare Research and Quality 5600 Fishers Lane Rockville, MD 20857 This Statistical Brief was posted online on November 29, 2016. 1 HCUPnet. Healthcare Cost and Utilization Project (HCUP). 2013. Agency for Healthcare Research and Quality, Rockville, MD. https://datatools.ahrq.gov/hcupnet. Accessed June 23, 2016. 2 Barrett ML, Weiss AJ, Stocks C, Steiner CA, Myers ER. Procedures to Treat Benign Uterine Fibroids in Hospital Inpatient and Hospital-Based Ambulatory Surgery Settings, 2013. HCUP Statistical Brief #200. January 2016. Agency for Healthcare Research and Quality, Rockville, MD. http://www.hcup-us.ahrq.gov/reports/statbriefs/sb200-Procedures-Treat-Uterine-Fibroids.pdf. Accessed October 17, 2016. 3 Doll KM, Dusetzina SB, Robinson W. Trends in inpatient and outpatient hysterectomy and oophorectomy rates among commercially insured women in the United States, 2000-2014. JAMA Surgery. 2016;151(9):876-7. 4 HCUPnet, 2013. Op. cit. 5 Jacoby VL, Grady D, Wactawski-Wende J, Manson JE, Allison MA, Kuppermann M, et al. Oophorectomy vs ovarian conservation with hysterectomy: cardiovascular disease, hip fracture, and cancer in the Women's Health Initiative Observational Study. Archives of Internal Medicine. 2011;171(8):760-8. 6 Doll KM et al., 2016. Op. cit. 7 Only ICD-9-CM procedure coding was used. Identification of these surgeries using Current Procedural Terminology (CPT®) procedure codes was not possible because of ambiguity in the reporting of oophorectomy procedures when a hysterectomy is performed. Some CPT codes for hysterectomy may or may not also include an oophorectomy. 8 For more details, see Case Definition Table 3 in the Definitions section. 9 Barrett M, Hickey K, Coffey R, Levit K. Population Denominator Data for Use with the HCUP Databases (Updated with 2014 Population Data). HCUP Methods Series Report #2015-07. September 1, 2015. U.S. Agency for Healthcare Research and Quality. http://hcup-us.ahrq.gov/reports/methods/2015-07.pdf. Accessed February 17, 2016. 10 Agency for Healthcare Research and Quality. HCUP Clinical Classifications Software (CCS). Healthcare Cost and Utilization Project (HCUP). Rockville, MD: Agency for Healthcare Research and Quality. Updated June 2015. http://www.hcup-us.ahrq.gov/toolssoftware/ccs/ccs.jsp. Accessed February 17, 2016. |
| Internet Citation: Statistical Brief #214. Healthcare Cost and Utilization Project (HCUP). November 2016. Agency for Healthcare Research and Quality, Rockville, MD. hcup-us.ahrq.gov/reports/statbriefs/sb214-Hysterectomy-Oophorectomy-Trends.jsp. |
| Are you having problems viewing or printing pages on this website? |
| If you have comments, suggestions, and/or questions, please contact hcup@ahrq.gov. |
| If you are experiencing issues related to Section 508 accessibility of information on this website, please contact hcup@ahrq.gov. |
| Privacy Notice, Viewers & Players |
| Last modified 11/18/16 |