STATISTICAL BRIEF #211 |
September 2016
Kamila Mistry, Ph.D., M.P.H., Kathryn R. Fingar, Ph.D., M.P.H., and Anne Elixhauser, Ph.D. Introduction Although the overall cesarean section (C-section) rate in the United States has declined slightly in recent years, nearly a third of all births continue to be delivered by C-section1—higher than in many other industrialized countries.2 A number of factors may contribute to high C-section rates, including medical conditions and complications that may necessitate the procedure, such as multiple gestations, older maternal age due to delayed childbearing, preterm labor, obesity, gestational diabetes, and hypertension.3 Other factors unrelated to medical indication may also influence the decision to perform a C-section, including hospital policies regarding elective deliveries and patient preference, as well as physician concerns regarding liability related to a poor obstetrical outcome.4,5,6 C-section is the most common surgical procedure performed in the United States.7 This operation carries additional risks compared with vaginal delivery, such as infection and postoperative pain.8,9 A C-section also may make it more difficult for the mother to establish breastfeeding and may complicate subsequent pregnancies.10,11 Given potential risks and associated costs—in 2011, the average cost of a hospital stay resulting in C-section was over 50 percent higher than a stay involving vaginal delivery12—reducing the C-section delivery rate continues to be an important focus of public health efforts nationwide, particularly for low-risk deliveries with no medical indication for the procedure.13 Consensus guidelines from the American Congress of Obstetricians and Gynecologists and other national efforts to improve perinatal care have shown promise in reducing nonmedically indicated C-sections.14 However, recent research has found wide variation in hospital C-section rates even for low-risk deliveries.15 This variation raises questions about the quality of maternal care and has important implications for maternal and neonatal outcomes and costs for hospitals, delivery systems, and insurers. This Healthcare Cost and Utilization Project (HCUP) Statistical Brief presents information on variation in the rate of total and low-risk C-sections across U.S. hospitals in 2013. It expands on previous studies in two significant ways—by using the State Inpatient Databases (SID) rather than the Nationwide Inpatient Sample (NIS) and by using a new definition of low-risk C-section developed by the Society of Maternal-Fetal Medicine in 2016, which is more clinically comprehensive than other prior definitions available from the Joint Commission and Agency for Healthcare Research and Quality.16 The SID are used because they contain data on a census, or near census, of hospitals in each State and include all discharges from each hospital, making it possible to generate accurate hospital-level statistics. Numbers presented here are not national estimates, but rather actual counts from all States included. This Statistical Brief builds on prior work that examined variations in C-sections by hospital bed size, teaching status, and geographic location using the NIS, from which 593 hospitals were used for analysis.17 In comparison, this Statistical Brief includes data from virtually all hospitals across 43 states and the District of Columbia—2,719 community, nonrehabilitation hospitals in total—accounting for about 95 percent of the U.S. population and deliveries nationwide. Although prior research excluded hospitals with fewer than 100 deliveries in order to ensure that the C-section rate across the sample was sufficiently stable,18 this analysis draws on data from all hospitals except those with 1-9 deliveries (n=51 hospitals) to allow for the inclusion of small hospitals with lower delivery volumes. Deliveries relate to the stay of the mother rather than the newborn. This Statistical Brief presents the rate of C-section per 100 total and low-risk deliveries among women aged 15-44 years. Variation in C-section rates is assessed by examining the distribution of C-section rates across hospitals. Data are presented on minimum and maximum values (i.e., outliers) and the mean C-section rate according to hospital delivery volume. The mean C-section rate is also examined by additional hospital characteristics. Differences of 10 percent or greater are noted in the text. Findings The rate of C-section among total and low-risk deliveries, 2013 Figure 1 displays the rate (per 100 deliveries) of vaginal deliveries and C-sections among total, low-risk, and non-low-risk childbirth stays at 2,719 hospitals in 43 States and the District of Columbia in 2013. |
|
|
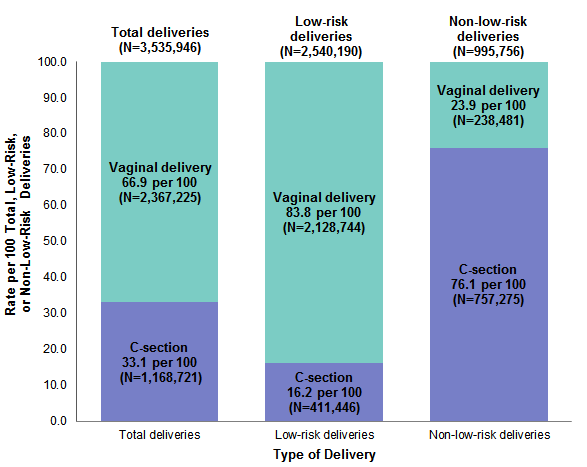
Figure 1. Rate of total, low-risk, and non-low-risk vaginal deliveries and C-sections in 43 States and the District of Columbia, 2013
Abbreviation: C-section, cesarean section Figure 1 is a stacked bar chart that shows the rate of total, low-risk, and non-low-risk vaginal deliveries and C-sections in 43 States and the District of Columbia in 2013. 3,535,946 total deliveries; 2,367,225 total vaginal deliveries, 66.9 per 100; 1,168,721 total C-section deliveries, 33.1 per 100. 2,540,190 total low-risk deliveries; 2,128,744 low-risk vaginal deliveries, 83.8 per 100; 411,446 low-risk C-sections, 16.2 per 100. 995,756 total non-low-risk deliveries; 238,481 non-low-risk vaginal deliveries, 23.9 per 100; 757,275 non-low-risk C-sections, 76.1 per 100.
|
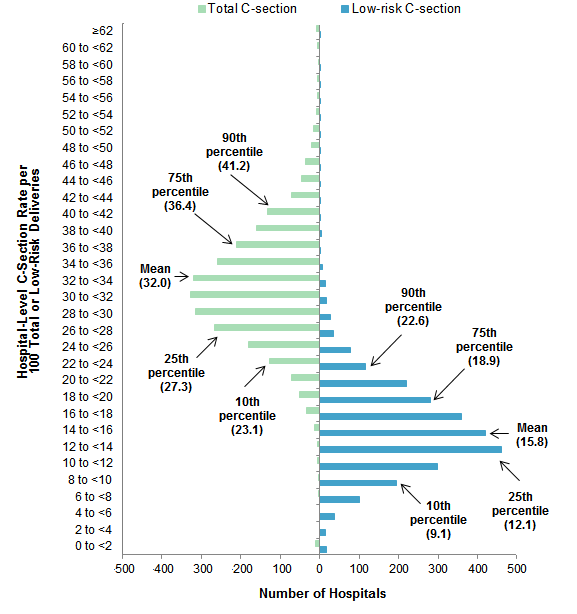
The remainder of this Statistical Brief focuses on hospital variation in the low-risk C-section rate, following the approach used in prior reports that present information on the low-risk C-section rate in the context of all C-sections.19, 20 For comparison, the total C-section rate also is presented. These results represent a hospital-level, not a discharge-level, analysis. The C-section rate was calculated for each hospital, and these hospital-level rates form the basis of the results presented. As a result, the mean hospital-level C-section rates (calculated across all hospitals) reported below differ slightly from those in Figure 1, which reports discharge-level C-section rates (calculated across all deliveries). Variation in the C-section rate across hospitals, 2013 Figure 2 displays the distribution of hospital-level C-section rates among total and low-risk deliveries. In addition to the mean, the 10th, 25th, 75th, and 90th percentiles are noted. |
|
Figure 2. Variation across hospitals in total and low-risk C-section rate in 43 States and the District of Columbia, 2013
Abbreviation: C-section, cesarean section Figure 2 is a bar chart that shows variation in hospital-level C-section rate per 100 total and low-risk deliveries in 2013. Rate per 100 for total C-sections: 90th percentile: 41.2; 75th percentile: 36.4; mean: 32.0; 25th percentile: 27.3; 10th percentile: 23.1. Rate per 100 for low-risk C-sections: 90th percentile: 22.6; 75th percentile: 18.9; mean: 15.8; 25th percentile: 12.1; 10th percentile: 9.1.
|
Table 1 presents statistics on the hospital-level C-section rate for total and low-risk deliveries in 2013, based on hospital delivery volume. |
| Table 1. C-section rate by volume of total and low-risk deliveries at the hospital in 43 States and the District of Columbia, 2013 | |||||
| Delivery type and characteristics | All hospitals | Delivery volume | |||
|---|---|---|---|---|---|
| 10-99 | 100-499 | 500-999 | >1,000 | ||
| Total hospitals | |||||
| Number of hospitals | 2,719 | 217 | 794 | 549 | 1,159 |
| Hospitals, % | 100.0 | 80 | 29.2 | 20.2 | 42.6 |
| Total deliveries | |||||
| Number of deliveries | 3,535,946 | 12,265 | 233,611 | 401,425 | 2,888,645 |
| Deliveries, % | 100.0 | 0.3 | 6.6 | 11.4 | 81.7 |
| Number of C-sections | 1,168,721 | 3,760 | 73,612 | 126,050 | 965,299 |
| C-sections, % | 100.0 | 0.3 | 6.3 | 10.8 | 82.6 |
| Total C-section rate per 100 deliveries | |||||
| Mean | 32.0 | 30.7 | 31.5 | 31.3 | 33.0 |
| Minimum | 0.0 | 0.0 | 0.0 | 0.0 | 15.4 |
| 10th percentile | 23.1 | 16.2 | 22.1 | 23.6 | 25.2 |
| 25th percentile | 27.3 | 23.1 | 26.3 | 27.1 | 28.8 |
| 50th percentile | 31.7 | 29.8 | 31.2 | 30.8 | 32.4 |
| 75th percentile | 36.4 | 38.1 | 35.8 | 35.0 | 37.1 |
| 90th percentile | 41.2 | 46.0 | 41.2 | 40.0 | 40.9 |
| Maximum | 100.0 | 100.0 | 77.2 | 60.0 | 63.5 |
| Low-risk deliveries | |||||
| Number of low-risk deliveries | 2,540,190 | 9,221 | 174,085 | 296,925 | 2,059,959 |
| Low-risk deliveries, % | 100.0 | 0.4 | 6.9 | 11.7 | 81.1 |
| Number of low-risk C-sections | 411,446 | 1,354 | 26,423 | 44,748 | 338,921 |
| Low-risk C-sections, % | 100.0 | 0.3 | 6.4 | 10.9 | 82.4 |
| Low-risk C-section rate per 100 deliveries | |||||
| Mean | 15.8 | 15.7 | 15.5 | 15.2 | 16.3 |
| Minimum | 0.0 | 0.0 | 0.0 | 0.0 | 4.6 |
| 10th percentile | 9.1 | 5.2 | 8.2 | 9.3 | 10.9 |
| 25th percentile | 12.1 | 9.2 | 11.3 | 11.7 | 13.0 |
| 50th percentile | 15.0 | 13.3 | 14.6 | 14.5 | 15.8 |
| 75th percentile | 18.9 | 20.0 | 18.7 | 18.1 | 19.2 |
| 90th percentile | 22.6 | 27.5 | 23.4 | 21.7 | 22.0 |
| Maximum | 100.0 | 100.0 | 58.8 | 38.4 | 46.9 |
| Abbreviation: C-section, cesarean section Source: Agency for Healthcare Research and Quality (AHRQ), Center for Delivery, Organization, and Markets, Healthcare Cost and Utilization Project (HCUP), State Inpatient Databases (SID), 43 States and the District of Columbia, 2013 | |||||
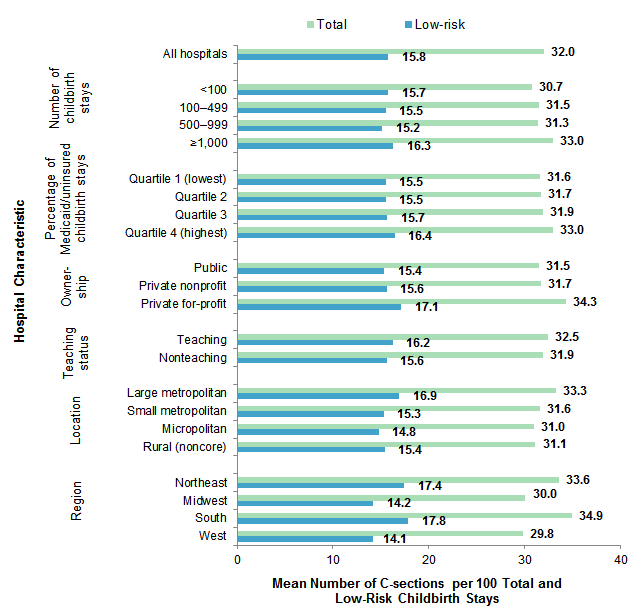
Figure 3 presents the mean hospital-level C-section rate per 100 total and low-risk deliveries in 2013, by hospital characteristics. |
|
Figure 3. Mean C-section rate for total and low-risk deliveries by hospital characteristics in 43 States and the District of Columbia, 2013
Abbreviation: C-section, cesarean section Figure 3 is a bar chart that shows the mean C-section rate for total and low-risk deliveries by hospital characteristics in 2013. All hospitals: total, 32.0; low-risk, 15.8. By number of childbirth stays: <100: total, 30.7; low-risk, 15.7; 100-499: total, 31.5; low-risk, 15.5; 500-999: total, 31.3; low-risk, 15.2; >1,000: total, 33.0; low-risk, 16.3. By percentage of Medicaid or uninsured childbirth stays: Quartile 1 (lowest): total, 31.6; low-risk, 15.5; Quartile 2: total, 31.7; low-risk, 15.5; Quartile 3: total, 31.9; low-risk, 15.7; Quartile 4 (highest): total, 33.0; low-risk, 16.4. By ownership: public: total, 31.5; low-risk, 15.4; private nonprofit: total, 31.7; low-risk, 15.6; private for-profit: total, 34.3; low-risk, 17.1. By teaching status: teaching: total, 32.5; low-risk, 16.2; nonteaching: total, 31.9; low-risk, 15.6. By location: large metropolitan: total, 33.3; low-risk, 16.9; small metropolitan: total, 31.6; low-risk, 15.3; micropolitan: total, 31.0; low-risk, 14.8; rural (noncore): total, 31.1; low-risk, 15.4. By region: Northeast: total, 33.6; low-risk, 17.4; Midwest: total, 30.0; low-risk, 14.2; South: total, 34.9; low-risk, 17.8; West: total, 29.8; low-risk, 14.1.
|
Data Source The estimates in this Statistical Brief are based upon data from the Healthcare Cost and Utilization Project (HCUP) 2013 State Inpatient Databases (SID) for 2,719 community nonrehabilitation hospitals with 10 or more hospital stays for childbirth in 43 States and the District of Columbia: Arkansas, Arizona, California, Colorado, Connecticut, Florida, Georgia, Hawaii, Iowa, Illinois, Indiana, Kansas, Kentucky, Louisiana, Massachusetts, Maryland, Michigan, Minnesota, Missouri, Montana, North Carolina, North Dakota, Nebraska, New Jersey, New Mexico, Nevada, New York, Ohio, Oklahoma, Oregon, Pennsylvania, Rhode Island, South Carolina, South Dakota, Tennessee, Texas, Utah, Virginia, Vermont, Washington, Wisconsin, West Virginia, Wyoming. Deliveries outside of hospitals included in the SID are not captured in this Statistical Brief (e.g., military hospitals, home births). Definitions Diagnoses, ICD-9-CM, diagnosis-related groups (DRGs) The principal diagnosis is that condition established after study to be chiefly responsible for the patient's admission to the hospital. Secondary diagnoses are concomitant conditions that coexist at the time of admission or develop during the stay. All-listed diagnoses include the principal diagnosis plus these additional secondary conditions. ICD-9-CM is the International Classification of Diseases, Ninth Revision, Clinical Modification, which assigns numeric codes to diagnoses. There are approximately 14,000 ICD-9-CM diagnosis codes. DRGs comprise a patient classification system that categorizes patients into groups that are clinically coherent and homogeneous with respect to resource use. DRGs group patients according to diagnosis, type of treatment (procedure), age, and other relevant criteria. Each hospital stay has one assigned DRG. Case definition For this report, the ICD-9-CM diagnosis codes and DRGs listed in Table 2 were used to identify maternal hospitalizations related to childbirth and to assess delivery method. Hospital stays for childbirth were categorized as low-risk and high-risk based on definitions laid out by Armstrong et al. (2016).21 |
| Table 2. Study inclusion criteria and codes used to define maternal deliveries, delivery method, and non-low-risk deliveries | |
| Maternal deliveries | DRG 370-375 (2004-September 2007) DRG 765-768, 774-775 (October 2007-2013) |
| C-section | DRG 370-371 (2004-September 2007) DRG 765-766 (October 2007-2013) |
| Non-low-risk deliveries | All-listed ICD-9-CM diagnosis codes: 042, 641.01, 641.11, 642.6, 642.60, 642.61, 642.62, 642.63, 644.2, 644.20, 644.21, 646, 646.0, 646.00, 646.01, 646.03, 648.51, 648.52, 648.53, 648.54, 648.6, 648.60, 648.61, 648.62, 648.63, 648.64, 651, 651.0, 651.00, 651.01, 651.03, 651.1, 651.10, 651.11, 651.13, 651.2, 651.20, 651.21, 651.23, 651.3, 651.30, 651.31, 651.33, 651.4, 651.40, 651.41, 651.43, 651.5, 651.50, 651.51, 651.53, 651.6, 651.60, 651.61, 651.63, 651.7, 651.70, 651.71, 651.73, 651.8, 651.80, 651.81, 651.83, 651.9, 651.90, 651.91, 651.93, 652.21, 652.31, 652.41, 652.6, 652.60, 652.61, 652.63, 652.70, 652.71, 653.6, 653.60, 653.61, 653.63, 653.71, 654.2, 654.20, 654.21, 654.23, 654.3, 654.30, 654.31, 654.32, 654.33, 654.34, 655.01, 656.4, 656.40, 656.41, 656.43, 660.3, 660.30, 660.31, 660.5, 660.50, 660.51, 660.53, 660.7, 660.70, 660.71, 660.73, 662.3, 662.30, 662.31, 662.33, 663, 663.0, 663.00, 663.01, 663.03, 663.5, 663.50, 663.51, 663.53, 665, 665.0, 665.00, 665.01, 665.03, 665.1, 665.10, 665.11, 665.12, 665.14, 669.6, 669.60, 669.61, 678.10, 678.11, 678.13, 761.5, V08, V27.1, V27.2, V27.3, V27.4, V27.5, V27.6, V27.7, V91.00, V91.01, V91.02, V91.03, V91.09, V91.10, V91.11, V91.12, V91.19, V91.20, V91.21, V91.22, V91.29, V91.90, V91.91, V91.92, V91.99 |
| Abbreviation: C-section, cesarean section | |
The results in this Statistical Brief may differ from two prior studies—one on low-risk C-sections22 and one on hospital variation in C-section rates23—because those prior studies used the Nationwide Inpatient Sample (NIS), which prior to 2012 was based on only a 20 percent sample of community nonrehabilitation hospitals from the SID. In comparison, this Statistical Brief is based on data from all community nonrehabilitation hospitals with 10 or more deliveries among women aged 15-44 years in the 2013 SID, which constitute approximately 95 percent of all deliveries in U.S. hospitals.
Unit of analysis The unit of analysis is the hospital. The number of deliveries at a given hospital is based on the number of hospital discharges (i.e., hospital stays), not persons or patients. This means that a person who is admitted to the hospital multiple times in 1 year will be counted each time as a separate discharge from the hospital. Hospital location Hospital location is based on the 2003 Urban Influence Codes:
Payer Payer is the expected payer for the hospital stay. To make coding uniform across all HCUP data sources, payer combines detailed categories into general groups:
Hospital stays billed to the State Children's Health Insurance Program (SCHIP) may be classified as Medicaid, Private Insurance, or Other, depending on the structure of the State program. Because most State data do not identify patients in SCHIP specifically, it is not possible to present this information separately. For this Statistical Brief, when more than one payer is listed for a hospital discharge, the first-listed payer is used. Ownership The hospital's ownership/control category was obtained from the American Hospital Association (AHA) Annual Survey of Hospitals and includes categories for government non-Federal (public), private not-for-profit (voluntary), and private investor-owned (proprietary). Teaching status The hospital's teaching status was obtained from the AHA Annual Survey of Hospitals. A hospital is considered to be a teaching hospital if it has an American Medical Association-approved residency program, is a member of the Council of Teaching Hospitals, or has a ratio of full-time equivalent interns and residents to beds of 0.25 or higher. Region Region is one of the four regions defined by the U.S. Census Bureau:
About HCUP The Healthcare Cost and Utilization Project (HCUP, pronounced "H-Cup") is a family of healthcare databases and related software tools and products developed through a Federal-State-Industry partnership and sponsored by the Agency for Healthcare Research and Quality (AHRQ). HCUP databases bring together the data collection efforts of State data organizations, hospital associations, and private data organizations (HCUP Partners) and the Federal government to create a national information resource of encounter-level healthcare data. HCUP includes the largest collection of longitudinal hospital care data in the United States, with all-payer, encounter-level information beginning in 1988. These databases enable research on a broad range of health policy issues, including cost and quality of health services, medical practice patterns, access to healthcare programs, and outcomes of treatments at the national, State, and local market levels. HCUP would not be possible without the contributions of the following data collection Partners from across the United States: Alaska State Hospital and Nursing Home Association Arizona Department of Health Services Arkansas Department of Health California Office of Statewide Health Planning and Development Colorado Hospital Association Connecticut Hospital Association District of Columbia Hospital Association Florida Agency for Health Care Administration Georgia Hospital Association Hawaii Health Information Corporation Illinois Department of Public Health Indiana Hospital Association Iowa Hospital Association Kansas Hospital Association Kentucky Cabinet for Health and Family Services Louisiana Department of Health and Hospitals Maine Health Data Organization Maryland Health Services Cost Review Commission Massachusetts Center for Health Information and Analysis Michigan Health & Hospital Association Minnesota Hospital Association Mississippi Department of Health Missouri Hospital Industry Data Institute Montana MHA - An Association of Montana Health Care Providers Nebraska Hospital Association Nevada Department of Health and Human Services New Hampshire Department of Health & Human Services New Jersey Department of Health New Mexico Department of Health New York State Department of Health North Carolina Department of Health and Human Services North Dakota (data provided by the Minnesota Hospital Association) Ohio Hospital Association Oklahoma State Department of Health Oregon Association of Hospitals and Health Systems Oregon Office of Health Analytics Pennsylvania Health Care Cost Containment Council Rhode Island Department of Health South Carolina Revenue and Fiscal Affairs Office South Dakota Association of Healthcare Organizations Tennessee Hospital Association Texas Department of State Health Services Utah Department of Health Vermont Association of Hospitals and Health Systems Virginia Health Information Washington State Department of Health West Virginia Health Care Authority Wisconsin Department of Health Services Wyoming Hospital Association About Statistical Briefs HCUP Statistical Briefs are descriptive summary reports presenting statistics on hospital inpatient and emergency department use and costs, quality of care, access to care, medical conditions, procedures, patient populations, and other topics. The reports use HCUP administrative healthcare data. About the SID The HCUP State Inpatient Databases (SID) are hospital inpatient databases from data organizations participating in HCUP. The SID contain the universe of the inpatient discharge abstracts in the participating HCUP States, translated into a uniform format to facilitate multistate comparisons and analyses. Together, the SID encompass more than 95 percent of all U.S. community hospital discharges. The SID can be used to investigate questions unique to one State, to compare data from two or more States, to conduct market-area variation analyses, and to identify State-specific trends in inpatient care utilization, access, charges, and outcomes. For More Information For other information on pregnancy and childbirth, including Cesarean section, refer to the HCUP Statistical Briefs located at http://www.hcup-us.ahrq.gov/reports/statbriefs/sb_pregnancy.jsp. For additional HCUP statistics, visit:
For more information about HCUP, visit http://www.hcup-us.ahrq.gov/. For a detailed description of HCUP and more information on the design of the State Inpatient Database (SID), please refer to the following database documentation: Agency for Healthcare Research and Quality. Overview of the State Inpatient Databases (SID). Healthcare Cost and Utilization Project (HCUP). Rockville, MD: Agency for Healthcare Research and Quality. Updated November 2014. http://www.hcup-us.ahrq.gov/sidoverview.jsp. Accessed January 7, 2015. Suggested Citation Mistry K (AHRQ), Fingar KR (Truven), Elixhauser A (AHRQ). Variation in the Rate of Cesarean Section Across U.S. Hospitals, 2013. HCUP Statistical Brief #211. September 2016. Agency for Healthcare Research and Quality, Rockville, MD. http://www.hcup-us.ahrq.gov/reports/statbriefs/sb211-Hospital-Variation-C-sections-2013.pdf Acknowledgments The authors would like to acknowledge the contributions of Nils Nordstrand and Minya Sheng of Truven Health Analytics. *** AHRQ welcomes questions and comments from readers of this publication who are interested in obtaining more information about access, cost, use, financing, and quality of healthcare in the United States. We also invite you to tell us how you are using this Statistical Brief and other HCUP data and tools, and to share suggestions on how HCUP products might be enhanced to further meet your needs. Please e-mail us at hcup@ahrq.gov or send a letter to the address below:David Knutson, Director Center for Delivery, Organization, and Markets Agency for Healthcare Research and Quality 5600 Fishers Lane Rockville, MD 20857 This Statistical Brief was posted online on September 27, 2016. 1 Osterman MJK, Martin JA. Trends in low-risk cesarean delivery in the United States, 1990-2013. National Vital Statistics Reports. 2014;63(6):1-15. 2 Xie RH, Gaudet L, Krewski D, Graham ID, Walker MC, Wen SW. Higher cesarean delivery rates are associated with higher infant mortality rates in industrialized countries. Birth. 2015 Mar;42(1):62-9. 3 Declercq E, Menacker F, MacDorman M. Maternal risk profiles and the primary cesarean rate in the United States, 1991-2002. American Journal of Public Health. 2006;96(5):867-2. 4 Main E, Oshiro B, Chagolla B, Bingham D, Dang-Kilduff L, Kowalewski L. Elimination of Non-Medically Indicated (Elective) Deliveries Before 39 Weeks Gestational Age. Developed under contract #08-85012 with the California Department of Public Health, Maternal, Child and Adolescent Health Division. First edition published by March of Dimes; July 2010. 5 The American College of Obstetricians and Gynecologists Womens Health Care Physicians. ACOG committee opinion no. 559: cesarean delivery on maternal request. Obstetrics & Gynecology. 2013;121(4):904-7. 6 Sakala C, Yang YT, Corry MP. Maternity care and liability: pressing problems, substantive solutions. Women's Health Issues. 2013;23(1):e7-13. 7 Podulka J, Stranges E, Steiner C. Hospitalizations Related to Childbirth, 2008. HCUP Statistical Brief #110. April 2011. Agency for Healthcare Research and Quality, Rockville, MD.http://www.hcup-us.ahrq.gov/reports/statbriefs/sb110.pdf. Accessed August 29, 2016. 8 Burrows LJ, Meyn LA, Weber AM. Maternal morbidity associated with vaginal versus cesarean delivery. Obstetrics & Gynecology. 2004;103(5 Pt 1):907-12. 9 Ecker JL, Frigoletto FD. Cesarean delivery and the risk-benefit calculus. New England Journal of Medicine. 2007;356:885-8 10 Ecker JL, Frigoletto FD. Cesarean delivery and the risk-benefit calculus. New England Journal of Medicine. 2007;356:885-8. 11 Hobbs AJ, Mannion CA, McDonald SW, Brockway M, Tough SC. The impact of caesarean section on breastfeeding initiation, duration and difficulties in the first four months postpartum. BMC Pregnancy and Childbirth. 2016;16(1):90. 12 Moore JE, Witt WP, Elixhauser A. Complicating Conditions Associated With Childbirth, by Delivery Method and Payer, 2011. HCUP Statistical Brief #173. May 2014. Agency for Healthcare Research and Quality, Rockville, MD. http://www.hcup-us.ahrq.gov/reports/statbriefs/sb173-Childbirth-Delivery-Complications.pdf. Accessed August 29, 2016. 13 U.S. Department of Health and Human Services, Office of Disease Prevention and Health Promotion. Healthy People 2020. Maternal, Infant, and Child Health. https://www.healthypeople.gov/2020/topics-objectives/topic/maternal-infant-and-child-health/objectives. 14 American College of Obstetricians and Gynecologists, the Society for Maternal-Fetal Medicine, Caughey AB, Cahil AG, Guise J-M, Rouse DJ. ACOG/SMFM Obstetric Care Consensus: Safe prevention of the primary cesarean delivery. Obstetrics & Gynecology 2014;210(3):179-93. 15 Kozhimannil KB, Law MR, Virnig BA: Cesarean delivery rates vary tenfold among US hospitals; reducing variation may address quality and cost issues. Health Affairs (Milwood). 2013;32(3):527-35. 16 Armstrong JC, Kozhimannil KB, McDermott P, Saade GR, Srinivas SK, Society for Maternal-Fetal Medicine Health Policy Committee. Comparing variation in hospital rates of cesarean delivery among low-risk women using 3 different measures. American Journal of Obstetrics & Gynecology. 2016;214(2):153-63. 17 Kozhimannil KB, et al. 2013. Op cit. 18 Ibid. 19 Kozhimannil KB, Law MR, Virnig BA. Cesarean delivery rates vary tenfold among US hospitals; reducing variation may address quality and cost issues. Health Affairs (Milwood). 2013;2(3):527-35. 20 Osterman MJK, Martin JA. Trends in low-risk cesarean delivery in the United States, 1990-2013. National Vital Statistics Reports. 2014;63(6):1-15. 21 Armstrong JC, Kozhimannil KB, McDermott P, Saade GR, Srinivas SK. Society for Maternal-Fetal Medicine Health Policy Committee. Comparing variation in hospital rates of cesarean delivery among low-risk women using 3 different measures. American Journal of Obstetrics & Gynecology. 2016;214(2):153-63. 22 Armstrong JC, Kozhimannil KB, McDermott P, Saade GR, Srinivas SK. Society for Maternal-Fetal Medicine Health Policy Committee. Comparing variation in hospital rates of cesarean delivery among low-risk women using 3 different measures. American Journal of Obstetrics & Gynecology. 2016;214(2):153-63. 23 Kozhimannil KB, Law MR, Virnig BA. Cesarean delivery rates vary 10-fold among US hospitals; reducing variation may address quality, cost issues. Health Affairs (Millwood). 2013;32(3):527-35. |
| Internet Citation: Statistical Brief #211. Healthcare Cost and Utilization Project (HCUP). September 2016. Agency for Healthcare Research and Quality, Rockville, MD. hcup-us.ahrq.gov/reports/statbriefs/sb211-Hospital-Variation-C-sections-2013.jsp. |
| Are you having problems viewing or printing pages on this website? |
| If you have comments, suggestions, and/or questions, please contact hcup@ahrq.gov. |
| If you are experiencing issues related to Section 508 accessibility of information on this website, please contact hcup@ahrq.gov. |
| Privacy Notice, Viewers & Players |
| Last modified 9/23/16 |