STATISTICAL BRIEF #203 |
April 2016
Aitalohi Amaize, M.P.H., B.S.N., R.N., C.E.N., and Kamila B. Mistry, Ph.D., M.P.H. Introduction Diabetes is an important public health concern in the United States, affecting an estimated 29.1 million people, or 9.3 percent of the population.1 Among children and young adults, diabetes is one of the most common chronic diseases, and prevalence increases with age. Recent data estimate that 208,000 people under the age of 20 years have a diagnosis of diabetes.1 In 2011, of adults newly diagnosed with diabetes, 4.3 percent were aged 18-29 years.2 In both children and adults, diabetes is optimally managed in the outpatient setting. However, the emergency department (ED) represents a point of healthcare access for those with acute symptoms related to chronic conditions. A large number of ED visits are nonurgent and potentially preventable with optimal access to quality primary care.3 Patients presenting to the ED can be treated and released or admitted to the hospital. Undetected or poorly controlled diabetes can lead to increased ED utilization and subsequent hospitalization due to serious complications (including cardiovascular disease, kidney damage, blindness, and lower-limb amputations due to peripheral vascular disease). In adults, diabetes and related complications account for around $176 billion in direct medical costs, which is 2.3 times higher than medical costs of adults without diabetes.1 Data have shown significant increases in diabetes-related hospitalizations in young adults aged 20-29 years.4 This Healthcare Cost and Utilization Project (HCUP) Statistical Brief presents 2012 data on diabetes-related ED visits among children and young adults aged 0-29 years. Variations in overall ED visits, treat-and-release ED visits, and ED visits resulting in hospital admission are presented by demographic, regional, and payer characteristics, and diagnostic-specific differences are also presented. All differences between estimates noted in the text are statistically significant at the .05 level or better. Findings Overall diabetes-related ED visits in children and young adults, 2012 Table 1 presents characteristics of children and young adults with diabetes who were seen in the ED in 2012. Children and young adults accounted for over 587,000 diabetes-related ED visits (defined as having a diabetes diagnosis listed in the patient's discharge record). |
|
| Table 1. Diabetes-relateda emergency department visits for children and young adults aged 0-29 years, by patient and hospital characteristics and expected primary payer, 2012 | ||||
| Characteristic | All diabetes-related ED visits | |||
|---|---|---|---|---|
| n | % | Rate per 100,000 population | ||
| Overall total | 587,300 | 100 | 464.5 | |
| Patient characteristics | ||||
| Age group, years | <5 | 9,500 | 1.6 | 47.3 |
| 6-9 | 15,500 | 2.6 | 95.1 | |
| 10-13 | 31,800 | 5.4 | 192.6 | |
| 14-17 | 52,900 | 9.0 | 316.5 | |
| 18-21 | 108,800 | 18.5 | 606.6 | |
| 22-25 | 157,200 | 26.8 | 888.8 | |
| 26-29 | 211,500 | 36.0 | 1,235.6 | |
| Sex | Male | 219,800 | 37.4 | 355.2 |
| Female | 367,500 | 62.6 | 569.1 | |
| Community-Level income | 1st quartile (lowest) | 222,500 | 38.5 | 278.0 |
| 2nd quartile | 158,200 | 27.4 | 211.7 | |
| 3rd quartile | 121,600 | 21.0 | 155.4 | |
| 4th quartile (highest) | 75,500 | 13.1 | 94.3 | |
| Patient residence | Large metropolitan | 278,500 | 47.6 | 165.5 |
| Medium and small metropolitan | 201,800 | 34.5 | 213.6 | |
| Micropolitan | 70,600 | 12.1 | 227.0 | |
| Rural | 34,400 | 5.9 | 169.2 | |
| Hospital characteristics | ||||
| Hospital region | Northeast | 83,200 | 14.2 | 149.2 |
| Midwest | 149,200 | 25.4 | 221.7 | |
| South | 246,800 | 42.0 | 210.5 | |
| West | 107,900 | 18.4 | 146.8 | |
| Insurance | ||||
| Expected primary payerb | Medicaid | 234,000 | 40.0 | - |
| Private insurance | 156,600 | 26.7 | - | |
| Uninsured | 118,400 | 20.2 | - | |
| Other (including Medicare) | 76,800 | 13.1 | - | |
| Abbreviation: ED, emergency department aDiabetes mellitus is listed as a diagnosis on the discharge record. bPopulation-level rates for expected primary payer are not calculated because available population denominators related to this measure (using the Current Population Survey) capture the health insurance coverage of the population (where a respondent can have multiple types of coverage). Because the categories for expected primary payer are mutually exclusive in HCUP, they cannot be reliably translated to insurance coverage data. Source: Agency for Healthcare Research and Quality (AHRQ), Center for Delivery, Organization, and Markets, Healthcare Cost and Utilization Project (HCUP), Nationwide Emergency Department Sample (NEDS), 2012 | ||||
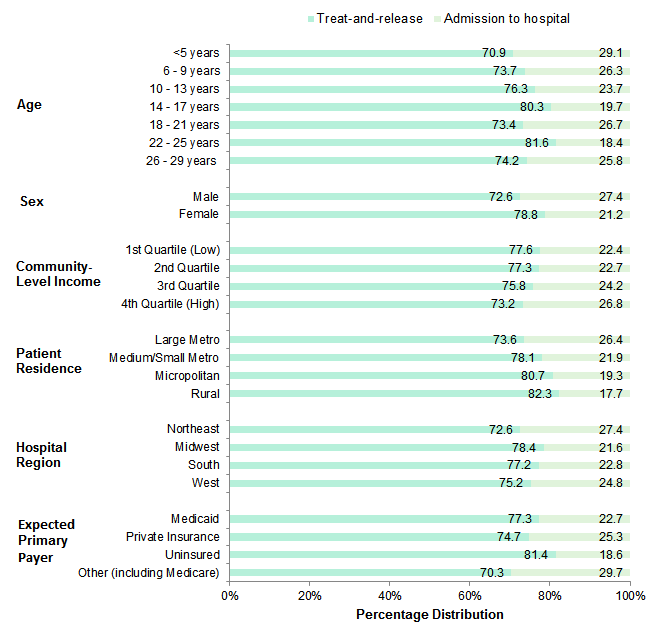
Figure 1 presents the percentage distribution of diabetes-related ED visits resulting in treatment and release compared with visits that resulted in admission to the same hospital. Overall, among diabetes-related ED visits for children and young adults, most resulted in treatment and release (76.5 percent) and the remaining visits (23.5 percent) resulted in admission to the same hospital (data not shown). |
|
Figure 1. Treatment and release versus admission to hospitala for diabetes-relatedb emergency department visits for children and young adults aged 0-29 years by patient and hospital characteristics and expected primary payer, 2012
aEmergency department visits transferred to another facility are included in the treat-and-release category. Figure 1 is a horizontal stacked bar chart that shows the percentage of visits to the emergency department for diabetes-related conditions that resulted in treatment and release versus admission to the hospital for children and young adults aged 0-29 years by patient and hospital characteristics and expected primary payer in 2012. Data show the percentage of treat-and-release visits versus visits admitted to the hospital. Data are divided into age groups: ages younger than 5 years: 70.9%, 29.1%; ages 6-9 years: 73.7%, 26.3%; ages 10-13 years: 76.3%, 23.7%; ages 14-17 years: 80.3%, 19.7%; ages 18-21 years: 73.4%, 26.7%; ages 22-25 years: 81.6%, 18.4%; ages 26-29 years: 74.2%, 25.8%. Data are divided by sex: males: 72.6%, 27.4%; females: 78.8%, 21.2%. Data are divided by community-level income: first (lowest) quartile: 77.6%, 22.4%; second quartile: 77.3%, 22.7%; third quartile, 75.8%, 24.2%; fourth (highest) quartile: 73.2%, 26.8%. Data are divided by patient residence: large metropolitan areas: 73.6%, 26.4%; medium and small metropolitan areas: 78.1%, 21.9%; micropolitan areas: 80.7%, 19.3%; rural areas: 82.3%, 17.7%. Data are divided by hospital region: Northeast: 72.6%, 27.4%; Midwest: 78.4%, 21.6%; South: 77.2%; 22.8%; West: 75.2%, 24.8%. Data are divided by expected primary payer: Medicaid: 77.3%, 22.7%; private insurance: 74.7%, 25.3%; uninsured: 81.4%, 18.6%; other insurance, including Medicare: 70.3%, 29.7%.
|
Table 2 presents the percentage distribution of various diagnoses related to diabetic complications and disease control for ED visits among children and young adults. The distribution of ED visits resulting in treatment and release or hospital admission also is shown. |
| Table 2. All-listed diabetes-relateda diagnoses for ED visitb among children and young adults aged 0-29 years by diabetes control and diabetic complications, 2012 | |||||
| All-listed diabetes condition (ICD-9-CM code 250.XX) | All diabetes-related ED visits | Diabetes-related ED visits: treat-and-release | Diabetes-related ED visits: admitted to the hospital | ||
|---|---|---|---|---|---|
| n | % distribution | % distribution | % distribution | ||
| Not stated as uncontrolled | No mention of complications | 418,500 | 71.1 | 90.4 | 9.6 |
| With complications | 49,200 | 8.4 | 71.6 | 28.4 | |
| Uncontrolled | No mention of complications | 27,500 | 4.7 | 55.5 | 44.5 |
| With complications | 93,400 | 15.9 | 22.8 | 77.2 | |
| Abbreviations: ED, emergency department; ICD-9-CM, International Classification of Diseases, Ninth Revision, Clinical Modification Note: Due to rounding error, the sum total of diabetes-related visits differs from the overall total reported in Table 1. aDiabetes mellitus appears as a diagnosis on the discharge record. bED visits transferred to another facility are included in the treat-and-release category. Source: Agency for Healthcare Research and Quality (AHRQ), Center for Delivery, Organization, and Markets, Healthcare Cost and Utilization Project (HCUP), Nationwide Emergency Department Sample (NEDS), 2012 | |||||
Table 3 presents different types of complications among diabetes-related ED visits. In children and young adults, diabetes usually is early in its progression and rarely presents with complications involving the eyes, kidneys, and peripheral circulation, as often noted with older adults. Instead, children and young adults present to the ED for care when they develop signs and symptoms associated with prediabetes or initial presentation of diabetes. Those who already have been diagnosed with diabetes seek care for acute complications due to poor disease management. |
| Table 3. Types of diabetes-relateda complications (all-listed) for emergency department visits among children and young adults aged 0-29 years, 2012 | ||||
| All-listed diabetes-related complicationsa (ICD-9-CM code 250.XX) | Uncontrolled diabetes | Diabetes, not stated as uncontrolled | ||
|---|---|---|---|---|
| n | % distribution | n | % distribution | |
| Acute complications | 79,900 | 73.7 | 7,700 | 14.9 |
| Ketoacidosis | 77,900 | 71.9 | 6,500 | 12.7 |
| Hyperosmolarity and other coma | 2,000 | 1.8 | 1,200 | 2.3 |
| Other specified and unspecified complications | 9,500 | 8.8 | 26,800 | 52.2 |
| Neurological manifestation | 13,300 | 12.3 | 10,800 | 21.1 |
| Renal, ophthalmic, and peripheral circulatory manifestations | 5,700 | 5.3 | 6,000 | 11.7 |
| Abbreviations: ED, emergency department; ICD-9-CM, International Classification of Diseases, Ninth Revision, Clinical Modification Note: Patients seen in the ED may not have diabetes complications documented in their discharge record if the information on complication status was not collected during the visit. These proportions reflect only those ED visits with complications recorded in the discharge record and do not suggest that patients with no mention of complications have no complications. a Diabetes mellitus appears as a diagnosis on the discharge record. b Not mutually exclusive (i.e., visits may involve more than one complication) Source: Agency for Healthcare Research and Quality (AHRQ), Center for Delivery, Organization, and Markets, Healthcare Cost and Utilization Project (HCUP), Nationwide Emergency Department Sample (NEDS), 2012 | ||||
Children and young adults can present to the ED for conditions unrelated to diabetes, particularly if they have not been previously diagnosed or if they are early in the progression of disease. Table 4 presents the most frequent first-listed conditions for ED visits in which diabetes (as defined using the ICD-9-CM) is listed in the discharge record. The first-listed condition can be interpreted as the primary reason for the ED visit. |
| Table 4. Most frequent first-listed conditionsa for diabetes-related emergency department visits for patients aged 0-29 years, 2012 | |||||||||
| First-listed condition (CCS) | All diabetes-related ED visits | All diabetes-related ED visits: treat-and-release | All diabetes-related ED visits: admitted to the hospital | ||||||
|---|---|---|---|---|---|---|---|---|---|
| Number of visits, in thousands | % | Rank | Number of visits, in thousands | % | Rank | Number of visits, in thousands | % | Rank | |
| Diabetes with complications | 118.7 | 20.2 | 1 | 45.3 | 10.1 | 1 | 73.4 | 53.2 | 1 |
| Diabetes without complications | 48.1 | 8.2 | 2 | 42.3 | 9.4 | 2 | 5.8 | 4.2 | 2 |
| Abdominal pain | 31.2 | 5.3 | 3 | 30.2 | 6.7 | 3 | 1.0 | 0.7 | - |
| Skin and subcutaneous infections | 21.4 | 3.6 | 4 | 17.4 | 3.9 | 4 | 4.0 | 2.9 | 3 |
| Sprains and strains | 16.4 | 2.8 | 5 | 16.4 | 3.7 | 5 | 1.7 | 1.2 | - |
| Urinary tract infections | 16.0 | 2.7 | 6 | 13.9 | 3.1 | 7 | 2.1 | 1.5 | 8 |
| Nausea and vomiting | 15.2 | 2.6 | 7 | 14.8 | 3.3 | 6 | 0.4 | 0.3 | - |
| Other upper respiratory infection | 13.5 | 2.3 | 8 | 13.2 | 2.9 | 8 | 0.3 | 0.2 | - |
| Nonspecific chest pain | 13.3 | 2.3 | 9 | 12.7 | 2.8 | 9 | 0.7 | 0.5 | - |
| Headache; including migraine | 12.6 | 2.1 | 10 | 12.4 | 2.8 | 10 | 0.4 | 0.3 | - |
| Mood disorders | 7.9 | 1.4 | - | 4.6 | 1.0 | - | 3.3 | 2.4 | 4 |
| Septicemia (except in labor) | 3.4 | 0.6 | - | 0.2 | 0.0 | - | 3.2 | 2.4 | 5 |
| Pancreatic disorders (not diabetes) | 3.4 | 0.6 | - | 0.8 | 0.2 | - | 2.6 | 1.9 | 6 |
| Complication of device; implant or graft | 3.0 | 0.5 | - | 0.8 | 0.2 | - | 2.2 | 1.6 | 7 |
| Schizophrenia and other psychotic disorders | 3.4 | 0.6 | - | 1.6 | 0.4 | - | 1.8 | 1.3 | 9 |
| Pneumonia | 3.8 | 0.6 | - | 2.0 | 0.4 | - | 1.8 | 1.3 | 10 |
| Abbreviations: CCS, Clinical Classification Software; ED, emergency department Note: Dashes indicate that the condition was not ranked in the top 10. a For those ED visits that were treated and released, the first-listed condition can be interpreted as the primary reason for the ED visit. For those admitted to the hospital, the first-listed condition is determined after inpatient evaluation and is defined as the principal diagnosis, or chief reason for the hospital stay. Source: Agency for Healthcare Research and Quality (AHRQ), Center for Delivery, Organization, and Markets, Healthcare Cost and Utilization Project (HCUP), Nationwide Emergency Department Sample (NEDS), 2012 | |||||||||
Data Source The estimates in this Statistical Brief are based upon data from the Healthcare Cost and Utilization Project (HCUP) 2012 Nationwide Emergency Department Sample (NEDS). Supplemental sources included population denominator data for use with HCUP databases, derived from information available from the Bureau of the Census.5 Definitions ICD-9-CM and Clinical Classifications Software (CCS) ICD-9-CM is the International Classification of Diseases, Ninth Revision, Clinical Modification, which assigns numeric codes to diagnoses. There are approximately 14,000 ICD-9-CM diagnosis codes. For this Statistical Brief, diabetes-related emergency department (ED) visits were identified as having an ICD-9-CM diagnosis code of 250.xx. The following ICD-9-CM codes were used. All-listed refers to the occurrence of one or more of these codes in any of the 15 diagnosis fields captured by HCUP NEDS data, and first-listed refers to the occurrence of one or more of these codes in the first diagnosis field. |
| Table 5. ICD-9-CM diagnosis codes defining diabetes | |||||||||
| Description | ICD-9-CM code | ||||||||
|---|---|---|---|---|---|---|---|---|---|
| Diabetes mellitus without mention of complications | 250.0x | ||||||||
| Diabetes with ketoacidosis | 250.1x | ||||||||
| Diabetes with hyperosmolarity | 250.2x | ||||||||
| Diabetes with other coma | 250.3x | ||||||||
| Diabetes with renal manifestations | 250.4x | ||||||||
| Diabetes with ophthalmic manifestations | 250.5x | ||||||||
| Diabetes with neurological manifestation | 250.6x | ||||||||
| Diabetes with peripheral circulatory disorders | 250.7x | ||||||||
| Diabetes with other specified manifestations | 250.8x | ||||||||
| Diabetes with unspecified complications | 250.9x | ||||||||
| Diabetes - not stated as uncontrolled | 250.x0 or 250.x1 | ||||||||
| Diabetes - uncontrolled | 250.x2 or 250.x3 | ||||||||
CCS categorizes ICD-9-CM diagnosis codes into a manageable number of clinically meaningful categories.6 This clinical grouper makes it easier to quickly understand patterns of diagnoses. CCS categories identified as "Other" typically are not reported; these categories include miscellaneous, otherwise unclassifiable diagnoses that may be difficult to interpret as a group.
CCS categories were used in this Statistical Brief to identify the most common first-listed diagnoses for patients with diabetes. The corresponding CCS codes and descriptions are shown below. |
| Table 6. CCS codes defining mental disorders | |||||||||
| CCS code | CCS description | ||||||||
|---|---|---|---|---|---|---|---|---|---|
| 2 | Septicemia | ||||||||
| 49 | Diabetes without complications | ||||||||
| 50 | Diabetes with complications | ||||||||
| 84 | Headache; including migraine | ||||||||
| 102 | Nonspecific chest pain | ||||||||
| 122 | Pneumonia | ||||||||
| 126 | Other upper respiratory infections | ||||||||
| 136 | Disorders of teeth and jaw | ||||||||
| 152 | Pancreatic disorders (not diabetes) | ||||||||
| 159 | Urinary tract infections | ||||||||
| 181 | Other complications of pregnancy | ||||||||
| 197 | Skin and subcutaneous tissue infection | ||||||||
| 205 | Spondylosis; intervertebral disc disorders; other back problems | ||||||||
| 232 | Sprains and strains | ||||||||
| 237 | Complication of device; implant or graft | ||||||||
| 239 | Superficial injury; contusion | ||||||||
| 250 | Nausea and vomiting | ||||||||
| 251 | Abdominal pain | ||||||||
| 657 | Mood disorders | ||||||||
| 659 | Schizophrenia and other psychotic disorders | ||||||||
Types of hospitals included in the HCUP Nationwide Emergency Department Sample The Nationwide Emergency Department Sample (NEDS) is based on data from community hospitals, which are defined as short-term, non-Federal, general, and other hospitals, excluding hospital units of other institutions (e.g., prisons). The NEDS includes specialty, pediatric, public, and academic medical hospitals. Excluded are long-term care facilities such as rehabilitation, psychiatric, and alcoholism and chemical dependency hospitals. Hospitals included in the NEDS have hospital-owned emergency departments and no more than 90 percent of their ED visits resulting in admission. Unit of analysis The unit of analysis is the ED encounter, not a person or patient. This means that a person who is seen in the ED multiple times in 1 year will be counted each time as a separate encounter in the ED. Location of patients' residence Place of residence is based on the urban-rural classification scheme for U.S. counties developed by the National Center for Health Statistics (NCHS):
In this brief, "Large Central Metropolitan" and "Large Fringe Metropolitan" classifications were collapsed into "Large Metropolitan". Median community-level income Median community-level income is the median household income of the patient's ZIP Code of residence. Income levels are separated into population-based quartiles with cut-offs determined using ZIP Code demographic data obtained from the Nielsen Company. The income quartile is missing for patients who are homeless or foreign. Payer Payer is the expected payer for the hospital stay. To make coding uniform across all HCUP data sources, payer combines detailed categories into general groups:
Hospital stays billed to the State Children's Health Insurance Program (SCHIP) may be classified as Medicaid, Private Insurance, or Other, depending on the structure of the State program. Because most State data do not identify patients in SCHIP specifically, it is not possible to present this information separately. For this Statistical Brief, when more than one payer is listed for a hospital discharge, the first-listed payer is used. Region Region is one of the four regions defined by the U.S. Census Bureau:
About HCUP The Healthcare Cost and Utilization Project (HCUP, pronounced "H-Cup") is a family of healthcare databases and related software tools and products developed through a Federal-State-Industry partnership and sponsored by the Agency for Healthcare Research and Quality (AHRQ). HCUP databases bring together the data collection efforts of State data organizations, hospital associations, and private data organizations (HCUP Partners) and the Federal government to create a national information resource of encounter-level healthcare data. HCUP includes the largest collection of longitudinal hospital care data in the United States, with all-payer, encounter-level information beginning in 1988. These databases enable research on a broad range of health policy issues, including cost and quality of health services, medical practice patterns, access to healthcare programs, and outcomes of treatments at the national, State, and local market levels. HCUP would not be possible without the contributions of the following data collection Partners from across the United States: Alaska State Hospital and Nursing Home Association Arizona Department of Health Services Arkansas Department of Health California Office of Statewide Health Planning and Development Colorado Hospital Association Connecticut Hospital Association District of Columbia Hospital Association Florida Agency for Health Care Administration Georgia Hospital Association Hawaii Health Information Corporation Illinois Department of Public Health Indiana Hospital Association Iowa Hospital Association Kansas Hospital Association Kentucky Cabinet for Health and Family Services Louisiana Department of Health and Hospitals Maine Health Data Organization Maryland Health Services Cost Review Commission Massachusetts Center for Health Information and Analysis Michigan Health & Hospital Association Minnesota Hospital Association Mississippi Department of Health Missouri Hospital Industry Data Institute Montana MHA - An Association of Montana Health Care Providers Nebraska Hospital Association Nevada Department of Health and Human Services New Hampshire Department of Health & Human Services New Jersey Department of Health New Mexico Department of Health New York State Department of Health North Carolina Department of Health and Human Services North Dakota (data provided by the Minnesota Hospital Association) Ohio Hospital Association Oklahoma State Department of Health Oregon Association of Hospitals and Health Systems Oregon Office of Health Analytics Pennsylvania Health Care Cost Containment Council Rhode Island Department of Health South Carolina Revenue and Fiscal Affairs Office South Dakota Association of Healthcare Organizations Tennessee Hospital Association Texas Department of State Health Services Utah Department of Health Vermont Association of Hospitals and Health Systems Virginia Health Information Washington State Department of Health West Virginia Health Care Authority Wisconsin Department of Health Services Wyoming Hospital Association About Statistical Briefs HCUP Statistical Briefs are descriptive summary reports presenting statistics on hospital inpatient and emergency department use and costs, quality of care, access to care, medical conditions, procedures, patient populations, and other topics. The reports use HCUP administrative healthcare data. About the NEDS The HCUP Nationwide Emergency Department Database (NEDS) is a unique and powerful database that yields national estimates of ED visits. The NEDS was constructed using records from both the HCUP State Emergency Department Databases (SEDD) and the State Inpatient Databases (SID). The SEDD capture information on ED visits that do not result in an admission (i.e., treat-and-release visits and transfers to another hospital); the SID contain information on patients initially seen in the emergency department and then admitted to the same hospital. The NEDS was created to enable analyses of ED utilization patterns and support public health professionals, administrators, policymakers, and clinicians in their decision making regarding this critical source of care. The NEDS is produced annually beginning in 2006. Over time, the sampling frame for the NEDS has changed; thus, the number of States contributing to the NEDS varies from year to year. The NEDS is intended for national estimates only; no State-level estimates can be produced. For More Information For more information about HCUP, visit http://www.hcup-us.ahrq.gov/. For additional HCUP statistics, visit HCUP Fast Stats at https://datatools.ahrq.gov/hcup-fast-stats for easy access to the latest HCUP-based statistics for health information topics, or visit HCUPnet, our interactive query system, at https://datatools.ahrq.gov/hcupnet. For information on other hospitalizations in the United States, refer to the following HCUP Statistical Briefs located at http://www.hcup-us.ahrq.gov/reports/statbriefs/statbriefs.jsp:
For a detailed description of HCUP and more information on the design of the Nationwide Emergency Department Sample (NEDS), please refer to the following database documentation: Agency for Healthcare Research and Quality. Overview of the Nationwide Emergency Department Sample (NEDS). Healthcare Cost and Utilization Project (HCUP). Rockville, MD: Agency for Healthcare Research and Quality. Updated January 2016. http://www.hcup-us.ahrq.gov/nedsoverview.jsp. Accessed February 17, 2016. Suggested Citation Amaize A (AHRQ), Mistry KB (AHRQ). Emergency Department Visits for Children and Young Adults With Diabetes, 2012. HCUP Statistical Brief #203. April 2016. Agency for Healthcare Research and Quality, Rockville, MD. http://www.hcup-us.ahrq.gov/reports/statbriefs/sb203-Emergency-Department-Children-Diabetes.pdf. *** AHRQ welcomes questions and comments from readers of this publication who are interested in obtaining more information about access, cost, use, financing, and quality of healthcare in the United States. We also invite you to tell us how you are using this Statistical Brief and other HCUP data and tools, and to share suggestions on how HCUP products might be enhanced to further meet your needs. Please e-mail us at hcup@ahrq.gov or send a letter to the address below:David Knutson, Director Center for Delivery, Organization, and Markets Agency for Healthcare Research and Quality 5600 Fishers Lane Rockville, MD 20857 1 Centers for Disease Control and Prevention. National Diabetes Statistics Report, 2014: Estimates of Diabetes and Its Burden in the United States. Centers for Disease Control and Prevention; 2014. Original source is no longer available on the Web; for related information refer to the 2017 update of this report, https://www.cdc.gov/diabetes/pdfs/data/statistics/national-diabetes-statistics-report.pdf, accessed September 18, 2017). 2 Centers for Disease Control and Prevention, National Center for Health Statistics, Division of Health Interview Statistics. Distribution of Age at Diagnosis of Diabetes Among Adult Incident Cases Aged 18-79 Years, United States, 2011. Atlanta, GA: Centers for Disease Control and Prevention. Original source is no longer available on the Web; for related information refer to the 2017 National Diabetes Statistics Report, https://www.cdc.gov/diabetes/pdfs/data/statistics/national-diabetes-statistics-report.pdf, accessed September 25, 2017). 3 Uscher-Pines L, Pines J, Kellermann A, Gillen E, Mehrotra A. Deciding to visit the emergency department for non-urgent conditions: a systematic review of the literature. American Journal of Managed Care. 2013;19(1):47-58. 4 Lee JM, Okumura MJ, Freed GL, Menon RK, Davis MM: Trends in hospitalizations for diabetes among children and young adults: United States, 1993-2004. Diabetes Care. 2007;30:3035-9. 5 Barrett M, Hickey K, Coffey R, Levit K. Population Denominator Data for Use with the HCUP Databases (Updated with 2014 Population Data). HCUP Methods Series Report #2015-07. September 1, 2015. U.S. Agency for Healthcare Research and Quality. http://www.hcup-us.ahrq.gov/reports/methods/2015-07.pdf. Accessed February 17, 2016. 6 Agency for Healthcare Research and Quality. HCUP Clinical Classifications Software (CCS). Healthcare Cost and Utilization Project (HCUP). Rockville, MD: Agency for Healthcare Research and Quality. Updated June 2015. http://www.hcup-us.ahrq.gov/toolssoftware/ccs/ccs.jsp. Accessed February 17, 2016. |