STATISTICAL BRIEF #197 |
December 2015
Brian Moore, Ph.D., Zeynal Karaca, Ph.D., Rachel Mosher Henke, Ph.D., and Herbert Wong, Ph.D. Introduction Today over half of community hospitals are part of multihospital health systems that are owned, leased, sponsored, or contract managed by a central organization. The rest remain as independent hospitals.1 Some multihospital health systems provide integrated care delivery through centralized management, whereas others are decentralized, with member hospitals associated primarily through unified ownership. The literature suggests that how a hospital is organized along these dimensions may affect the cost and quality of care, potentially through centralized services and increased communication between provider organizations. 2,3 In this Healthcare Cost and Utilization Project (HCUP) Statistical Brief, we compare hospitals in centrally organized multihospital systems (centralized system hospitals) with independent hospitals, two groups of hospitals that are distinctly different from each other:
The purpose of this Statistical Brief is exploratory—to show the difference in hospital characteristics between centralized system hospitals and independent hospitals at the national level, and to present descriptive statistics from HCUP on a variety of metrics. Because hospitals in centralized systems are likely to differ from independent hospitals in many ways, no inference can be made from these statistics about the relationship between being in a system and these metrics. We obtained data from the American Hospital Association (AHA) Annual Survey of Hospitals to categorize hospitals as centralized system hospitals or independent hospitals.4 Health systems are assigned to a category on the basis of how much they differentiate and centralize their hospital services, physician arrangements, and provider-based insurance products. We used data from the HCUP State Inpatient Databases (SID) and the AHA to measure hospital and patient characteristics in 2012. We used HCUP SID data to measure changes in hospital quality from 2009 to 2012. The hospital quality of care metrics that we used included mortality rates among adults for selected conditions from the Agency for Healthcare Research and Quality (AHRQ) Inpatient Quality Indicators (IQIs). We compared risk-adjusted mortality rates for both types of hospitals between 2009 and 2012. All differences between estimates noted in the text are statistically significant at the 0.05 level or better. |
|
Findings
Distribution of hospitals by hospital type, 2012 Figures 1 and 2 present the percentage of independent hospitals, centralized system hospitals, and noncentralized system hospitals in 2012 by selected hospital characteristics. |
|
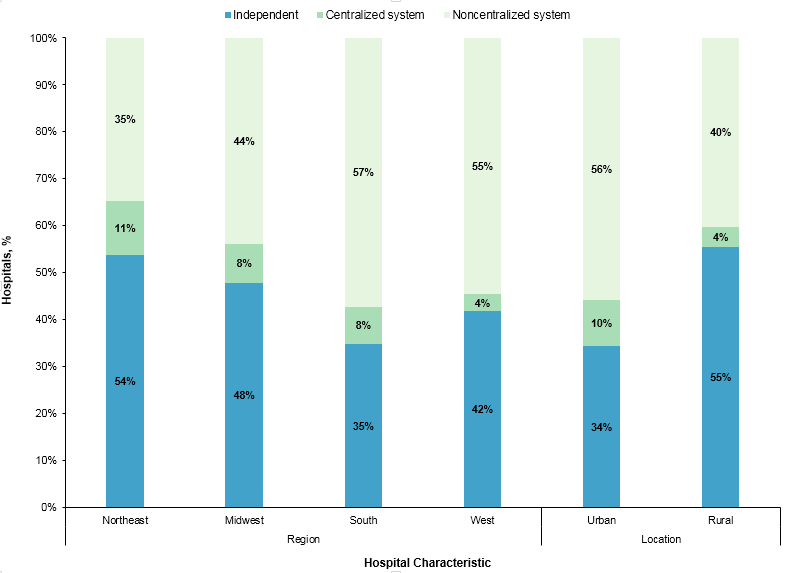
Figure 1. Distribution of hospitals by hospital type for geographic characteristics, 2012
Source: Agency for Healthcare Research and Quality (AHRQ), Center for Delivery, Organization, and Markets, Healthcare Cost and Utilization Project (HCUP), State Inpatient Databases (SID), 2012 Figure 1 is a stacked bar chart that shows the distribution of hospitals by hospital type for geographic region and location in 2012. In the Northeast, 35% of hospitals were noncentralized system hospitals, 11% were centralized system hospitals, and 54% were independent hospitals. In the Midwest, 44% of hospitals were noncentralized system hospitals, 8% were centralized system hospitals, and 48% were independent hospitals. In the South, 57% of hospitals were noncentralized system hospitals, 8% were centralized system hospitals, and 35% were independent hospitals. In the West, 55% of hospitals were noncentralized system hospitals, 4% were centralized system hospitals, and 42% were independent hospitals. In urban locations, 56% of hospitals were noncentralized system hospitals, 10% were centralized system hospitals, and 34% were independent hospitals. In rural locations, 40% of hospitals were noncentralized system hospitals, 4% were centralized system hospitals, and 55% were independent hospitals.
|
|
|
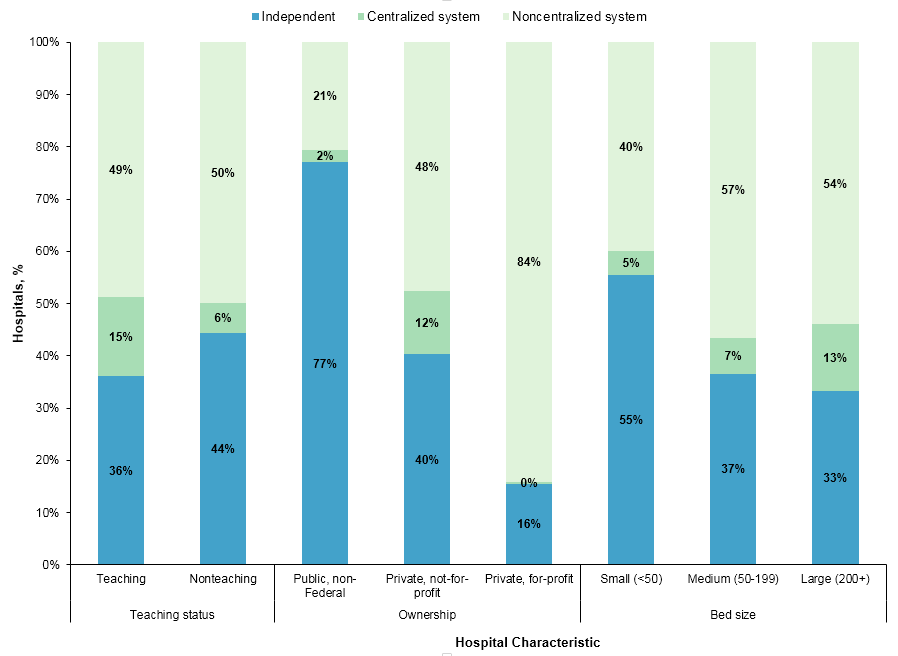
Figure 2. Distribution of hospitals by hospital type for selected characteristics, 2012
Source: Agency for Healthcare Research and Quality (AHRQ), Center for Delivery, Organization, and Markets, Healthcare Cost and Utilization Project (HCUP), State Inpatient Databases (SID), 2012 Figure 2 is a stacked bar chart that shows the distribution of hospitals by hospital type for teaching status, ownership, and bed size in 2012. Among teaching hospitals, 49% were noncentralized system hospitals, 15% were centralized system hospitals, and 36% were independent hospitals. Among nonteaching hospitals, 50% were noncentralized system hospitals, 6% were centralized system hospitals, and 44% were independent hospitals. Among public, non-Federal hospitals, 21% were noncentralized system hospitals, 2% were centralized system hospitals, and 77% were independent hospitals. Among private, not-for-profit hospitals, 48% were noncentralized system hospitals, 12% were centralized system hospitals, and 40% were independent hospitals. Among private, for-profit hospitals, 84% were noncentralized system hospitals, 0% were centralized system hospitals, and 16% were independent hospitals. Among small hospitals with fewer than 50 beds, 40% were noncentralized system hospitals, 5% were centralized system hospitals, and 55% were independent hospitals. Among medium hospitals with between 50 and 199 beds, 57% were noncentralized system hospitals, 7% were centralized system hospitals, and 37% were independent hospitals. Among large hospitals with 200 beds or more, 54% were noncentralized system hospitals, 13% were centralized system hospitals, and 33% were independent hospitals.
|
We excluded hospitals that were part of noncentralized systems from the remaining analyses to focus on the other two hospital types—centralized system hospitals and independent hospitals—which were distinctly different from each other. Characteristics of centralized system hospitals versus independent hospitals, 2012 Table 1 presents hospital characteristics of centralized system hospitals and independent hospitals in 2012. |
| Table 1. Hospital characteristics by hospital type, 2012 | |||
| Characteristic | Type of hospital | ||
|---|---|---|---|
| Centralized system | Independent | ||
| Number of hospitals | 270 | 1,505 | |
| Region, % of hospitals | Northeast | 18.9 | 15.9 |
| Midwest | 34.4 | 35.5 | |
| South | 37.0 | 29.3 | |
| West | 9.6 | 19.3 | |
| Bed size, % of hospitals | Small (<50 beds) | 22.2 | 48.3 |
| Medium (50-199 beds) | 31.5 | 29.9 | |
| Large (200+ beds) | 46.3 | 21.8 | |
| Ownership, % of hospitals | Public, nonfederal | 6.3 | 36.7 |
| Private, not-for-profit | 93.0 | 55.7 | |
| Private, for-profit | 0.7 | 7.6 | |
| Teaching status, % of hospitals | Teaching | 39.3 | 16.8 |
| Nonteaching | 60.7 | 83.2 | |
| Location, % of hospitals | Urban | 77.8 | 48.4 |
| Rural | 22.2 | 51.6 | |
| Source: Agency for Healthcare Research and Quality (AHRQ), Center for Delivery, Organization, and Markets, Healthcare Cost and Utilization Project (HCUP), State Inpatient Databases (SID), 2012 | |||
Table 2 presents the patient characteristics for stays at centralized system hospitals versus independent hospitals in 2012. There were no significant differences by patient age or sex. |
| Table 2. Patient characteristics by hospital type, 2012 | |||
| Characteristic | Type of hospital | ||
|---|---|---|---|
| Centralized system | Independent | ||
| Number of stays | 3,871,000 | 8,939,600 | |
| Age group, years, % of stays | < 1 | 11.4 | 12.2 |
| 1-17 | 3.8 | 5.8 | |
| 18-44 | 24.8 | 24.4 | |
| 45-64 | 25.6 | 23.8 | |
| 65+ | 34.5 | 33.8 | |
| Sex, % of stays | Male | 42.3 | 42.8 |
| Female | 57.7 | 57.2 | |
| Expected primary payer, % of stays | Medicare | 40.0 | 37.6 |
| Medicaid | 18.5 | 23.1 | |
| Private insurance | 33.8 | 30.0 | |
| Uninsured | 4.8 | 5.9 | |
| APR-DRG severity measures, % of stays | Severity of illness >3 | 29.2 | 25.6 |
| Risk of mortality >3 | 13.0 | 11.5 | |
| Resource use per stay | Average cost per stay, $ | 11,000 | 10,700 |
| Average length of stay, days | 4.7 | 4.6 | |
| Abbreviation: APR-DRG, All Patient Refined Diagnosis Related Groups Source: Agency for Healthcare Research and Quality (AHRQ), Center for Delivery, Organization, and Markets, Healthcare Cost and Utilization Project (HCUP), State Inpatient Databases (SID), 2012 | |||
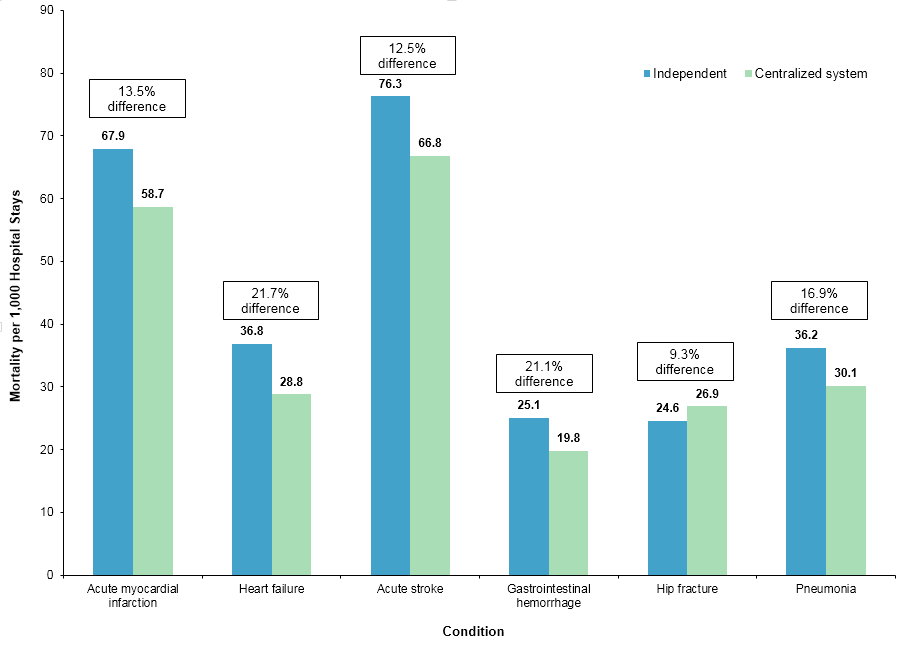
Inpatient mortality for centralized system hospitals versus independent hospitals, 2009-2012 Figure 3 shows the mortality rate for six selected conditions in 2012. |
|
Figure 3. Risk-adjusted mortality ratea per 1,000 hospital stays for selected conditions at centralized system hospitals and independent hospitals, 2012
a The variables used for risk adjustment vary for each individual inpatient quality indicator. Risk-adjustment variables included patient sex and age, Major Diagnostic Categories (MDC), All Payer Refined Diagnosis Related Group (APR-DRG), patient point-of-origin, and whether the patient was transferred from another facility. Additional information on the risk-adjustment process may be found in the Quality Indicator Empirical Methods document, available on the AHRQ Quality Indicators website at http://www.qualityindicators.ahrq.gov/modules/Default.aspx. Figure 3 is a bar chart that shows risk-adjusted mortality per 1,000 hospital stays at independent hospitals and centralized system hospitals for six conditions. The risk-adjusted mortality rate per 1,000 hospital stays for acute myocardial infarction was 67.9 for independent hospitals and 58.7 for centralized system hospitals, for a difference of 13.5%. The risk-adjusted mortality rate per 1,000 hospital stays for heart failure was 36.8 for independent hospitals and 28.8 for centralized system hospitals, for a difference of 21.7%. The risk-adjusted mortality rate per 1,000 hospital stays for acute stroke was 76.3 for independent hospitals and 66.8 for centralized system hospitals, for a difference of 12.5%. The risk-adjusted mortality rate per 1,000 hospital stays for gastrointestinal hemorrhage was 25.1 for independent hospitals and 19.8 for centralized system hospitals, for a difference of 21.1%. The risk-adjusted mortality rate per 1,000 hospital stays for hip fracture was 24.6 for independent hospitals and 26.9 for centralized system hospitals, for a difference of 9.3%. The risk-adjusted mortality rate per 1,000 hospital stays for pneumonia was 36.2 for independent hospitals and 30.1 for centralized system hospitals, for a difference of 16.9%.
|
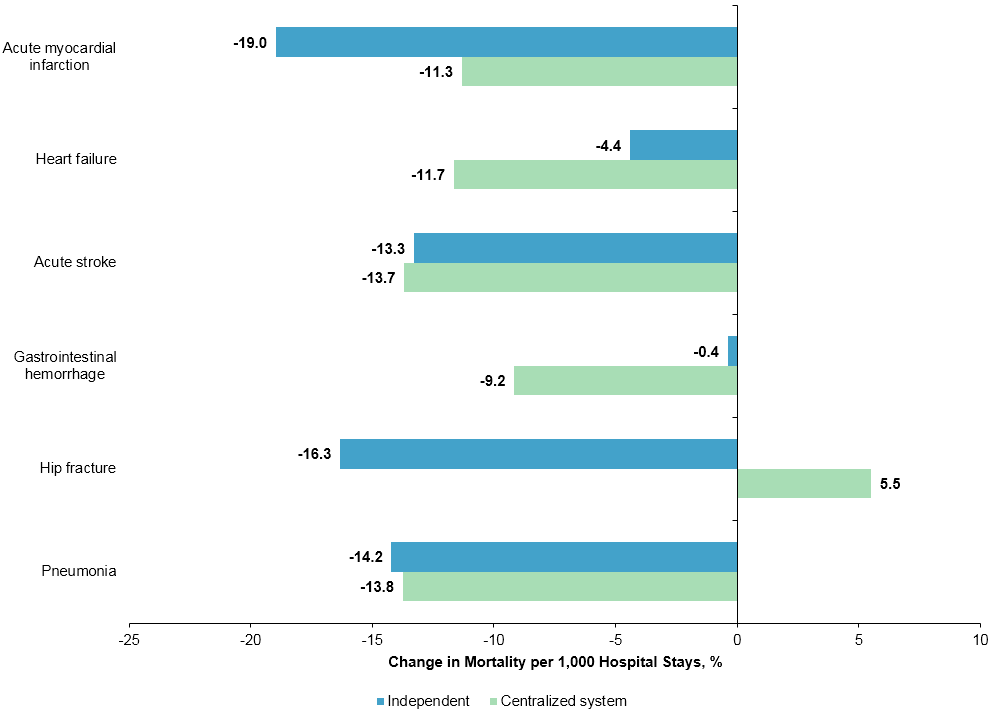
Figure 4 shows the percentage change in mortality rate for the six conditions between 2009 and 2012. |
|
Figure 4. Percentage change in risk-adjusted mortality ratea per 1,000 hospital stays for selected conditions by hospital type, 2009-2012
a The variables used for risk adjustment vary for each individual inpatient quality indicator. Risk-adjustment variables included patient sex and age, Major Diagnostic Categories (MDC), All Payer Refined Diagnosis Related Group (APR-DRG), patient point-of-origin, and whether the patient was transferred from another facility. Additional information on the risk-adjustment process may be found in the Quality Indicator Empirical Methods document, available on the AHRQ Quality Indicators website at http://www.qualityindicators.ahrq.gov/modules/Default.aspx. Figure 4 is a bar chart that shows the percentage change in risk-adjusted mortality rate per 1,000 hospital stays at independent and centralized system hospitals for six conditions between 2009 and 2012. The change in risk-adjusted mortality per 1,000 hospital stays for acute myocardial infarction was -19.0% for independent hospitals and -11.3% for centralized system hospitals. The change in risk-adjusted mortality per 1,000 hospital stays for heart failure was -4.4% for independent hospitals and -11.7% for centralized system hospitals. The change in risk-adjusted mortality per 1,000 hospital stays for acute stroke was -13.3% for independent hospitals and -13.7% for centralized system hospitals. The change in risk-adjusted mortality per 1,000 hospital stays for gastrointestinal hemorrhage was -0.4% for independent hospitals and -9.2% for centralized system hospitals. The change in risk-adjusted mortality per 1,000 hospital stays for hip fracture was -16.3% for independent hospitals and 5.5% for centralized system hospitals. The change in risk-adjusted mortality per 1,000 hospital stays for pneumonia was -14.2% for independent hospitals and -13.8% for centralized system hospitals.
|
|
Data Source
The estimates in this Statistical Brief are based upon data from the Healthcare Cost and Utilization Project (HCUP) 2012 State Inpatient Databases (SID). Historical data were drawn from the 2009-2011 SID. Definitions Types of hospitals included in HCUP State Inpatient Databases This analysis used State Inpatient Databases (SID) limited to data from community hospitals, which are defined as short-term, non-Federal, general, and other hospitals, excluding hospital units of other institutions (e.g., prisons). Community hospitals include obstetrics and gynecology, otolaryngology, orthopedic, cancer, pediatric, public, and academic medical hospitals. Excluded for this analysis are long-term care facilities such as rehabilitation, psychiatric, and alcoholism and chemical dependency hospitals. However, if a patient received long-term care, rehabilitation, or treatment for psychiatric or chemical dependency conditions in a community hospital, the discharge record for that stay was included in the analysis. Case definition The specification of hospitals as either an independent hospital or as belonging to a centralized system was based on responses to American Hospital Association (AHA) Annual Survey of Hospitals questions related to health system membership and degree of centralization in hospital services, physician arrangements, and insurance product development. Our definition of health systems is derived from a binary variable for system membership and the AHA system cluster variable, which uses multiple AHA survey responses and factor analysis to classify hospitals into an organized grouping of systems on the basis of differentiation, centralization, and integration. System is defined by AHA as either a multihospital or diversified single hospital system. A multihospital system is two or more hospitals owned, leased, sponsored, or contract managed by a central organization. Single, freestanding hospitals may be categorized as a system by bringing into membership three or more, and at least 25 percent, of their owned or leased nonhospital preacute or postacute organizations. Health systems are assigned to one of six categories on the basis of how much they differentiate and centralize their hospital services, physician arrangements, and provider-based insurance products. Table 3 describes each of the possible values of the AHA system cluster variable. |
Table 3. Total number of hospitals by AHA health system cluster |
||||||
| American Hospital Association health system cluster descriptionsa | Total number of hospitals in HCUP SIDb | Analytic sample sizec | ||||
|---|---|---|---|---|---|---|
| Cluster code | Label | Description | 2009 | 2012 | 2009 | 2012 |
| Hospitals with any system affiliation | ||||||
| 1 | Centralized health system | A delivery system in which the system centrally organizes individual hospital service delivery, physician arrangements, and insurance product development. The number of different products and services that are offered across the system is moderate. | 291 | 326 | 182 | 185 |
| 2 | Centralized physician/insurance health system | A delivery system with highly centralized physician arrangements and insurance product development. Within this group, hospital services are relatively decentralized, with individual hospitals having discretion over the array of services they offer. The number of different products and services that are offered across the system is moderate. | 146 | 156 | 88 | 85 |
| 3 | Moderately centralized health system | A delivery system that is distinguished by the presence of both centralized and decentralized activity for hospital services, physician arrangements, and insurance product development. For example, a system within this group may have centralized care of expensive, high-technology services, such as open heart surgery but allow individual hospitals to provide an array of other health services on the basis of local needs. The number of different products and services that are offered across the system is moderate. | 689 | 689 | 0 | 0 |
| 4 | Decentralized health system | A delivery system with a high degree of decentralization of hospital services, physician arrangements, and insurance product development. Within this group, systems may lack an overarching structure for coordination. Service and product differentiation is high, which may explain why centralization is hard to achieve. In this group, the system may simply serve a role in sharing information and providing administrative support to highly developed local delivery systems centered around hospitals. | 949 | 1,098 | 0 | 0 |
| 5 | Independent hospital system | A delivery system with limited differentiation of hospital services, physician arrangements, and insurance product development. These systems are largely horizontal affiliations of autonomous hospitals. | 456 | 533 | 0 | 0 |
| 6 or blank | Blank | Sufficient data from the FY 2012 Annual Survey were not available to determine a cluster assignment. | 36 | 40 | 0 | 0 |
| Hospitals with no system affiliation | ||||||
| Independent hospitals | 1,888 | 1,740 | 1,505 | 1,505 | ||
| Abbreviations: AHA, American Hospital Association; HCUP, Healthcare Cost and Utilization Project; SID, State Inpatient Databases a Bazzoli GJ, Shortell SM, Dubbs N, et al. A taxonomy of health networks and systems: bringing order out of chaos. Health Serv Res. 1999;33(6):1683-717. b These columns include all hospitals in the HCUP SID that can be merged with AHA files. c We excluded from the analysis hospitals with fewer than 30 discharges per year, with fewer than 4 years of data available between 2009 and 2012, or that changed health system affiliation or type of health system between 2009 and 2012. | ||||||
We reclassified the six clusters above into three groups: (1) AHA cluster values 1-2 for health systems with centralized physician arrangements and insurance product development, (2) AHA cluster values 3-6 for noncentralized health systems, and (3) independent hospitals, which do not indicate any system affiliation. Results for hospitals in group (2) above are not included in this Statistical Brief. This analysis focuses on two subgroups of hospitals in the United States:
Selected conditions are those included in composite Inpatient Quality Indicator (IQI) #91 from the AHRQ Quality Indicators (QIs) (http://www.qualityindicators.ahrq.gov/) - Mortality for Selected Conditions: acute myocardial infarction, heart failure, acute stroke, gastrointestinal hemorrhage, hip fracture, and pneumonia. Inpatient Quality Indicators and risk adjustment The AHRQ IQIs (version 4.4) were used for this analysis to identify the admissions of interest and for risk adjustment. The IQIs, a component of the AHRQ QIs, are a set of measures that can be used with hospital inpatient discharge and administrative data to provide a perspective on quality. Mortality indicators for inpatient care include conditions and procedures for which mortality has been shown to vary across institutions and for which there is evidence that high mortality may be associated with poor quality of care. The IQI approach identified the admissions for the six diagnoses (on the basis of International Classification of Diseases, Ninth Revision, Clinical Modification [ICD-9-CM] principal diagnosis codes). The approach included admissions of patients aged 18 years or older (65 years or older for hip fracture). The approach excluded admissions of patients who were transferred to another hospital and, with the exception of acute myocardial infarction, those that were obstetric. As part of the IQI risk-adjustment approach, APR-DRG software was applied to the data. The APR-DRG classification expands the DRG classification (used for Medicare reimbursement) to be applicable to non-Medicare populations and for uses beyond those related to resource consumption (i.e., for risk of mortality and severity of illness). Each admission is assigned an APR-DRG and a Risk of Mortality subclass (minor, moderate, major, or extreme) within the APR-DRG. The IQI risk-adjustment variables were age, sex, age-sex interaction, and APR-DRG Risk of Mortality subclass. Regression-based standardization (designed by the developers of the IQI software) was used for risk adjustment. Additional detail on the risk-adjustment methodology and statistical approach is available in Coffey et al. 2015.5 Further information on the AHRQ QIs, including documentation and free software downloads, is available at http://www.qualityindicators.ahrq.gov/. Unit of analysis The unit of analysis is the hospital discharge (i.e., the hospital stay), not a person or patient. This means that a person who is admitted to the hospital multiple times in 1 year will be counted each time as a separate discharge from the hospital. Costs and charges Total hospital charges were converted to costs using HCUP Cost-to-Charge Ratios based on hospital accounting reports from the Centers for Medicare & Medicaid Services (CMS).6 Costs reflect the actual expenses incurred in the production of hospital services, such as wages, supplies, and utility costs; charges represent the amount a hospital billed for the case. For each hospital, a hospital-wide cost-to-charge ratio is used. Hospital charges reflect the amount the hospital billed for the entire hospital stay and do not include professional (physician) fees. For the purposes of this Statistical Brief, costs are reported to the nearest hundred. Hospital location The classification of whether a hospital is in a metropolitan area (urban) or nonmetropolitan area (rural) is defined from the American Hospital Association (AHA) Annual Survey of Hospitals, using the 1993 U.S. Office of Management and Budget definition. Payer Payer is the expected payer for the hospital stay. To make coding uniform across all HCUP data sources, payer combines detailed categories into general groups:
Hospital stays billed to the State Children's Health Insurance Program (SCHIP) may be classified as Medicaid, Private Insurance, or Other, depending on the structure of the State program. Because most State data do not identify patients in SCHIP specifically, it is not possible to present this information separately. When more than one payer is listed for a hospital discharge, the first-listed payer is used. Region Region is one of the four regions defined by the U.S. Census Bureau:
About HCUP The Healthcare Cost and Utilization Project (HCUP, pronounced "H-Cup") is a family of databases and related software tools and products developed through a Federal-State-Industry partnership and sponsored by the Agency for Healthcare Research and Quality (AHRQ). HCUP databases bring together the data collection efforts of State data organizations, hospital associations, and private data organizations (HCUP Partners) and the Federal government to create a national information resource of encounter-level data. HCUP includes the largest collection of longitudinal hospital care data in the United States, with all-payer, encounter-level information beginning in 1988. These databases enable research on a broad range of health policy issues, including cost and quality of health services, medical practice patterns, access to programs, and outcomes of treatments at the national, State, and local market levels. HCUP would not be possible without the contributions of the following data collection Partners from across the United States: Alaska State Hospital and Nursing Home Association Arizona Department of Health Services Arkansas Department of Health California Office of Statewide Health Planning and Development Colorado Hospital Association Connecticut Hospital Association District of Columbia Hospital Association Florida Agency for Health Care Administration Georgia Hospital Association Hawaii Health Information Corporation Illinois Department of Public Health Indiana Hospital Association Iowa Hospital Association Kansas Hospital Association Kentucky Cabinet for Health and Family Services Louisiana Department of Health and Hospitals Maine Health Data Organization Maryland Health Services Cost Review Commission Massachusetts Center for Health Information and Analysis Michigan Health & Hospital Association Minnesota Hospital Association Mississippi Department of Health Missouri Hospital Industry Data Institute Montana MHA - An Association of Montana Health Care Providers Nebraska Hospital Association Nevada Department of Health and Human Services New Hampshire Department of Health & Human Services New Jersey Department of Health New Mexico Department of Health New York State Department of Health North Carolina Department of Health and Human Services North Dakota (data provided by the Minnesota Hospital Association) Ohio Hospital Association Oklahoma State Department of Health Oregon Association of Hospitals and Health Systems Oregon Office of Health Analytics Pennsylvania Health Care Cost Containment Council Rhode Island Department of Health South Carolina Revnue and Fiscal Affairs Office South Dakota Association of Healthcare Organizations Tennessee Hospital Association Texas Department of State Health Services Utah Department of Health Vermont Association of Hospitals and Health Systems Virginia Health Information Washington State Department of Health West Virginia Health Care Authority Wisconsin Department of Health Services Wyoming Hospital Association About Statistical Briefs HCUP Statistical Briefs are descriptive summary reports presenting statistics on hospital inpatient and emergency department use and costs, quality of care, access to care, medical conditions, procedures, patient populations, and other topics. The reports use HCUP administrative data. About the SID The HCUP State Inpatient Databases (SID) are hospital inpatient databases from data organizations participating in HCUP. The SID contain the universe of the inpatient discharge abstracts in the participating HCUP States, translated into a uniform format to facilitate multistate comparisons and analyses. Together, the SID encompass more than 95 percent of all U.S. community hospital discharges. The SID can be used to investigate questions unique to one State, to compare data from two or more States, to conduct market-area variation analyses, and to identify State-specific trends in inpatient care utilization, access, charges, and outcomes. For More Information For more information about HCUP, visit http://www.hcup-us.ahrq.gov/. For additional HCUP statistics, visit HCUPnet, our interactive query system, at https://datatools.ahrq.gov/hcupnet. For information on other hospitalizations in the United States, refer to the following HCUP Statistical Briefs located at http://www.hcup-us.ahrq.gov/reports/statbriefs/statbriefs.jsp:
Agency for Healthcare Research and Quality. Overview of the State Inpatient Databases (SID). Healthcare Cost and Utilization Project (HCUP). Rockville, MD: Agency for Healthcare Research and Quality. Updated November 2014. http://www.hcup-us.ahrq.gov/sidoverview.jsp. Accessed January 7, 2015. Suggested Citation Moore B (Truven Health Analytics), Karaca Z (AHRQ), Henke RM (Truven Health Analytics), Wong H (AHRQ). Characteristics and Quality of Inpatient Stays at Hospitals Affiliated With Health Systems, 2009-2012. HCUP Statistical Brief #197. December 2015. Agency for Healthcare Research and Quality, Rockville, MD. http://www.hcup-us.ahrq.gov/reports/statbriefs/sb197-Characteristics-Quality-Hospitals-Health-Systems.pdf. *** AHRQ welcomes questions and comments from readers of this publication who are interested in obtaining more information about access, cost, use, financing, and quality of in the United States. We also invite you to tell us how you are using this Statistical Brief and other HCUP data and tools, and to share suggestions on how HCUP products might be enhanced to further meet your needs. Please e-mail us at hcup@ahrq.gov or send a letter to the address below:Virginia Mackay-Smith, Acting Director Center for Delivery, Organization, and Markets Agency for Healthcare Research and Quality 5600 Fishers Lane Rockville, MD 20857 1 American Hospital Association. AHA Annual Survey Database™ Fiscal Year 2013. American Hospital Association Data Viewer website. http://www.ahadataviewer.com/book-cd-products/AHA-Survey. 2 Bazzoli GJ, Chan B, Shortell SM, D'Aunno T. The financial performance of hospitals belonging to health networks and systems. Inquiry: J Med Care Organ, Provision Financing. 2000;37(3):234-52. 3 Chukmaitov AS, Harless DW, Bazzoli GJ, Carretta HJ, Siangphoe. Delivery system characteristics and their association with quality and costs of care: implications for accountable care organizations. Health Care Manage Rev. 2014;40(2):92-103. 4 Bazzoli GJ, Shortell SM, Dubbs N, Chan C, Kralovec P. A taxonomy of health networks and systems: bringing order out of chaos. Health Serv Res. 1999;33(6):1683-717. 5 Coffey R, Barrett M, Houchens R, Moy E, Andrews R, Moles E, Coenen N. Methods Applying AHRQ Quality Indicators to Healthcare Cost and Utilization Project (HCUP) Data for the 2014 National Healthcare Quality Report (NHQR) and National Healthcare Disparities Report (NHDR). 2015. HCUP Methods Series Report #2015-02. February 3, 2015. U.S. Agency for Healthcare Research and Quality. http://www.hcup-us.ahrq.gov/reports/methods/2015_02.pdf. Accessed July 13, 2015. 6 Agency for Healthcare Research and Quality. HCUP Cost-to-Charge Ratio (CCR) Files. Healthcare Cost and Utilization Project (HCUP). 2001-2012. Rockville, MD: Agency for Healthcare Research and Quality. Updated December 2014. http://www.hcup-us.ahrq.gov/db/state/costtocharge.jsp. Accessed January 7, 2015. |