STATISTICAL BRIEF #190 |
May 2015
H. Joanna Jiang, Ph.D., Audrey J. Weiss, Ph.D., Marguerite L. Barrett, M.S., and Minya Sheng, M.S. Introduction A large proportion of healthcare resources in the United States are consumed by a relatively small number of individuals. Approximately one-fourth of U.S. healthcare expenses are incurred by 1 percent of the U.S. population, and half of expenses are incurred by 5 percent of the population.1 In contrast, half of the U.S. population incurs only 3 percent of total healthcare expenses.2 Those few individuals who consume a large share of healthcare resources have been dubbed super-utilizers.3 Super-utilizers have become the focus of strategies aimed at reducing their disproportionate use of the healthcare system by improving the delivery and management of their care.4,5 To better understand the characteristics and healthcare patterns of super-utilizers, the Agency for Healthcare Research and Quality (AHRQ) recently used data from the Healthcare Cost and Utilization Project (HCUP) to examine hospital utilization and costs among Medicaid super-utilizers.6 The researchers found that, on average, Medicaid super-utilizers had more hospital stays, longer stays, higher hospital costs per stay, and higher hospital readmission rates compared with other Medicaid patients.7 As payers and providers look to target interventions, it is useful for them to know more about the clinical and demographic profile of super-utilizers. This HCUP Statistical Brief extends AHRQ's earlier work by exploring characteristics of super-utilizers from other payer groups—Medicare and private insurance—with a comparison to Medicaid super-utilizers. In particular, this Statistical Brief presents data on patient demographics and on resource use and outcomes of hospital stays for super-utilizers compared with stays for other patients by expected payer (Medicare, private insurance, and Medicaid). For this report, super-utilizers were defined as Medicare or Medicaid patients with four or more hospital admissions or privately insured patients with three or more hospital admissions during 2012 based on a standard cut-off rule applied to the statistical distribution specific to each payer population.8 The 10 most common principal diagnoses for hospital stays are also identified for these super-utilizers. This analysis includes patients aged 1 to 64 years covered by private insurance, Medicaid (without Medicare listed as a payer), or Medicare, and patients aged 65 years and older covered by Medicare. Differences greater than 20 percent between weighted estimates are noted in the text. Findings Patient demographics of hospital stays among super-utilizers by payer, 2012 Table 1 presents patient demographic characteristics for hospital stays among super-utilizers compared with other patients by payer in 2012. |
|
| Table 1. Demographic characteristics for hospital stays among super-utilizersa by payer, 2012 | ||||||||
| Characteristicb | Medicare aged 65+ years | Medicare aged 1-64 years | Private insurance aged 1-64 years | Medicaid aged 1-64 years | ||||
|---|---|---|---|---|---|---|---|---|
| Super-utilizersa | Other patients | Super-utilizersa | Other patients | Super-utilizersa | Other patients | Super-utilizersa | Other patients | |
| Total number of stays, thousands | 1,791 | 10,075 | 865 | 2,384 | 914 | 7,192 | 884 | 5,297 |
| Mean age, years | 77.5 | 78.0 | 50.8 | 52.1 | 45.3 | 41.0 | 40.3 | 32.3 |
| Female, % | 55.2 | 56.7 | 49.3 | 50.8 | 53.3 | 65.0 | 50.9 | 70.4 |
| Chronic conditions, % | ||||||||
| No chronic condition | 1.2 | 2.4 | 4.3 | 7.2 | 14.2 | 42.6 | 10.8 | 46.5 |
| 1 chronic condition | 4.8 | 8.1 | 10.1 | 14.2 | 25.5 | 20.9 | 21.4 | 20.0 |
| 2-3 chronic conditions | 25.4 | 35.5 | 35.8 | 39.9 | 37.5 | 25.7 | 37.4 | 21.8 |
| 4+ chronic conditions | 68.6 | 53.9 | 49.7 | 38.7 | 22.7 | 10.7 | 30.5 | 11.7 |
| a Super-utilizers are patients covered by Medicare or Medicaid with four or more hospital stays and privately insured patients with three or more hospital stays in 2012.
b Patient demographic characteristics are reported across hospital stays, not across patients. All hospital stays for a patient in 2012 are included in the analysis. The payer-age group classification was identified based on the patient's first hospital stay during the year and applied to all subsequent stays. The statistics presented on patient age, sex, and chronic conditions were identified on the basis of each individual hospital stay. Source: Agency for Healthcare Research and Quality (AHRQ), Center for Delivery, Organization, and Markets, Healthcare Cost and Utilization Project (HCUP), weighted national estimates from a readmissions analysis file derived from the State Inpatient Databases (SID), 2012 | ||||||||
Common principal diagnoses for hospital stays among super-utilizers by payer, 2012 Table 2 lists the 10 most common principal diagnoses for hospital stays among super-utilizers by payer in 2012. The share of hospital stays attributed to super-utilizers, by payer, also is provided for each of the top 10 principal diagnoses. |
| Table 2. Top 10 principal diagnoses for hospital stays among super-utilizersa by payer, 2012 | ||||||||
| Principal diagnosisb | Rank based on hospital stays by payer | Share of hospital stays attributed to super-utilizers by payer, % | ||||||
|---|---|---|---|---|---|---|---|---|
| Medicare 65+ years | Medicare 1-64 years | Private 1-64 years | Medicaid 1-64 years | Medicare 65+ years | Medicare 1-64 years | Private 1-64 years | Medicaid 1-64 years | |
| Any principal diagnosis (all stays) | - | - | - | - | 15 | 27 | 11 | 14 |
| Congestive heart failure; nonhypertensive | 1 | 6 | 9 | 8 | 28 | 42 | 30 | 36 |
| Septicemia (except in labor) | 2 | 3 | 5 | 7 | 19 | 28 | 22 | 24 |
| Chronic obstructive pulmonary disease and bronchiectasis | 3 | 7 | 9 | 24 | 33 | 32 | ||
| Pneumonia (except that caused by tuberculosis or sexually transmitted disease) | 4 | 8 | 8 | 17 | 25 | 14 | ||
| Urinary tract infections | 5 | 18 | ||||||
| Cardiac dysrhythmias | 6 | 13 | ||||||
| Complication of device; implant or graft | 7 | 1 | 3 | 10 | 22 | 34 | 28 | 32 |
| Acute and unspecified renal failure | 8 | 20 | ||||||
| Respiratory failure; insufficiency; arrest (adult) | 9 | 9 | 24 | 35 | ||||
| Complications of surgical procedures or medical care | 10 | 10 | 2 | 22 | 31 | 26 | ||
| Schizophrenia and other psychotic disorders | 2 | 2 | 31 | 28 | ||||
| Diabetes mellitus with complications | 4 | 6 | 3 | 39 | 24 | 32 | ||
| Maintenance chemotherapy; radiotherapy | 1 | 4 | 81 | 74 | ||||
| Mood disorders | 5 | 4 | 1 | 26 | 13 | 18 | ||
| Sickle cell anemia | 5 | 57 | ||||||
| Alcohol-related disorders | 6 | 33 | ||||||
| Secondary malignancies | 7 | 32 | ||||||
| Pancreatic disorders (not diabetes) | 10 | 20 | ||||||
| a Super-utilizers are patients covered by Medicare or Medicaid with four or more hospital stays and privately insured patients with three or more hospital stays in 2012. b Clinical Classifications Software (CCS) categories based on International Classification of Diseases, Ninth Revision, Clinical Modification (ICD-9-CM) diagnoses.b All hospital stays for a patient in 2012 are included in the analysis. Principal diagnoses were identified based on each individual hospital stay. Source: Agency for Healthcare Research and Quality (AHRQ), Center for Delivery, Organization, and Markets, Healthcare Cost and Utilization Project (HCUP), weighted national estimates from a readmissions analysis file derived from the State Inpatient Databases (SID), 2012 | ||||||||
|
| Table 3. Resource use and outcomes of hospital stays for super-utilizersa by payer, 2012 | ||||||||
| Resource use, outcome | Medicare aged 65+ years | Medicare aged 1-64 years | Private insurance aged 1-64 years | Medicaid aged 1-64 years | ||||
|---|---|---|---|---|---|---|---|---|
| Super-utilizersa | Other patients | Super-utilizersa | Other patients | Super-utilizersa | Other patients | Super-utilizersa | Other patients | |
| Mean number of stays per year | 4.9 | 1.4 | 5.7 | 1.5 | 4.0 | 1.1 | 5.9 | 1.3 |
| Mean length of stay, days | 6.3 | 5.3 | 6.3 | 5.6 | 5.9 | 3.6 | 6.1 | 4.5 |
| Mean hospital costs, $ | 12,900 | 13,000 | 12,500 | 13,000 | 14,600 | 10,200 | 11,800 | 9,000 |
| Aggregate hospital costs, $ (billions) | 22.7 | 128.6 | 10.7 | 30.7 | 12.9 | 70.5 | 10.4 | 47.6 |
| Rate of 30-day all-cause readmissions, % | 45.7 | 11.4 | 48.1 | 12.0 | 44.5 | 5.1 | 52.4 | 8.8 |
| Type of hospital stay, % | ||||||||
| Medical stay | 80.1 | 64.7 | 70.8 | 57.8 | 65.1 | 33.3 | 67.0 | 35.3 |
| Surgical stay | 14.3 | 26.7 | 13.1 | 24.4 | 21.8 | 30.0 | 9.0 | 12.5 |
| Mental health stay | 2.3 | 2.2 | 13.6 | 12.2 | 7.7 | 5.7 | 19.3 | 11.6 |
| Injury stay | 3.3 | 6.5 | 2.2 | 4.1 | 1.8 | 4.7 | 2.0 | 3.8 |
| Maternal/neonatal stay | 0.0 | 0.0 | 0.3 | 1.4 | 3.6 | 26.3 | 2.7 | 36.8 |
| a Super-utilizers are Medicare or Medicaid patients with four or more hospital stays and privately insured patients with three or more hospital stays in 2012. Source: Agency for Healthcare Research and Quality (AHRQ), Center for Delivery, Organization, and Markets, Healthcare Cost and Utilization Project (HCUP), weighted national estimates from a readmissions analysis file derived from the State Inpatient Databases (SID), 2012 | ||||||||
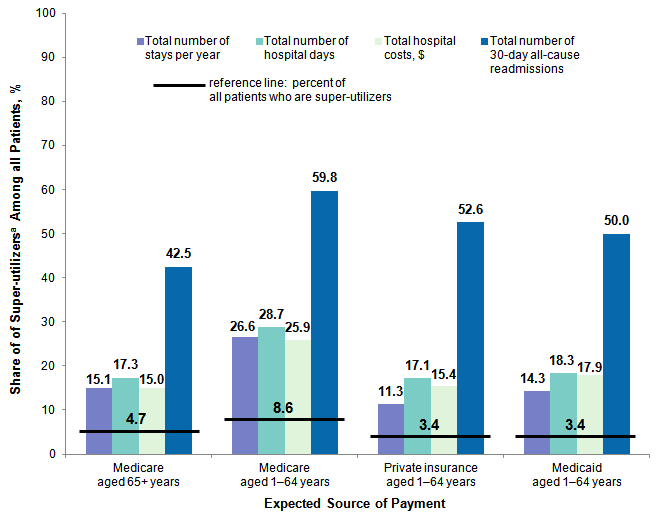
Figure 1 presents the share of total hospital stays, hospital days, hospital costs, and readmissions that were attributable to super-utilizers by payer in 2012. |
|
Figure 1. Share of resource use and outcomes for super-utilizersa among all patients by payer, 2012
a Super-utilizers are Medicare and Medicaid patients with four or more hospital stays and privately insured patients with three or more hospital stays in 2012. Figure 1 shows the share of resource use and outcomes attributable to super-utilizers among all patients by primary payer in 2012. In 2012, 15.1% of stays for Medicare patients aged 65 years or older were for super-utilizers, 26.6% of stays for Medicare patients aged 1-64 years were for superutilizers, 11.3% of stays for privately insured patients aged 1-64 years were for superutilizers, and 14.3% of stays for Medicaid patients aged 1-64 years were for super-utilizers. In 2012, 17.3% of hospital days for Medicare patients aged 65 years or older were for super-utilizers, 28.7% of hospital days for Medicare patients aged 1-64 years were for super-utilizers, 17.1% of hospital days for privately insured patients aged 1-64 years were for super-utilizers, and 18.3% of hospital days for Medicaid enrollees aged 1-64 years were for super-utilizers. In 2012, 15.0% of hospital costs for Medicare patients aged 65 years or older was for super-utilizers, 25.9% of hospital costs for Medicare patients aged 1-64 years was for super-utilizers, 15.4% of hospital costs for privately insured patients aged 1-64 years was for super-utilizers, and 17.9% of hospital costs for Medicaid enrollees aged 1-64 years was for super-utilizers. In 2012, 42.5% of 30-day all-cause readmissions for Medicare patients aged 65 years or older was for super-utilizers, 59.8% of all-cause readmissions for Medicare patients aged 1-64 years was for super-utilizers, 52.6% of all-cause readmissions for privately insured patients aged 1-64 years was for super-utilizers, and 50.0% of all-cause readmissions for Medicaid enrollees aged 1-64 years was for super-utilizers. These percentages are all substantially higher than the percentage of all patients who are super-utilizers: 4.7% of Medicare patients aged 65 years or older, 8.6% of Medicare patients aged 1-64 years, 3.4% of privately insured patients aged 1-64 years, and 3.4% for Medicaid enrollees aged 1-64 years were super-utilizers in 2012. |
Data Source The estimates in this Statistical Brief are based upon data from the Healthcare Cost and Utilization Project (HCUP) 2012 State Inpatient Databases (SID). The SID were used to create a readmissions analysis file weighted for national estimates. Only patients aged 1 year and older were included in the analysis. Verified patient linkage numbers tend to be less reliable and less complete for patients less than 1 year old, which makes it difficult to track multiple hospitalizations. Definitions Diagnoses, ICD-9-CM, and Clinical Classifications Software (CCS) The principal diagnosis is that condition established after study to be chiefly responsible for the patient's admission to the hospital. ICD-9-CM is the International Classification of Diseases, Ninth Revision, Clinical Modification, which assigns numeric codes to diagnoses. There are approximately 14,000 ICD-9-CM diagnosis codes. CCS categorizes ICD-9-CM diagnosis codes into a manageable number of clinically meaningful categories.9 This clinical grouper makes it easier to quickly understand patterns of diagnoses. CCS categories identified as Other typically are not reported; these categories include miscellaneous, otherwise unclassifiable diagnoses that may be difficult to interpret as a group. Types of hospitals included in HCUP State Inpatient Databases This analysis used State Inpatient Databases (SID) limited to data from community hospitals, which are defined as short-term, non-Federal, general, and other hospitals, excluding hospital units of other institutions (e.g., prisons). Community hospitals include obstetrics and gynecology, otolaryngology, orthopedic, cancer, pediatric, public, and academic medical hospitals. Excluded for this analysis are long-term care facilities such as rehabilitation, psychiatric, and alcoholism and chemical dependency hospitals. However, if a patient received long-term care, rehabilitation, or treatment for psychiatric or chemical dependency conditions in a community hospital, the discharge record for that stay was included in the analysis. Unit of analysis The unit of analysis is the hospital discharge (i.e., the hospital stay), not a person or patient. This means that a person who is admitted to the hospital multiple times in 1 year will be counted each time as a separate discharge from the hospital. Hospital use in the year determined which category (e.g., Medicare super-utilizers aged 1-64 years) included all stays for a patient. The payer-age group for the patient was defined by the first hospital stay in the year. For example, a Medicare patient who was 64 years old for a January stay and 65 years old for September hospital stay would be included in the group Medicare aged 1-64 years. After each patient was assigned to a payer-age group, the total number of hospital stays in 2012 was determined for each unique patient (based on the HCUP data element VisitLink). Using the distribution of total number of hospital stays within each payer-age group, the cut-off for super-utilizers was defined as approximately two standard deviations above the average total number of hospital stays. The assignment of the payer-age group and whether the patient qualified as a super-utilizer in that group was then added to each hospital stay discharge for that patient. The analysis considered all hospital stays in the year, with the exception of the counts of readmissions. Readmissions The 30-day readmission rate is defined as the number of admissions for each condition for which there was at least one subsequent hospital admission within 30 days, divided by the total number of admissions from January through November 2012. That is, when patients are discharged from the hospital, they are followed for 30 days in the data. If any readmission to the same or to a different hospital occurs during this time period, the admission is counted as a readmission. No more than one readmission is counted within the 30-day period of each admission, because the outcome measure assessed is the "percentage of admissions that are followed by a readmission." If a patient was transferred to a different hospital on the same day or was transferred within the same hospital, the two events were combined as a single stay and the second event was not counted as a readmission; that is, a transfer was not considered a readmission. Costs and charges Total hospital charges were converted to costs using HCUP Cost-to-Charge Ratios based on hospital accounting reports from the Centers for Medicare & Medicaid Services (CMS).10 Costs reflect the actual expenses incurred in the production of hospital services, such as wages, supplies, and utility costs; charges represent the amount a hospital billed for the case. For each hospital, a hospital-wide cost-to-charge ratio is used. Hospital charges reflect the amount the hospital billed for the entire hospital stay and do not include professional (physician) fees. For the purposes of this Statistical Brief, costs are reported to the nearest hundred. How HCUP estimates of costs differ from National Health Expenditure Accounts There are a number of differences between the costs cited in this Statistical Brief and spending as measured in the National Health Expenditure Accounts (NHEA), which are produced annually by CMS.11 The largest source of difference comes from the HCUP coverage of inpatient treatment only in contrast to the NHEA inclusion of outpatient costs associated with emergency departments and other hospital-based outpatient clinics and departments as well. The outpatient portion of hospitals' activities has been growing steadily and may exceed half of all hospital revenue in recent years. On the basis of the American Hospital Association Annual Survey, 2012 outpatient gross revenues (or charges) were about 44 percent of total hospital gross revenues.12 Smaller sources of differences come from the inclusion in the NHEA of hospitals that are excluded from HCUP. These include Federal hospitals (Department of Defense, Veterans Administration, Indian Health Services, and Department of Justice [prison] hospitals) as well as psychiatric, substance abuse, and long-term care hospitals. A third source of difference lies in the HCUP reliance on billed charges from hospitals to payers, adjusted to provide estimates of costs using hospital-wide cost-to-charge ratios, in contrast to the NHEA measurement of spending or revenue. HCUP costs estimate the amount of money required to produce hospital services, including expenses for wages, salaries, and benefits paid to staff as well as utilities, maintenance, and other similar expenses required to run a hospital. NHEA spending or revenue measures the amount of income received by the hospital for treatment and other services provided, including payments by insurers, patients, or government programs. The difference between revenues and costs include profit for for-profit hospitals or surpluses for nonprofit hospitals. Payer Payer is the expected payer for the hospital stay. To make coding uniform across all HCUP data sources, payer combines detailed categories into general groups:
Hospital stays billed to the State Children's Health Insurance Program (SCHIP) may be classified as Medicaid, Private Insurance, or Other, depending on the structure of the State program. Because most State data do not identify patients in SCHIP specifically, it is not possible to present this information separately. For the purpose of this analysis, the expected payer designation was assigned based on a hierarchy of Medicare, Medicaid, and then privately insured. Medicare was identified based on a payer code of Medicare as a primary, secondary, or tertiary payer regardless of any other reported payers. This means that individuals who were dually eligible for Medicare and Medicaid were categorized as Medicare. If not already assigned to Medicare, Medicaid was identified based on a payer code of Medicaid as a primary, secondary, or tertiary payer regardless of any other reported payers. If not already assigned to Medicare or Medicaid, private insurance was identified based on a payer code of private insurance as a primary, secondary, or tertiary payer. About HCUP The Healthcare Cost and Utilization Project (HCUP, pronounced "H-Cup") is a family of healthcare databases and related software tools and products developed through a Federal-State-Industry partnership and sponsored by the Agency for Healthcare Research and Quality (AHRQ). HCUP databases bring together the data collection efforts of State data organizations, hospital associations, and private data organizations (HCUP Partners) and the Federal government to create a national information resource of encounter-level healthcare data. HCUP includes the largest collection of longitudinal hospital care data in the United States, with all-payer, encounter-level information beginning in 1988. These databases enable research on a broad range of health policy issues, including cost and quality of health services, medical practice patterns, access to healthcare programs, and outcomes of treatments at the national, State, and local market levels. HCUP would not be possible without the contributions of the following data collection Partners from across the United States: Alaska State Hospital and Nursing Home Association Arizona Department of Health Services Arkansas Department of Health California Office of Statewide Health Planning and Development Colorado Hospital Association Connecticut Hospital Association District of Columbia Hospital Association Florida Agency for Health Care Administration Georgia Hospital Association Hawaii Health Information Corporation Illinois Department of Public Health Indiana Hospital Association Iowa Hospital Association Kansas Hospital Association Kentucky Cabinet for Health and Family Services Louisiana Department of Health and Hospitals Maine Health Data Organization Maryland Health Services Cost Review Commission Massachusetts Center for Health Information and Analysis Michigan Health & Hospital Association Minnesota Hospital Association Mississippi Department of Health Missouri Hospital Industry Data Institute Montana MHA - An Association of Montana Health Care Providers Nebraska Hospital Association Nevada Department of Health and Human Services New Hampshire Department of Health & Human Services New Jersey Department of Health New Mexico Department of Health New York State Department of Health North Carolina Department of Health and Human Services North Dakota (data provided by the Minnesota Hospital Association) Ohio Hospital Association Oklahoma State Department of Health Oregon Association of Hospitals and Health Systems Oregon Office of Health Analytics Pennsylvania Health Care Cost Containment Council Rhode Island Department of Health South Carolina Revenue and Fiscal Affairs Office South Dakota Association of Healthcare Organizations Tennessee Hospital Association Texas Department of State Health Services Utah Department of Health Vermont Association of Hospitals and Health Systems Virginia Health Information Washington State Department of Health West Virginia Health Care Authority Wisconsin Department of Health Services Wyoming Hospital Association About Statistical Briefs HCUP Statistical Briefs are descriptive summary reports presenting statistics on hospital inpatient and emergency department use and costs, quality of care, access to care, medical conditions, procedures, patient populations, and other topics. The reports use HCUP administrative healthcare data. About the SID The HCUP State Inpatient Databases (SID) are hospital inpatient databases from data organizations participating in HCUP. The SID contain the universe of the inpatient discharge abstracts in the participating HCUP States, translated into a uniform format to facilitate multistate comparisons and analyses. Together, the SID encompass more than 95 percent of all U.S. community hospital discharges. The SID can be used to investigate questions unique to one State, to compare data from two or more States, to conduct market-area variation analyses, and to identify State-specific trends in inpatient care utilization, access, charges, and outcomes. For More Information For more information about HCUP, visit http://www.hcup-us.ahrq.gov/. For additional HCUP statistics, visit HCUPnet, our interactive query system, at https://datatools.ahrq.gov/hcupnet. HCUPnet provides ready-to-use tables on readmission rates by condition and procedure (using Clinical Classification Software categories), diagnosis-related groups (DRGs), and major diagnostic categories (MDCs). For information on readmissions-related topics, refer to the following HCUP Statistical Briefs located at http://www.hcup-us.ahrq.gov/reports/statbriefs/statbriefs.jsp:
Suggested Citation Jiang HJ (AHRQ), Weiss AJ (Truven Health Analytics), Barrett ML (M.L. Barrett, Inc.), Sheng M (Truven Health Analytics). Characteristics of Hospital Stays for Super-Utilizers by Payer, 2012. HCUP Statistical Brief #190. May 2015. Agency for Healthcare Research and Quality, Rockville, MD. http://www.hcup-us.ahrq.gov/reports/statbriefs/sb190-Hospital-Stays-Super-Utilizers-Payer-2012.pdf. *** AHRQ welcomes questions and comments from readers of this publication who are interested in obtaining more information about access, cost, use, financing, and quality of healthcare in the United States. We also invite you to tell us how you are using this Statistical Brief and other HCUP data and tools, and to share suggestions on how HCUP products might be enhanced to further meet your needs. Please e-mail us at hcup@ahrq.gov or send a letter to the address below:Virginia Mackay-Smith, Acting Director Center for Delivery, Organization, and Markets Agency for Healthcare Research and Quality 540 Gaither Road Rockville, MD 20850 1 Stanton MW, Rutherford MK. The high concentration of U.S. healthcare expenditures. Research in Action Issue 19. 2005. Rockville, MD: Agency for Healthcare Research and Quality. http://meps.ahrq.gov/mepsweb/data_files/publications/ra19/ra19.pdf. Accessed February 5, 2015. 2 Ibid. 3 Gawande A. The hot spotters: can we lower medical costs by giving the neediest patients better care? The New Yorker. January 24, 2011. http://www.newyorker.com/magazine/2011/01/24/the-hot-spotters. 4 Emeche U. Is a strategy focused on super-utilizers equal to the task of healthcare system transformation? Yes. Annals of Family Medicine. 2015;13(1):6-7. 5 Robert Wood Johnson Foundation. A Revolutionary Approach to Improving Health Care Delivery. Better Care for Super-Utilizers series. February 1, 2014. http://www.rwjf.org/en/about-rwjf/newsroom/newsroom-content/2012/10/improving-management-of-health-care-superutilizers.html. 6 Jiang HJ, Barrett ML, Sheng M. Characteristics of Hospital Stays for Nonelderly Medicaid Super-utilizers, 2012. HCUP Statistical Brief #184. November 2014. Rockville, MD: Agency for Healthcare Research and Quality. http://www.hcup-us.ahrq.gov/reports/statbriefs/sb184-Hospital-Stays-Medicaid-Super-Utilizers-2012.pdf. Accessed February 5, 2015. 7 Ibid. 8 Four or more hospital stays for Medicare and Medicaid patients and three or more hospital stays for privately insured patients are approximately two standard deviations above the average number of hospital stays for patients in each payer category. 9 Agency for Healthcare Research and Quality. HCUP Clinical Classifications Software (CCS). Healthcare Cost and Utilization Project (HCUP). Rockville, MD: Agency for Healthcare Research and Quality. Updated November 2014. http://www.hcup-us.ahrq.gov/toolssoftware/ccs/ccs.jsp. Accessed January 7, 2015. 10 Agency for Healthcare Research and Quality. HCUP Cost-to-Charge Ratio (CCR) Files. Healthcare Cost and Utilization Project (HCUP). 2001-2012. Rockville, MD: Agency for Healthcare Research and Quality. Updated December 2014. http://www.hcup-us.ahrq.gov/db/state/costtocharge.jsp. Accessed January 7, 2015. 11 For additional information about the NHEA, see Centers for Medicare & Medicaid Services (CMS). National Health Expenditure Data. CMS website May 2014. http://www.cms.gov/Research-Statistics-Data-and-Systems/Statistics-Trends-and-Reports/NationalHealthExpendData/index.html?redirect=/NationalHealthExpendData/. Accessed January 7, 2015. 12 American Hospital Association. TrendWatch Chartbook, 2014. Table 4.2. Distribution of Inpatient vs. Outpatient Revenues, 1992-2012. Original source is no longer available on the Web; for related information refer to TrendWatch Chartbook, 2018. Table 4.2. Distribution of Inpatient vs. Outpatient Revenues, 1995-2016. www.aha.org/system/files/2018-05/2018-chartbook-table-4-2.pdf. |
| Internet Citation: Statistical Brief #190. Healthcare Cost and Utilization Project (HCUP). May 2016. Agency for Healthcare Research and Quality, Rockville, MD. hcup-us.ahrq.gov/reports/statbriefs/sb190-Hospital-Stays-Super-Utilizers-Payer-2012.jsp. |
| Are you having problems viewing or printing pages on this website? |
| If you have comments, suggestions, and/or questions, please contact hcup@ahrq.gov. |
| If you are experiencing issues related to Section 508 accessibility of information on this website, please contact hcup@ahrq.gov. |
| Privacy Notice, Viewers & Players |
| Last modified 5/18/16 |