STATISTICAL BRIEF #185 |
December 2014
Marguerite L. Barrett, M.S., Mark W. Smith, Ph.D., Anne Elixhauser, Ph.D., Leah S. Honigman, M.D., M.P.H., and Jesse M. Pines, M.D. Introduction As costs rise, there is increased emphasis on cost-effective care. Hospital stays that involve time in an intensive care unit (ICU) are of particular interest because critical care costs have been rising for decades, reaching 13.4 percent of hospital costs by 2005.1 From 2002 through 2009, ICU stays rose at three times the rate of general hospital stays without an increase in severity of illness.2 The reason for higher utilization of ICUs is unclear. Because ICU stays represent a costly segment of spending, it is important to understand patterns and variation in ICU utilization. This Healthcare Cost and Utilization Project (HCUP) Statistical Brief presents data on ICU utilization by adults in U.S. general medical and surgical hospitals in 2011. For this brief, ICU utilization includes various types of intensive care such as medical, surgical, coronary, pulmonary, psychiatric, burn, and trauma. Hospital stays and aggregate hospital charges are presented for discharges with and without an ICU stay. Conditions and procedures with high and low utilization of ICU services are reported with the percentage of total hospital charges for ICU services. In addition, ICU utilization is compared for conditions and procedures with and without complications or comorbidities. Finally, the types of hospitals with high and low ICU utilization are presented. This Statistical Brief used the HCUP State Inpatient Databases (SID) in 2011 for 29 States that included revenue center codes identifying ICU and coronary care unit (CCU) care. The analysis considered 16.9 million inpatient stays from 1,882 hospitals. To our knowledge, this is the first study of all-cause ICU utilization in a broad cross-section of U.S. hospitals. Findings Distribution of inpatient stays with and without ICU services, 2011 Figure 1 presents the distribution of adult inpatient stays and aggregate total hospital charges in 2011 for hospitalizations with and without ICU services, across 1,882 hospitals in 29 States. Hospital charges are reported instead of hospital costs because we later compare ICU charges with total hospital charges. Although it is possible to estimate total hospital costs from total hospital charges using the HCUP cost-to-charge ratios,3 these hospital-wide ratios do not account for variations among service departments. A cost-to-charge ratio for ICU services could differ substantially from the hospital-wide ratio.4 |
|
|
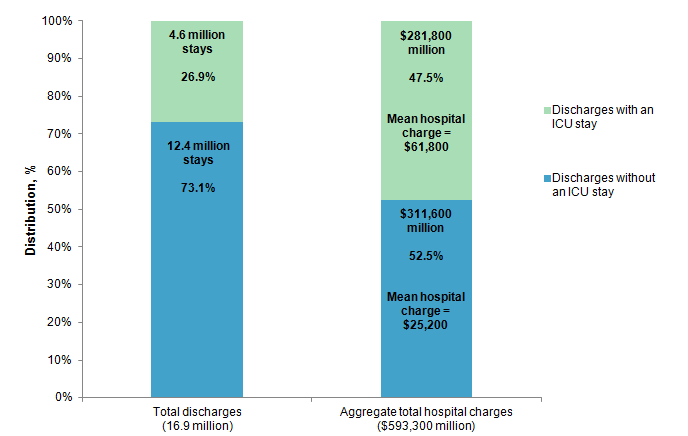
Figure 1. Adult hospital stays and aggregate total hospital charges by intensive care unit (ICU) use in 29 States, 2011
Source: Agency for Healthcare Research and Quality (AHRQ), Center for Delivery, Organization, and Markets, Healthcare Cost and Utilization Project (HCUP), State Inpatient Databases (SID) from 29 States, 2011 Figure 1 is a bar chart that shows the proportion of discharges with and without an ICU stay and the proportion of aggregate total hospital charges associated with discharges with and without an ICU stay in 2011. Of 16.9 total discharges in 2011, 4.6 million (26.9%) included an ICU stay and 12.4 million (73.1%) did not include an ICU stay. Of the $593,300,000 in aggregate total hospital charges in 2011, $281,800,000 (47.5%) were for discharges that included an ICU stay and $311,600,000 (52.5%) were for discharges that did not include an ICU stay. The mean hospital charge for discharges with an ICU stay was $61,800, and the mean hospital charge for discharges without an ICU stay was $25,200. |
Common conditions and procedures with high ICU utilization, 2011 Table 1 presents 18 common conditions and procedures that involved high ICU utilization in 2011, sorted by descending percentage of total stays with ICU services. Medicare Severity-Diagnosis Related Groups (MS-DRGs) are used to identify conditions and procedures for hospital billing. MS-DRGs reflect the presence of complications or comorbidities. MS-DRGs selected for Table 1 had a high percentage of stays with ICU utilization (at least 40 percent of stays had ICU services) and at least 40,000 stays with ICU utilization. |
| Table 1. Common conditions and procedures with the highest proportion of intensive care unit (ICU) utilization in 29 States, 2011 | ||||
| MS-DRG conditions and procedures | Total stays, n | Total stays with ICU services, % | Mean total charges across all stays, $ | Total charges attributed to ICU, %* |
|---|---|---|---|---|
| 208 Respiratory system diagnosis with ventilator support less than 96 hours | 78,233 | 93.3 | 57,200 | 24.4 |
| 280 Acute myocardial infarction, discharged alive with MCC | 59,727 | 70.3 | 45,000 | 30.3 |
| 64 Intracranial hemorrhage or cerebral infarction with MCC | 68,604 | 64.6 | 50,000 | 27.1 |
| 247 Percutaneous cardiovascular procedure with drug-eluting stent without MCC | 164,846 | 63.4 | 58,500 | 10.3 |
| 871 Septicemia or severe sepsis without mechanical ventilation 96+ hours with MCC | 304,367 | 59.0 | 45,500 | 24.1 |
| 918 Poisoning and toxic effects of drugs without MCC | 102,005 | 57.6 | 15,100 | 29.4 |
| 189 Pulmonary edema and respiratory failure | 101,064 | 54.1 | 29,600 | 25.8 |
| 291 Heart failure and shock with MCC | 157,978 | 53.8 | 36,500 | 31.5 |
| 309 Cardiac arrhythmia and conduction disorders with CC | 105,257 | 53.4 | 20,200 | 35.5 |
| 310 Cardiac arrhythmia and conduction disorders without CC/MCC | 143,023 | 51.3 | 14,400 | 35.2 |
| 287 Circulatory disorders except AMI, with cardiac catheterization without MCC | 164,103 | 51.2 | 32,000 | 22.9 |
| 682 Renal failure with MCC | 98,763 | 47.6 | 39,100 | 26.5 |
| 65 Intracranial hemorrhage or cerebral infarction with CC | 120,449 | 46.7 | 31,200 | 27.6 |
| 638 Diabetes with CC | 93,340 | 44.1 | 19,700 | 27.4 |
| 292 Heart failure and shock with CC | 210,406 | 43.5 | 24,200 | 38.2 |
| 378 Gastrointestinal hemorrhage with CC | 145,492 | 43.3 | 24,500 | 27.2 |
| 313 Chest pain | 221,490 | 40.6 | 15,500 | 29.5 |
| 193 Simple pneumonia and pleurisy with MCC | 116,555 | 40.5 | 35,200 | 25.5 |
| * Percentage of total charges attributed to ICU is defined as follows. Within an MS-DRG, we first determined the average total charge for stays with ICU services. Next, for the stays with ICU services, we determined the average charge for the ICU services. If a hospital stay had charges to different types of ICUs, the individual charges were included in the total ICU charge for the stay. The percentage of total charges attributed to ICU is the average charge for ICU services divided by the average total charge for discharges with ICU services. Abbreviations: MS-DRG, Medicare Severity Diagnosis Related Group; AMI, acute myocardial infarction; CC, complication or comorbidity; MCC, major complication or comorbidity Source: Agency for Healthcare Research and Quality (AHRQ), Center for Delivery, Organization, and Markets, Healthcare Cost and Utilization Project (HCUP), State Inpatient Databases (SID) from 29 States, 2011 | ||||
Common conditions and procedures with low ICU utilization, 2011 Table 2 presents 15 common conditions and procedures that involved low ICU utilization in 2011, sorted by descending percentage of total stays with ICU services. MS-DRGs selected for Table 2 had a low percentage of stays with ICU utilization (fewer than 20 percent of stays had ICU services) and at least 100,000 total stays. Although for Table 1 we used the criterion of 40,000 hospital stays with ICU services, when looking at conditions with low ICU utilization we had to limit the criteria to 100,000 stays, regardless of ICU services, to display a similar number of MS-DRGs. |
| Table 2. Common conditions and procedures with the lowest proportion of intensive care unit (ICU) utilization in 29 States, 2011 | ||||
| MS-DRG conditions and procedures | Total stays, n | Total stays with ICU services, % | Mean total charges across all stays, $ | Total charges attributed to ICU, %* |
|---|---|---|---|---|
| 812 Red blood cell disorders without MCC | 133,993 | 18.1 | 20,000 | 28.5 |
| 195 Simple pneumonia and pleurisy without CC/MCC | 105,814 | 16.5 | 16,700 | 29.2 |
| 897 Alcohol/drug abuse or dependence without rehabilitation therapy without MCC | 192,061 | 14.6 | 12,900 | 34.9 |
| 690 Kidney and urinary tract infections without MCC | 214,639 | 13.3 | 18,500 | 30.6 |
| 392 Esophagitis, gastroenteritis and miscellaneous digestive disorders without MCC | 401,640 | 12.2 | 18,100 | 28.0 |
| 460 Spinal fusion except cervical without MCC | 100,991 | 12.2 | 88,800 | 6.6 |
| 781 Other antepartum diagnoses with medical complications | 103,717 | 8.4 | 14,100 | 33.6 |
| 603 Cellulitis without MCC | 245,131 | 6.2 | 18,000 | 30.6 |
| 470 Major joint replacement or reattachment of lower extremity without MCC | 486,438 | 4.6 | 47,300 | 11.1 |
| 885 Psychoses | 553,699 | 4.3 | 21,400 | 54.5 |
| 765 Cesarean section with CC/MCC | 250,747 | 4.3 | 21,900 | 21.9 |
| 774 Vaginal delivery with complicating diagnoses | 178,943 | 2.4 | 12,900 | 26.4 |
| 743 Uterine and adnexa procedures for nonmalignancy without CC/MCC | 159,195 | 1.1 | 23,900 | 14.7 |
| 766 Cesarean section without CC/MCC | 437,150 | 0.9 | 16,400 | 21.3 |
| 775 Vaginal delivery without complicating diagnoses | 1,117,329 | 0.8 | 10,100 | 29.3 |
| * Percentage of total charges attributed to ICU is defined as follows. Within an MS-DRG, we first determined the average total charge for stays with ICU services. Next, for the stays with ICU services in the MS-DRG, we determined the average charge for those ICU services. If a hospital stay had charges to different types of ICUs, the individual charges were included in the total ICU charge. The percentage of total charges attributed to ICU is the average charge for ICU services divided by the average total charge for discharges with ICU services. Abbreviations: MS-DRG, Medicare Severity Diagnosis Related Group; CC, complication or comorbidity; MCC, major complication or comorbidity Source: Agency for Healthcare Research and Quality (AHRQ), Center for Delivery, Organization, and Markets, Healthcare Cost and Utilization Project (HCUP), State Inpatient Databases (SID) from 29 States, 2011 | ||||
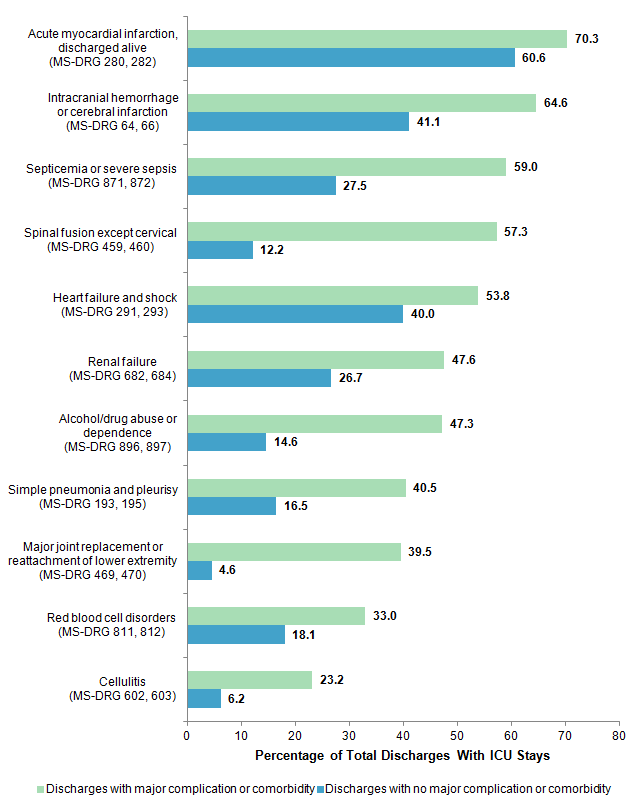
Differences in ICU use in the presence or absence of complications or comorbidities, 2011 Figure 2 shows selected conditions and procedures from Tables 1 and 2 with a related MS-DRG that varied by the presence or absence of complications or comorbidities. Conditions from Table 1 with major complications or comorbidities are displayed next to the same condition with no complication or comorbidity. Similarly, conditions from Table 2 with no complication or comorbidity are displayed next to the same condition with major complications or comorbidities. |
|
Figure 2. Intensive care unit (ICU) utilization for related conditions and procedures in the presence or absence of complications or comorbidities in 29 States, 2011
Abbreviations: MS-DRG, Medicare Severity Diagnosis Related Group Figure 2 is a bar chart that shows the percentage of total discharges with ICU stays in 2011 with major complication or comorbidity and with no complication or comorbidity for 11 related conditions and procedures. For discharges with ICU for acute myocardial infarction, discharged alive (MS-DRG 280, 282), 70.3% involved major complication or comorbidity and 60.6% involved no complication or comorbidity. For discharges with ICU for intracranial hemorrhage or cerebral infarction (MS-DRG 64, 66), 64.6% involved major complication or comorbidity and 41.1% involved no complication or comorbidity. For discharges with ICU for septicemia or severe sepsis (MS-DRG 871, 872), 59.0% involved major complication or comorbidity and 27.5% involved no complication or comorbidity. For discharges with ICU for spinal fusion except cervical (MS-DRG 459, 460), 57.3% involved major complication or comorbidity and 12.2% involved no complication or comorbidity. For discharges with ICU for heart failure and shock (MS-DRG 291, 293), 53.8% involved major complication or comorbidity and 40.0% involved no complication or comorbidity. For discharges with ICU for renal failure (MS-DRG 682, 684), 47.6% involved major complication or comorbidity and 26.7% involved no complication or comorbidity. For discharges with ICU for alcohol/drug abuse or dependence (MS-DRG 896, 897), 47.3% involved major complication or comorbidity and 14.6% involved no complication or comorbidity. For discharges with ICU for simple pneumonia and pleurisy (MS-DRG 193, 195), 40.5% involved major complication or comorbidity and 16.5% involved no complication or comorbidity. For discharges with ICU for major joint replacement or reattachment of lower extremity (MS-DRG 469, 470), 39.5% involved major complication or comorbidity and 4.6% involved no complication or comorbidity. For discharges with ICU for red blood cell disorders (MS-DRG 811, 812), 33.0% involved major complication or comorbidity and 18.1% involved no complication or comorbidity. For discharges with ICU for cellulitis (MS-DRG 602, 603), 23.2% involved major complication or comorbidity and 6.2% involved no complication or comorbidity. |
Characteristics of hospitals by level of ICU utilization, 2011 Table 3 presents the characteristics of hospitals that have low, medium, and high ICU utilization. Hospitals are grouped into three categories on the basis of percentage of all stays with ICU services. In the bottom quartile of hospitals—those with the lowest rates of ICU stays—less than 12.8 percent of stays included ICU services. In the top quartile of hospitals—those with the highest rates of ICU stays— more than 34.8 percent of stays had ICU services. The two middle quartiles were combined into one reporting group. |
| Table 3. Characteristics of hospitals by level of intensive care unit (ICU) use in 29 States, 2011 | ||||||
| Hospital characteristic | Bottom quartile of hospitals, ICU use <12.8% | Middle half of hospitals, ICU use 12.8-34.8% | Top quartile of hospitals, ICU use >34.8% | |||
|---|---|---|---|---|---|---|
| n | Row % | n | Row % | n | Row % | |
| All hospitals | 470 | 25.0 | 942 | 50.1 | 470 | 25.0 |
| Number of beds | ||||||
| Small | 205 | 38.1* | 228 | 42.4 | 105 | 19.5 |
| Medium | 130 | 21.9 | 307 | 51.7 | 157 | 26.4 |
| Large | 135 | 18.0 | 407 | 54.3 | 208 | 27.7* |
| Location | ||||||
| Large metropolitan area | 161 | 23.1 | 295 | 42.4 | 240 | 34.5* |
| Small metropolitan area | 96 | 18.0 | 297 | 55.8* | 139 | 26.1 |
| Micropolitan area | 95 | 25.0 | 221 | 58.2* | 64 | 16.8 |
| Not metropolitan or micropolitan (rural) | 118 | 43.1* | 129 | 47.1 | 27 | 9.9 |
| Ownership | ||||||
| Government (public) | 94 | 33.6* | 141 | 50.4 | 45 | 16.1 |
| Private, not-for-profit | 337 | 25.5 | 651 | 49.2 | 334 | 25.3 |
| Private, for-profit | 39 | 13.9 | 150 | 53.6 | 91 | 32.5* |
| Type of hospital | ||||||
| Teaching | 88 | 17.9 | 262 | 53.4 | 141 | 28.7* |
| Critical access hospital | 130 | 54.9* | 85 | 35.9 | 22 | 9.3 |
| Trauma designation | ||||||
| Level I (highest level of services) | 17 | 13.7 | 60 | 48.4 | 47 | 37.9* |
| Level II | 18 | 10.8 | 98 | 59.0* | 50 | 30.1* |
| Level III | 65 | 24.8 | 152 | 58.0* | 45 | 17.2 |
| Nontrauma centers (includes Levels IV and V trauma centers) | 370 | 27.8* | 632 | 47.5 | 328 | 24.7 |
| Note: n represents the number of hospitals that fit the category in the row and had the percentage range of ICU cases in the column. * Values are at least 10.0% higher than the row percentage for all hospitals within the group of hospitals (i.e., at least 10% higher than 25.0% for hospitals in the bottom quartile, at least 10% higher than 50.1% for hospitals in the middle two quartiles, and at least 10% higher than 25.0% for hospitals in the top quartile). Source: Agency for Healthcare Research and Quality (AHRQ), Center for Delivery, Organization, and Markets, Healthcare Cost and Utilization Project (HCUP), State Inpatient Databases (SID) from 29 States, 2011 | ||||||
Data Source The estimates in this Statistical Brief are based upon data from the Healthcare Cost and Utilization Project (HCUP) 2011 State Inpatient Databases (SID). A total of 29 States had the necessary data elements for identifying intensive care unit (ICU) use (Uniform Billing revenue center codes) and reported associated revenue center charges. Definitions Medicare Severity-Diagnosis Related Groups (MS-DRGs) MS-DRGs constitute a patient classification system that categorizes patients into groups that are clinically coherent and homogeneous with respect to resource use. MS-DRGs group patients according to diagnosis, type of treatment (procedures), age, and other relevant criteria. MS-DRGs are sensitive to whether the stay involved complications or comorbidities. Each hospital stay has one assigned MS-DRG, which may be medical or surgical. Intensive care units (ICUs) Revenue centers are administrative units found in hospital accounting systems. They roughly correspond to types of care provided. When hospitals submit bills to insurance companies, revenue centers in which care occurred are represented by codes. The codes are four-digit numbers in the Uniform Billing system used by hospitals in the United States. For this study, stays with ICU services were identified by the presence of any of the Uniform Billing revenue center codes defined in Table 4. |
| Table 4. Revenue center codes used to identify provision of ICU services during the hospital stay | |
| Revenue center code | Description of revenue center code |
|---|---|
| 0200 | General classification for intensive care unit (ICU) |
| 0201 | Surgical ICU |
| 0202 | Medical ICU |
| 0203 | Pediatric ICU |
| 0204 | Psychiatric ICU |
| 0206 | Intermediate ICU |
| 0207 | Burn care |
| 0208 | Trauma care |
| 0209 | Other intensive care |
| 0210 | General classification cardiac care unit (CCU) |
| 0211 | Myocardial infarction care |
| 0212 | Pulmonary care |
| 0213 | Heart transplant |
| 0214 | Intermediate CCU |
| 0219 | Other coronary care |
Both a conceptual understanding of these different types of critical care units and results of empirical analyses suggest that they should be combined into a single ICU category. Cardiac care units (CCUs) are similar to ICUs but specialize in treating patients with heart disease. Cardiac hospitalizations were often coded as having ICU services, and noncardiac hospitalizations were reported as having CCU services. Accordingly, this Statistical Brief includes CCUs in the ICU category. Similarly, the definition of ICU in this Statistical Brief considers intermediate-care ICUs and CCUs as regular ICUs because not all hospitals distinguish between intermediate and other forms of intensive care.
Hospitals reporting ICU use To ensure that the hospitals in the analysis had an ICU, a CCU, or both, data in the HCUP SID were linked to data in the American Hospital Association (AHA) Annual Survey of Hospitals. The AHA survey was used to determine the following hospital characteristics:
If the hospital had any of the above services, then it was considered to have evidence of an ICU. About 76 percent of the hospitals reported to AHA that they provide ICU services, 14 percent reported no ICU services, and 10 percent were missing AHA data. In the 29 sample States, 1,882 hospitals (85 percent) reported ICU services to the AHA and provided revenue codes and charges in the SID. Together these hospitals reported a total of 16.9 million adult inpatient stays in the SID. Types of hospitals included in HCUP State Inpatient Databases This analysis used State Inpatient Databases (SID) limited to data from community hospitals, which are defined as short-term, non-Federal, general, and other hospitals, excluding hospital units of other institutions (e.g., prisons). Community hospitals include obstetrics and gynecology, otolaryngology, orthopedic, cancer, pediatric, public, and academic medical hospitals. This analysis was further limited to general medical/surgical hospitals. This excluded specialty hospitals and long-term care facilities such as rehabilitation, psychiatric, and alcoholism and chemical dependency hospitals. However, if a patient received long-term care, rehabilitation, or treatment for psychiatric or chemical dependency conditions in a general medical/surgical hospital, the discharge record for that stay was included in the analysis. Unit of analysis The unit of analysis is the hospital discharge (i.e., the hospital stay), not a person or patient. This means that a person who is admitted to the hospital multiple times in 1 year will be counted each time as a separate discharge from the hospital. Charges Hospital charges reflect the amount the hospital billed for the entire hospital stay and do not include professional (physician) fees. Charges usually exceed what the hospital receives in payment for its services. ICU charges are calculated by summing the charges reported across all ICU revenue centers. For the purposes of this Statistical Brief, charges are reported to the nearest hundred. We chose to report charges because the HCUP cost-to-charge ratio is a hospital-wide adjustment that does not account for differences across charge centers. The cost-to-charge ratio for the ICU would certainly be different than for other charge centers, and applying a hospital-wide ratio would not reflect those differences. Hospital characteristics The following hospital characteristics were obtained from the American Hospital Association (AHA) Annual Survey of Hospitals: bed size, ownership, and status as a teaching or critical access hospital. The actual bed size for the hospital was categorized as small, medium, or large on the basis of differences across census region, urban location, and teaching status. The categorization of small, medium, and large is consistent with the grouping used for the HCUP National (Nationwide) Inpatient Sample (NIS). A teaching hospital is defined as having a residency program approved by the American Medical Association, being a member of the Council of Teaching Hospitals, or having a ratio of full-time equivalent interns and residents to beds of 0.25 or higher. This definition is also consistent with the NIS. Hospital location is determined by the 2003 version of the Urban Influence Codes (UIC) designation for the county of the hospital. Large metropolitan areas are metropolitan areas with at least 1 million residents; small metropolitan areas are metropolitan areas of less than 1 million residents. More precise definitions of these categories, and the complex definitions of micropolitan and rural areas, can be found on the website of the Economic Research Service, U.S. Department of Agriculture (currently http://www.ers.usda.gov/data-products/urban-influence-codes.aspx). Trauma designation for trauma centers treating adults and children were identified through the Trauma Information Exchange Program (TIEP) database, a national inventory of trauma centers in the United States. About HCUP The Healthcare Cost and Utilization Project (HCUP, pronounced "H-Cup") is a family of databases and related software tools and products developed through a Federal-State-Industry partnership and sponsored by the Agency for Healthcare Research and Quality (AHRQ). HCUP databases bring together the data collection efforts of State data organizations, hospital associations, and private data organizations (HCUP Partners) and the Federal government to create a national information resource of encounter-level data. HCUP includes the largest collection of longitudinal hospital care data in the United States, with all-payer, encounter-level information beginning in 1988. These databases enable research on a broad range of health policy issues, including cost and quality of health services, medical practice patterns, access to programs, and outcomes of treatments at the national, State, and local market levels. HCUP would not be possible without the contributions of the following data collection Partners from across the United States: Alaska State Hospital and Nursing Home Association Arizona Department of Health Services Arkansas Department of Health California Office of Statewide Health Planning and Development Colorado Hospital Association Connecticut Hospital Association Florida Agency for Health Care Administration Georgia Hospital Association Hawaii Health Information Corporation Illinois Department of Public Health Indiana Hospital Association Iowa Hospital Association Kansas Hospital Association Kentucky Cabinet for Health and Family Services Louisiana Department of Health and Hospitals Maine Health Data Organization Maryland Health Services Cost Review Commission Massachusetts Center for Health Information and Analysis Michigan Health & Hospital Association Minnesota Hospital Association Mississippi Department of Health Missouri Hospital Industry Data Institute Montana MHA - An Association of Montana Health Care Providers Nebraska Hospital Association Nevada Department of Health and Human Services New Hampshire Department of Health & Human Services New Jersey Department of Health New Mexico Department of Health New York State Department of Health North Carolina Department of Health and Human Services North Dakota (data provided by the Minnesota Hospital Association) Ohio Hospital Association Oklahoma State Department of Health Oregon Association of Hospitals and Health Systems Oregon Health Policy and Research Pennsylvania Health Care Cost Containment Council Rhode Island Department of Health South Carolina Revenue and Fiscal Affairs Office South Dakota Association of Healthcare Organizations Tennessee Hospital Association Texas Department of State Health Services Utah Department of Health Vermont Association of Hospitals and Health Systems Virginia Health Information Washington State Department of Health West Virginia Health Care Authority Wisconsin Department of Health Services Wyoming Hospital Association About Statistical Briefs HCUP Statistical Briefs are descriptive summary reports presenting statistics on hospital inpatient and emergency department use and costs, quality of care, access to care, medical conditions, procedures, patient populations, and other topics. The reports use HCUP administrative data. About the SID The HCUP State Inpatient Databases (SID) are hospital inpatient databases from data organizations participating in HCUP. The SID contain the universe of the inpatient discharge abstracts in the participating HCUP States, translated into a uniform format to facilitate multistate comparisons and analyses. Together, the SID encompass more than 95 percent of all U.S. community hospital discharges. The SID can be used to investigate questions unique to one State, to compare data from two or more States, to conduct market-area variation analyses, and to identify State-specific trends in inpatient care utilization, access, charges, and outcomes. For More Information For more information about HCUP, visit http://www.hcup-us.ahrq.gov/. For additional HCUP statistics, visit HCUPnet, our interactive query system, at https://datatools.ahrq.gov/hcupnet. For information on other hospitalizations in the United States, refer to the following HCUP Statistical Briefs located at http://www.hcup-us.ahrq.gov/reports/statbriefs/statbriefs.jsp:
For a detailed description of HCUP and more information on the design of the State Inpatient Databases (SID), please refer to the following database documentation: Agency for Healthcare Research and Quality. Overview of the State Inpatient Databases (SID). Healthcare Cost and Utilization Project (HCUP). Rockville, MD: Agency for Healthcare Research and Quality. Updated September 2014. http://www.hcup-us.ahrq.gov/sidoverview.jsp. Accessed September 11, 2014. Suggested Citation Barrett ML (M.L. Barrett, Inc.), Smith MW (Truven Health Analytics), Elixhauser A (AHRQ), Honigman LS (George Washington University, Washington DC Veterans Affairs Medical Center), Pines JM (George Washington University). Utilization of Intensive Care Services, 2011. HCUP Statistical Brief #185. December 2014. Agency for Healthcare Research and Quality, Rockville, MD. http://www.hcup-us.ahrq.gov/reports/statbriefs/sb185-Hospital-Intensive-Care-Units-2011.pdf. *** AHRQ welcomes questions and comments from readers of this publication who are interested in obtaining more information about access, cost, use, financing, and quality of in the United States. We also invite you to tell us how you are using this Statistical Brief and other HCUP data and tools, and to share suggestions on how HCUP products might be enhanced to further meet your needs. Please e-mail us at hcup@ahrq.gov or send a letter to the address below:Irene Fraser, Ph.D., Director Center for Delivery, Organization, and Markets Agency for Healthcare Research and Quality 540 Gaither Road Rockville, MD 20850 1 Halpern NA. Can the costs of critical care be controlled? Current Opinions in Critical Care. 2009 Dec;15(6):591-6. 2 Mullins PM, Goyal M, Pines JM. National growth in intensive care unit admissions from emergency departments in the United States from 2002 to 2009. Academic Emergency Medicine. 2013 May;20(5):479-86. 3 More information on the HCUP cost-to-charge ratios is available on the HCUP User Support website at http://www.hcup-us.ahrq.gov/db/state/costtocharge.jsp. Accessed November 19, 2014. 4 The HCUP Methods Series Report #2011-04 discusses different approaches to refining the hospital-wide cost-to-charge ratios. This report is available on the HCUP User Support website at http://www.hcup-us.ahrq.gov/reports/methods/methods.jsp. Accessed November 19, 2014. |