STATISTICAL BRIEF #182 |
October 2014
Lorena Lopez-Gonzalez, Ph.D., Gary T. Pickens, Ph.D., Raynard Washington, Ph.D., and Audrey J. Weiss, Ph.D. Introduction Many individuals with low income who require a hospital stay are uninsured or covered by Medicaid, a joint Federal-State health insurance program for eligible individuals and families with low income.1 In 2012, an estimated 15 percent of the U.S. population was uninsured and another 16 percent received medical insurance through Medicaid.2 However, hospitalization data from 2011 indicate that only 5 percent of hospital stays were for uninsured patients whereas 20 percent of hospital stays were covered by Medicaid.3 The difference in hospital utilization among patients covered by Medicaid and those who are uninsured may reflect differences in the characteristics of these populations and their level of access to . Medicaid is intended for individuals with low income, who are more likely than patients who are uninsured or privately insured to be pregnant or to have chronic health conditions or a disability.4 Individuals who are uninsured are less likely than those enrolled in Medicaid to be aware that they have a chronic condition and are therefore less prone to control the condition through medical care.5 Hospital utilization among the Medicaid and uninsured populations will continue to be of interest to policy analysts and other stakeholders as a result of the expansion of the Medicaid program to cover more of the nation's uninsured population under the Affordable Care Act. This HCUP Statistical Brief describes 2012 hospital stays with a primary expected payer of Medicaid and stays that were uninsured. This information represents an update to 2008 data presented in HCUP Statistical Brief #104.6 Hospital stays with an expected primary payer of private insurance are used as a comparison point for Medicaid and uninsured stays. Hospital and patient characteristics for hospital inpatient stays in 2012 are presented by expected primary payer. The most common diagnoses and the most common operating room (OR) procedures by expected primary payer also are provided. All differences in mean estimates and proportions between expected payers noted in the text are statistically significant at the .0001 level or better. |
|
Findings
Comparing Medicaid and uninsured hospital stays with privately insured stays, 2012 Table 1 presents general characteristics of hospital inpatient stays by expected primary payer—Medicaid, uninsured, and private insurance—in 2012. |
| Table 1. Characteristics of Medicaid, uninsured, and privately insured hospital stays, 2012 | |||||
| Characteristic | Expected primary payer | ||||
|---|---|---|---|---|---|
| Medicaid | Uninsured | Private insurance | |||
| Total hospital stays | |||||
| n, millions | 7.6 | 2.0 | 11.2 | ||
| % | 20.9 | 5.6 | 30.6 | ||
| Hospital stay characteristics | |||||
| Aggregate costs, billions $ | 61.7 | 18.1 | 107.8 | ||
| Aggregate cost, % | 16.3 | 4.8 | 28.6 | ||
| Mean cost per stay, $ | 8,100 | 8,800 | 9,700 | ||
| Mean length of stay, days | 4.3 | 4.0 | 3.8 | ||
| In-hospital deaths, % | 0.8 | 1.4 | 1.0 | ||
| Source: Agency for Healthcare Research and Quality (AHRQ), Center for Delivery, Organization, and Markets, Healthcare Cost and Utilization Project (HCUP), National Inpatient Sample (NIS), 2012 | |||||
Table 2 presents hospital ownership, location/teaching status, and bed size characteristics for Medicaid, uninsured, and privately insured hospital stays in 2012. |
| Table 2. Hospital characteristics for Medicaid, uninsured, and privately insured hospital stays, 2012 | |||||
| Characteristic | Expected primary payer | ||||
|---|---|---|---|---|---|
| Medicaid | Uninsured | Private insurance | |||
| Hospital characteristics | |||||
| Hospital ownership, % | |||||
| Government | 15.5 | 19.5 | 9.5 | ||
| Private, not for profit | 69.3 | 63.7 | 78.3 | ||
| Private, for profit | 15.2 | 16.8 | 712.2 | ||
| Hospital location and teaching status, % | |||||
| Rural | 11.0 | 10.9 | 8.6 | ||
| Urban nonteaching | 33.5 | 37.1 | 37.2 | ||
| Urban teaching | 55.5 | 52.0 | 54.2 | ||
| Hospital bed size,a % | |||||
| Small | 12.6 | 13.3 | 13.6 | ||
| Medium | 27.6 | 26.0 | 26.3 | ||
| Large | 59.8 | 60.7 | 60.1 | ||
| a Bed size categories are based on hospital beds and are specific to the hospital's location and teaching status. The definitions of small, medium, and large vary by region. Refer to the Definitions section at the end of this Statistical Brief for bed size category details. Source: Agency for Healthcare Research and Quality (AHRQ), Center for Delivery, Organization, and Markets, Healthcare Cost and Utilization Project (HCUP), National Inpatient Sample (NIS), 2012 | |||||
Table 3 presents the 2012 demographic characteristics of patients who were hospitalized with an expected primary payer of Medicaid, patients who were uninsured, and patients with an expected primary payer of private insurance. |
| Table 3. Patient characteristics for Medicaid, uninsured, and privately insured hospital stays, 2012 | |||||
| Patient characteristicsa | Expected primary payer | ||||
|---|---|---|---|---|---|
| Medicaid | Uninsured | Private insurance | |||
| Mean age, years | 25.3 | 39.2 | 36.6 | ||
| Age group in years,b % | |||||
| <1 | 26.9 | 7.8 | 17.1 | ||
| 1-17 | 9.8 | 2.1 | 5.5 | ||
| 18-44 | 40.6 | 46.3 | 34.6 | ||
| 45-64 | 20.5 | 40.6 | 34.7 | ||
| 65-84 | 1.9 | 2.7 | 7.0 | ||
| 85+ | 0.3 | 0.5 | 1.0 | ||
| Sex, % | |||||
| Male | 36.6 | 53.9 | 40.3 | ||
| Female | 63.4 | 46.0 | 59.7 | ||
| Median income of patient's ZIP Code, % | |||||
| Low income (<$39,000) | 41.3 | 37.4 | 20.1 | ||
| Not low income (≥$39,000) | 55.5 | 59.2 | 78.4 | ||
| Patient residence, % | |||||
| Large central metropolitan area | 36.5 | 32.3 | 28.1 | ||
| Large fringe metropolitan area (suburban) | 18.2 | 21.8 | 28.2 | ||
| Medium and small metropolitan area | 28.3 | 27.2 | 28.3 | ||
| Nonmetropolitian area (rural) | 16.5 | 17.0 | 15.1 | ||
| a Percentages may not sum to 100 percent because of a small number of records with missing data. b A total of 2.2 percent of Medicaid hospital stays were for patients aged 65 years and older. This may represent patients who have Medicaid and Medicare dual coverage for whom Medicaid is the first-listed expected primary payer on the hospital discharge record. Source: Agency for Healthcare Research and Quality (AHRQ), Center for Delivery, Organization, and Markets, Healthcare Cost and Utilization Project (HCUP), National Inpatient Sample (NIS), 2012 | |||||
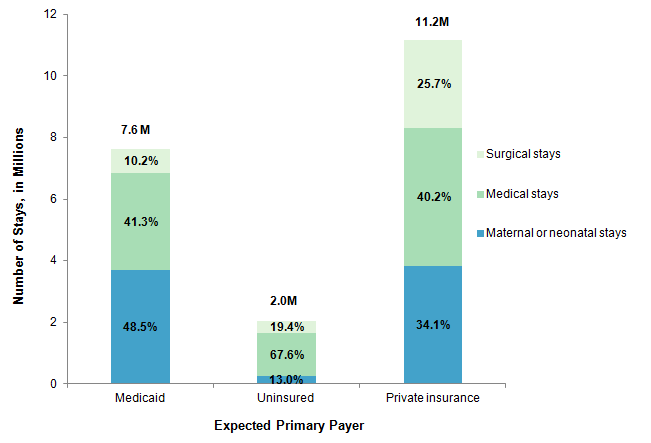
Figure 1 presents 2012 hospital inpatient stays with an expected primary payer of Medicaid, uninsured, and private insurance by type of stay. For each expected primary payer, hospitalizations were segmented into three types of stay: (1) maternal and neonatal, (2) medical, and (3) surgical. |
|
Figure 1. Medicaid, uninsured, and privately insured hospital stays by type of stay, 2012
Source: Agency for Healthcare Research and Quality (AHRQ), Center for Delivery, Organization, and Markets, Healthcare Cost and Utilization Project (HCUP), National Inpatient Sample (NIS), 2012 Figure 1 is a bar chart that shows the percentage of Medicaid, uninsured, and privately insured hospital stays that were surgical, medical, or maternal and neonatal. Of the 7.6 million Medicaid stays, 48.5% were maternal and neonatal, 41.3% were medical, and 10.2% were surgical. Of the 2 million uninsured stays, 13.0% were maternal and neonatal, 67.6% were medical, and 19.4% were surgical. Of the 11.2 million privately insured stays, 34.1% were maternal and neonatal, 40.2% were medical, and 25.7% were surgical. Source: Agency for Healthcare Research and Quality (AHRQ), Center for Delivery, Organization, and Markets, Healthcare Cost and Utilization Project (HCUP), Nationwide Inpatient Sample (NIS), 2012 |
Most common conditions and operating room procedures for Medicaid and uninsured stays compared with privately insured stays, 2012 Table 4 provides the top 10 principal diagnoses for medical and surgical stays (i.e., stays that were not maternal or neonatal) in 2012 among patients covered by Medicaid and those who were uninsured compared with patients covered by private insurance. |
| Table 4. Most common principal diagnoses for Medicaid, uninsured, and privately insured hospital stays involving surgical and medical (nonmaternal and nonneonatal) conditions, 2012 | |||||||||
| Principal diagnosisa | Expected primary payer | ||||||||
|---|---|---|---|---|---|---|---|---|---|
| Medicaid | Uninsured | Private insurance | Medicaid | Uninsured | Private insurance | ||||
| Rank | Rank | Rank | n | % | n | % | n | % | |
| Medical and surgical staysb | 3,926,800 | 100 | 1,779,700 | 100 | 7,360,700 | 100 | |||
| Mood disorders | 1 | 1 | 2 | 239,400 | 6.1 | 93,000 | 5.2 | 262,500 | 3.6 |
| Pneumonia | 2 | 10 | 4 | 144,500 | 3.7 | 42,900 | 2.4 | 187,900 | 2.6 |
| Schizophrenia and other psychotic disorders | 3 | 130,000 | 3.3 | ||||||
| Asthma | 4 | 124,200 | 3.2 | ||||||
| Septicemia (except in labor) | 5 | 5 | 5 | 119,800 | 3.1 | 49,700 | 2.8 | 185,100 | 2.5 |
| Skin and subcutaneous tissue infections | 6 | 2 | 8 | 114,800 | 2.9 | 74,900 | 4.2 | 158,700 | 2.2 |
| Diabetes mellitus with complications | 7 | 3 | 108,000 | 2.8 | 64,600 | 3.6 | |||
| Epilepsy, convulsions | 8 | 79,800 | 2.0 | ||||||
| Acute bronchitis | 9 | 79,600 | 2.0 | ||||||
| Chronic obstructive pulmonary disease and bronchiectasis | 10 | 74,500 | 1.9 | ||||||
| Biliary tract disease | 6 | 47,000 | 2.6 | ||||||
| Alcohol-related disorders | 4 | 62,800 | 3.5 | ||||||
| Nonspecific chest pain | 7 | 46,400 | 2.6 | ||||||
| Pancreatic disorders (not diabetes) | 9 | 44,500 | 2.5 | ||||||
| Osteoarthritis | 1 | 367,200 | 5.0 | ||||||
| Spondylosis, intervertebral disc disorders, other back problems | 3 | 235,900 | 3.2 | ||||||
| Cardiac dysrhythmias | 6 | 164,500 | 2.2 | ||||||
| Complications of surgical procedures or medical care | 7 | 161,000 | 2.2 | ||||||
| Acute myocardial infarction | 8 | 9 | 44,800 | 2.5 | 153,700 | 2.1 | |||
| Complication of device, implant or graft | 10 | 152,900 | 2.1 | ||||||
| a Clinical Classifications Software (CCS), which groups diagnoses into clinical categories, was used in this analysis. b Excludes maternal and neonatal. Source: Agency for Healthcare Research and Quality (AHRQ), Center for Delivery, Organization, and Markets, Healthcare Cost and Utilization Project (HCUP), National Inpatient Sample (NIS), 2012. | |||||||||
Table 5 shows the top 10 operating room (OR) procedures performed during hospital surgical inpatient stays—excluding maternal and neonatal stays—in 2012 for patients with an expected primary payer of Medicaid and those who were uninsured compared with those with an expected primary payer of private insurance. |
| Table 5. Most frequent all-listed operating room (OR) procedures during nonmaternal and nonneonatal hospital stays for Medicaid, uninsured, and privately insured patients, 2012 | |||||||||
| All-listed OR proceduresa,b | Expected primary payer | ||||||||
|---|---|---|---|---|---|---|---|---|---|
| Medicaid | Uninsured | Private insurance | Medicaid | Uninsured | Private insurance | ||||
| Rank | Rank | Rank | n | % | n | % | n | % | |
| Total | 1,173,200 | 100 | 576,000 | 100 | 4,451,600 | 100 | |||
| Cholecystectomy and common duct exploration | 1 | 1 | 8 | 57,800 | 4.9 | 44,400 | 7.7 | 149,200 | 3.4 |
| Appendectomy | 2 | 3 | 7 | 57,400 | 4.9 | 33,400 | 5.8 | 150,000 | 3.4 |
| Hysterectomy, abdominal and vaginal | 3 | 5 | 4 | 38,600 | 3.3 | 14,400 | 2.5 | 194,900 | 4.4 |
| Percutaneous coronary angioplasty (PTCA) | 4 | 2 | 5 | 35,900 | 3.1 | 38,600 | 6.7 | 160,500 | 3.6 |
| Spinal fusion | 5 | 3 | 32,300 | 2.8 | 200,000 | 4.5 | |||
| Excision, lysis peritoneal adhesions | 6 | 7 | 32,000 | 2.7 | 13,100 | 2.3 | |||
| Partial excision bone | 7 | 9 | 31,500 | 2.7 | 132,200 | 3.0 | |||
| Laminectomy, excision intervertebral disc | 8 | 2 | 31,500 | 2.7 | 208,600 | 4.7 | |||
| Oophorectomy, unilateral and bilateral | 9 | 9 | 10 | 25,000 | 2.1 | 11,900 | 2.1 | 128,600 | 2.9 |
| Arthroplasty knee | 10 | 1 | 23,400 | 2 | 261,300 | 5.9 | |||
| Hip replacement, total and partial | 6 | 152,100 | 3.4 | ||||||
| Treatment, fracture or dislocation of lower extremity | 4 | 20,500 | 3.6 | ||||||
| Intraoperative cholangiogram | 6 | 14,100 | 2.5 | ||||||
| Debridement of wound, infection or burn | 8 | 12,800 | 2.2 | ||||||
| Colorectal resection | 10 | 11,300 | 2 | ||||||
| a Clinical Classifications Software (CCS), which groups procedures into clinical categories, was used in this analysis. b Excludes maternal and neonatal. Source: Agency for Healthcare Research and Quality (AHRQ), Center for Delivery, Organization, and Markets, Healthcare Cost and Utilization Project (HCUP), National Inpatient Sample (NIS), 2012. | |||||||||
Data Source The estimates in this Statistical Brief are based upon data from the Healthcare Cost and Utilization Project (HCUP) 2012 National Inpatient Sample (NIS). Estimates of the volume for selected operating room (OR) procedures were generated from HCUPnet, a free, online query system that provides users with immediate access to the largest set of publicly available, all-payer national, regional, and State-level hospital care databases from HCUP.7 HCUPnet provides the ability to retrieve health statistics and information on hospital inpatient and emergency department utilization. Many hypothesis tests were conducted for this Statistical Brief. Thus, to decrease the number of false-positive results, we reduced the significance level to .0001 for individual tests. Definitions Diagnoses, procedures, ICD-9-CM, Clinical Classifications Software (CCS), diagnosis-related groups (DRGs), and major diagnostic categories (MDCs) The principal diagnosis is that condition established after study to be chiefly responsible for the patient's admission to the hospital. Secondary diagnoses are concomitant conditions that coexist at the time of admission or develop during the stay. All-listed procedures include all procedures performed during the hospital stay, whether for definitive treatment or for diagnostic or exploratory purposes. The first-listed procedure is the procedure that is listed first on the discharge record. Inpatient data define this as the principal procedure—the procedure that is performed for definitive treatment rather than for diagnostic or exploratory purposes (i.e., the procedure that was necessary to take care of a complication). ICD-9-CM is the International Classification of Diseases, Ninth Revision, Clinical Modification, which assigns numeric codes to diagnoses and procedures. There are approximately 14,000 ICD-9-CM diagnosis codes and approximately 4,000 ICD-9-CM procedure codes. CCS categorizes ICD-9-CM diagnosis codes into a manageable number of clinically meaningful categories.8 This clinical grouper makes it easier to quickly understand patterns of diagnoses. CCS categories identified as Other typically are not reported; these categories include miscellaneous, otherwise unclassifiable diagnoses that may be difficult to interpret as a group. DRGs comprise a patient classification system that categorizes patients into groups that are clinically coherent and homogeneous with respect to resource use. DRGs group patients according to diagnosis, type of treatment (procedure), age, and other relevant criteria. Each hospital stay has one assigned DRG. MDCs assign ICD-9-CM principal diagnosis codes into one of 25 general diagnosis categories. For this report, maternal hospital stays were identified using MDC 14 (pregnancy, childbirth, and the puerperium) and neonatal hospital stays were identified using MDC 15 (newborns and other neonates with conditions originating during the perinatal period). For this report, major operating room (OR) procedures were defined using procedure classes, which categorize each ICD-9-CM procedure code as either major therapeutic, major diagnostic, minor therapeutic, or minor diagnostic.9 Major OR procedures are considered to be valid OR procedures based on DRGs. This classification scheme relies upon physician panels that classify ICD-9-CM procedure codes according to whether the procedure would be performed in a hospital OR in most hospitals. Major OR procedures were identified using all procedure fields (first-listed and secondary) that were available on the discharge record. For the purposes of this Statistical Brief, the number of OR procedures is reported to the nearest hundred. Types of hospitals included in the HCUP National (Nationwide) Inpatient Sample The National (Nationwide) Inpatient Sample (NIS) is based on data from community hospitals, which are defined as short-term, non-Federal, general, and other hospitals, excluding hospital units of other institutions (e.g., prisons). The NIS includes obstetrics and gynecology, otolaryngology, orthopedic, cancer, pediatric, public, and academic medical hospitals. Excluded are long-term care facilities such as rehabilitation, psychiatric, and alcoholism and chemical dependency hospitals. Beginning in 2012, long-term acute care hospitals are also excluded. However, if a patient received long-term care, rehabilitation, or treatment for psychiatric or chemical dependency conditions in a community hospital, the discharge record for that stay will be included in NIS. Costs and charges Total hospital charges were converted to costs using HCUP Cost-to-Charge Ratios based on hospital accounting reports from the Centers for Medicare & Medicaid Services (CMS).10 Costs will reflect the actual expenses incurred in the production of hospital services, such as wages, supplies, and utility costs; charges represent the amount a hospital billed for the case. For each hospital, a hospital-wide cost-to-charge ratio is used. Hospital charges reflect the amount the hospital billed for the entire hospital stay and do not include professional (physician) fees. For the purposes of this Statistical Brief, costs are reported to the nearest hundred. Mean cost per day is calculated as the mean cost per stay divided by the mean length of stay. How HCUP estimates of costs differ from National Health Expenditure Accounts There are a number of differences between the costs cited in this Statistical Brief and spending as measured in the National Health Expenditure Accounts (NHEA), which are produced annually by the Centers for Medicare & Medicaid Services (CMS).11 The largest source of difference comes from the HCUP coverage of inpatient treatment only in contrast to the NHEA inclusion of outpatient costs associated with emergency departments and other hospital-based outpatient clinics and departments as well. The outpatient portion of hospitals' activities has been growing steadily and may exceed half of all hospital revenue in recent years. On the basis of the American Hospital Association Annual Survey, 2012 outpatient gross revenues (or charges) were about 44 percent of total hospital gross revenues.12 Smaller sources of differences come from the inclusion in the NHEA of hospitals that are excluded from HCUP. These include Federal hospitals (Department of Defense, Veterans Administration, Indian Health Services, and Department of Justice [prison] hospitals) as well as psychiatric, substance abuse, and long-term care hospitals. A third source of difference lies in the HCUP reliance on billed charges from hospitals to payers, adjusted to provide estimates of costs using hospital-wide cost-to-charge ratios, in contrast to the NHEA measurement of spending or revenue. HCUP costs estimate the amount of money required to produce hospital services, including expenses for wages, salaries, and benefits paid to staff as well as utilities, maintenance, and other similar expenses required to run a hospital. NHEA spending or revenue measures the amount of income received by the hospital for treatment and other services provided, including payments by insurers, patients, or government programs. The difference between revenues and costs include profit for for-profit hospitals or surpluses for nonprofit hospitals. Hospital location The classification of whether a hospital is in a metropolitan area (urban) or nonmetropolitan area (rural) is defined from the American Hospital Association (AHA) Annual Survey, using the 1993 definition from the U.S. Office of Management and Budget. Hospital bed size categories Bed size categories are based on hospital beds and are specific to the hospital's location and teaching status. The definitions of small, medium, and large hospital bed size vary by region. Teaching indicates whether the hospital in which the stay occurred is a teaching or a nonteaching hospital. A hospital is considered to be a teaching hospital if it has an approved residency program, is a member of the Council of Teaching Hospitals, or has 25 or more interns and residents per 100 hospital beds. Hospital bed sizes are presented in Table 6. |
| Table 6. Hospital bed size categories by hospital region | ||||
| Region | Location and teaching status | Hospital bed size | ||
|---|---|---|---|---|
| Small | Medium | Large | ||
| Northeast | Rural | 1-49 | 50-99 | 100+ |
| Urban, nonteaching | 1-124 | 125-199 | 200+ | |
| Urban, teaching | 1-249 | 250-424 | 425+ | |
| Midwest | Rural | 1-29 | 30-49 | 50+ |
| Urban, nonteaching | 1-74 | 75-174 | 175+ | |
| Urban, teaching | 1-249 | 250-374 | 375+ | |
| South | Rural | 1-39 | 40-74 | 75+ |
| Urban, nonteaching | 1-99 | 100-199 | 200+ | |
| Urban, teaching | 1-249 | 250-449 | 450+ | |
| West | Rural | 1-24 | 25-44 | 45+ |
| Urban, nonteaching | 1-99 | 100-174 | 175+ | |
| Urban, teaching | 1-199 | 200-324 | 325+ | |
Location of patients' residence Place of residence is based on the urban-rural classification scheme for U.S. counties developed by the National Center for Health Statistics (NCHS). For this Statistical Brief, we collapsed the NCHS categories into either urban or rural according to the following: Urban:
Rural:
Median community-level income Median community-level income is the median household income of the patient's ZIP Code of residence. The cut-offs for the quartile designation are determined using ZIP Code demographic data obtained from the Nielsen Company. The income quartile is missing for patients who are homeless or foreign. Payer Payer is the expected primary payer for the hospital stay. To make coding uniform across all HCUP data sources, payer combines detailed categories into general groups:
Hospital stays billed to the State Children's Health Insurance Program (SCHIP) may be classified as Medicaid, Private Insurance, or Other, depending on the structure of the State program. Because most State data do not identify patients in SCHIP specifically, it is not possible to present this information separately. When more than one payer is listed for a hospital discharge, the first-listed payer is used. Patients covered by both Medicare and Medicaid with Medicare listed as the primary payer were excluded from this analysis. About HCUP The Healthcare Cost and Utilization Project (HCUP, pronounced "H-Cup") is a family of databases and related software tools and products developed through a Federal-State-Industry partnership and sponsored by the Agency for Healthcare Research and Quality (AHRQ). HCUP databases bring together the data collection efforts of State data organizations, hospital associations, private data organizations, and the Federal government to create a national information resource of encounter-level data (HCUP Partners). HCUP includes the largest collection of longitudinal hospital care data in the United States, with all-payer, encounter-level information beginning in 1988. These databases enable research on a broad range of health policy issues, including cost and quality of health services, medical practice patterns, access to programs, and outcomes of treatments at the national, State, and local market levels. HCUP would not be possible without the contributions of the following data collection Partners from across the United States: Alaska State Hospital and Nursing Home Association Arizona Department of Health Services Arkansas Department of Health California Office of Statewide Health Planning and Development Colorado Hospital Association Connecticut Hospital Association Florida Agency for Health Care Administration Georgia Hospital Association Hawaii Health Information Corporation Illinois Department of Public Health Indiana Hospital Association Iowa Hospital Association Kansas Hospital Association Kentucky Cabinet for Health and Family Services Louisiana Department of Health and Hospitals Maine Health Data Organization Maryland Health Services Cost Review Commission Massachusetts Center for Health Information and Analysis Michigan Health & Hospital Association Minnesota Hospital Association Mississippi Department of Health Missouri Hospital Industry Data Institute Montana MHA - An Association of Montana Health Care Providers Nebraska Hospital Association Nevada Department of Health and Human Services New Hampshire Department of Health & Human Services New Jersey Department of Health New Mexico Department of Health New York State Department of Health North Carolina Department of Health and Human Services North Dakota (data provided by the Minnesota Hospital Association) Ohio Hospital Association Oklahoma State Department of Health Oregon Association of Hospitals and Health Systems Oregon Health Policy and Research Pennsylvania Health Care Cost Containment Council Rhode Island Department of Health South Carolina Revenue and Fiscal Affairs Office South Dakota Association of Healthcare Organizations Tennessee Hospital Association Texas Department of State Health Services Utah Department of Health Vermont Association of Hospitals and Health Systems Virginia Health Information Washington State Department of Health West Virginia Health Care Authority Wisconsin Department of Health Services Wyoming Hospital Association About Statistical Briefs HCUP Statistical Briefs are descriptive summary reports presenting statistics on hospital inpatient and emergency department use and costs, quality of care, access to care, medical conditions, procedures, patient populations, and other topics. The reports use HCUP administrative data. About the NIS The HCUP National (Nationwide) Inpatient Sample (NIS) is a national (nationwide) database of hospital inpatient stays. The NIS is nationally representative of all community hospitals (i.e., short-term, non-Federal, nonrehabilitation hospitals). The NIS is a sample of hospitals and includes all patients from each hospital, regardless of payer. It is drawn from a sampling frame that contains hospitals comprising more than 95 percent of all discharges in the United States. The vast size of the NIS allows the study of topics at the national and regional levels for specific subgroups of patients. In addition, NIS data are standardized across years to facilitate ease of use. The 2012 NIS was redesigned to optimize national estimates. The redesign incorporates two critical changes:
The new sampling strategy is expected to result in more precise estimates than those that resulted from the previous NIS design by reducing sampling error: for many estimates, confidence intervals under the new design are about half the length of confidence intervals under the previous design. The change in sample design for 2012 necessitates recomputation of prior years' NIS data to enable analysis of trends that uses the same definitions of discharges and hospitals. About HCUPnet HCUPnet is an online query system that offers instant access to the largest set of all-payer databases that are publicly available. HCUPnet has an easy step-by-step query system that creates tables and graphs of national and regional statistics as well as data trends for community hospitals in the United States. HCUPnet generates statistics using data from HCUP's National (Nationwide) Inpatient Sample (NIS), the Kids' Inpatient Database (KID), the Nationwide Emergency Department Sample (NEDS), the State Inpatient Databases (SID), and the State Emergency Department Databases (SEDD). For More Information For more information about HCUP, visit http://www.hcup-us.ahrq.gov/. For additional HCUP statistics, visit HCUPnet, our interactive query system, at https://datatools.ahrq.gov/hcupnet. For information on other hospitalizations in the United States, refer to the following HCUP Statistical Briefs located at http://www.hcup-us.ahrq.gov/reports/statbriefs/statbriefs.jsp:
For a detailed description of HCUP and more information on the design of the National (Nationwide) Inpatient Sample (NIS), please refer to the following database documentation: Agency for Healthcare Research and Quality. Overview of the National (Nationwide) Inpatient Sample (NIS). Healthcare Cost and Utilization Project (HCUP). Rockville, MD: Agency for Healthcare Research and Quality. Updated July 2014. http://www.hcup-us.ahrq.gov/nisoverview.jsp. Accessed September 11, 2014. Suggested Citation Lopez-Gonzalez L (Truven Health Analytics), Pickens GT (Truven Health Analytics), Washington R (AHRQ), Weiss AJ (Truven Health Analytics). Characteristics of Medicaid and Uninsured Hospitalizations, 2012. HCUP Statistical Brief #182. October 2014. Agency for Healthcare Research and Quality, Rockville, MD. http://www.hcup-us.ahrq.gov/reports/statbriefs/sb182-Medicaid-Uninsured-Hospitalizations-2012.pdf. *** AHRQ welcomes questions and comments from readers of this publication who are interested in obtaining more information about access, cost, use, financing, and quality of in the United States. We also invite you to tell us how you are using this Statistical Brief and other HCUP data and tools, and to share suggestions on how HCUP products might be enhanced to further meet your needs. Please e-mail us at hcup@ahrq.gov or send a letter to the address below:Irene Fraser, Ph.D., Director Center for Delivery, Organization, and Markets Agency for Healthcare Research and Quality 540 Gaither Road Rockville, MD 20850 1 Centers for Medicare & Medicaid Services. Eligibility. https://www.medicaid.gov/medicaid/program-information/medicaid-and-chip-eligibility-levels/index.html. Accessed November 8, 2017. 2 The Kaiser Family Foundation. State Health Facts. http://www.statehealthfacts.org/. 3 Pfuntner A, Wier LM, Elixhauser A. Overview of Hospital Stays in the United States, 2011. HCUP Statistical Brief #166. November 2013. Agency for Healthcare Research and Quality, Rockville, MD. http://www.hcup-us.ahrq.gov/reports/statbriefs/sb166.pdf. Accessed August 14, 2014. 4 Holahan J, Kenney G, Pelletier J. The Health Status of New Medicaid Enrollees Under Health Reform: Timely Analysis of Immediate Health Policy Issues. The Robert Wood Johnson Foundation and The Urban Institute; August 2010. http://www.rwjf.org/content/dam/farm/reports/issue_briefs/2010/rwjf65185. 5 Decker SL, Kostova D, Kenney GM, Long SK. Health status, risk factors, and medical conditions among persons enrolled in Medicaid vs uninsured low-income adults potentially eligible for Medicaid under the Affordable Care Act. JAMA. 2013;309(24):2579-86. 6 Stranges E, Ryan K, Elixhauser A. Medicaid Hospitalizations, 2008. HCUP Statistical Brief #104. January 2011. Agency for Healthcare Research and Quality, Rockville, MD. http://www.hcup-us.ahrq.gov/reports/statbriefs/sb104.pdf. Accessed September 30, 2014. 7 Agency for Healthcare Research and Quality. HCUPnet website. https://datatools.ahrq.gov/hcupnet. Accessed July 15, 2014. 8 Agency for Healthcare Research and Quality. HCUP Clinical Classifications Software (CCS). Healthcare Cost and Utilization Project (HCUP). Rockville, MD: Agency for Healthcare Research and Quality. Updated July 2014. http://www.hcup-us.ahrq.gov/toolssoftware/ccs/ccs.jsp. Accessed September 11, 2014. 9 HCUP Procedure Classes. Healthcare Cost and Utilization Project (HCUP). Rockville, MD: Agency for Healthcare Research and Quality. Updated September 2013. http://www.hcup-us.ahrq.gov/toolssoftware/procedure/procedure.jsp. Accessed May 12, 2014. 10 Agency for Healthcare Research and Quality. HCUP Cost-to-Charge Ratio (CCR) Files. Healthcare Cost and Utilization Project (HCUP). 2001-2011. Rockville, MD: Agency for Healthcare Research and Quality. Updated August 2014. http://www.hcup-us.ahrq.gov/db/state/costtocharge.jsp. Accessed September 11, 2014. 11 For additional information about the NHEA, see Centers for Medicare & Medicaid Services (CMS). National Health Expenditure Data. CMS website May 2014. http://www.cms.gov/Research-Statistics-Data-and-Systems/Statistics-Trends-and-Reports/NationalHealthExpendData/index.html?redirect=/NationalHealthExpendData/. Accessed October 9, 2014. 12 American Hospital Association. TrendWatch Chartbook, 2014. Table 4.2. Distribution of Inpatient vs. Outpatient Revenues, 1992-2012. Original source is no longer available on the Web; for related information refer to TrendWatch Chartbook, 2018. Table 4.2. Distribution of Inpatient vs. Outpatient Revenues, 1995-2016. www.aha.org/system/files/2018-05/2018-chartbook-table-4-2.pdf. |