STATISTICAL BRIEF #181 |
October 2014
Brian Moore, Ph.D., Katharine Levit, B.A., and Anne Elixhauser, Ph.D. Introduction In 2012, expenditures in the United States accounted for more than 17 percent of the Gross Domestic Product (GDP).1 Importantly, although only 7 percent of the civilian noninstitutionalized population in the United States had an inpatient hospital stay in 2011, the spending associated with those stays accounted for 29 percent of all expenses, making hospitalization one of the most expensive types of treatments.2 This Healthcare Cost and Utilization Project (HCUP) Statistical Brief presents data on the costs of hospital stays in the United States in 2012. 3 First, the distribution of hospital inpatient costs in 2012 by expected primary payer and type of hospital stay is provided. Second, growth in mean hospital costs between 2003 and 2012 is presented by type of hospital stay, patient age group, and expected primary payer. Finally, components of growth in aggregate annual hospital costs between 2003 and 2012 are provided. All differences between mean hospital costs noted in the text are statistically significant at the .001 level or better. Differences between proportions noted in the text differ by at least 10 percent. |
|
Findings
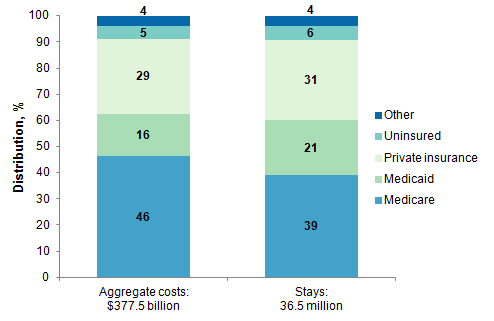
Aggregate hospital inpatient costs by payer and type of hospital stay, 2012 Figure 1 presents the aggregate hospital costs and total hospital stays by expected primary payer in 2012. |
|
Figure 1. Aggregate hospital costs and hospital stays by payer, 2012
Source: Agency for Healthcare Research and Quality (AHRQ), Center for Delivery, Organization, and Markets, Healthcare Cost and Utilization Project (HCUP), National Inpatient Sample (NIS), 2012 Figure 1 is a bar chart that shows the percentage of aggregate hospital costs and total hospital stays in 2012 that were covered by Medicare, Medicaid, or private insurance, or were uninsured. Aggregate hospital costs totaled $377.5 billion. 46% was covered by Medicare, 16% by Medicaid, and 29% by private insurance; 5% were uninsured, and 4% were Other. Of the 36.5 million hospital stays, 39% were covered by Medicare, 21% by Medicaid, and 31% by private insurance; 6% were uninsured, and 4% were Other. Source: Agency for Healthcare Research and Quality (AHRQ), Center for Delivery, Organization, and Markets, Healthcare Cost and Utilization Project (HCUP), National Inpatient Sample (NIS), 2012 |
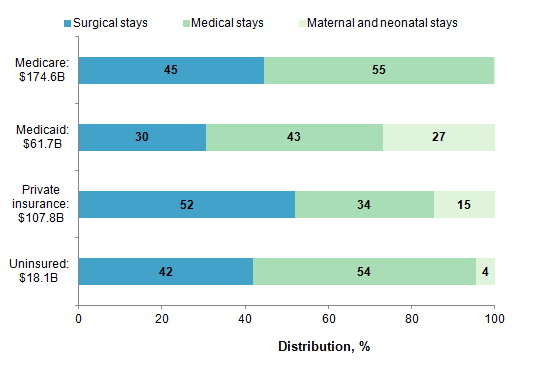
Figure 2 presents the distribution of costs by primary payer and type of hospital stay—surgical, medical, and maternal and neonatal—in 2012. |
|
Figure 2. Aggregate costs by payer and type of stay, 2012
Source: Agency for Healthcare Research and Quality (AHRQ), Center for Delivery, Organization, and Markets, Healthcare Cost and Utilization Project (HCUP), National Inpatient Sample (NIS), 2012 Figure 2 is a bar chart that shows the costs of hospital stays paid by Medicare, Medicaid, and private insurance and those that were uninsured. For each payer, the distribution of those costs among surgical stays, medical stays, and maternal and neonatal stays is presented. Of the $174.6 billion in Medicare costs, 45% were for surgical stays and 55% were for medical stays. Of the $61.7 billion in Medicaid costs, 30% were for surgical stays, 43% for medical stays, and 27% for maternal and neonatal stays. Of the $107.8 billion paid by private insurance, 52% were for surgical stays, 34% were for medical stays, and 15% were for maternal and neonatal stays. Of the $18.1 billion in costs for uninsured stays, 42% were for surgical stays, 54% were for medical stays, and 4% were for maternal and neonatal stays. Source: Agency for Healthcare Research and Quality (AHRQ), Center for Delivery, Organization, and Markets, Healthcare Cost and Utilization Project (HCUP), National Inpatient Sample (NIS), 2012 |
Growth in mean hospital costs by type of hospital stay, patient age, and primary payer, 2003-2012 Table 1 presents mean hospital costs per stay in 2003, 2008, and 2012 by type of hospital stay, patient age group, and expected primary payer. The average annual percentage change from 2003 to 2008 and from 2008 to 2012 also is provided. All costs are inflation adjusted and expressed in 2012 dollars. |
| Table 1. Inflation-adjusted mean hospital costs per stay, 2003, 2008, and 2012 | |||||
| Characteristic | Mean hospital costs per stay (inflation-adjusted), $ | Average annual change, % | |||
|---|---|---|---|---|---|
| 2003 | 2008 | 2012 | 2003-2008 | 2008-2012 | |
| All stays | 8,800 | 9,600 | 10,400 | 1.8 | 1.8 |
| Type of stay | |||||
| Surgical | 17,300 | 19,100 | 21,200 | 2.0 | 2.6 |
| Medical | 7,500 | 8,100 | 8,500 | 1.7 | 1.2 |
| Maternal and neonatal | 3,500 | 3,700 | 4,300 | 1.0 | 3.8 |
| Patient age group, years | |||||
| <1 | 3,600 | 3,800 | 5,000 | 1.3 | 6.7 |
| 1-17 | 6,500 | 7,700 | 9,900 | 3.6 | 6.4 |
| 18-44 | 6,700 | 7,100 | 7,600 | 1.3 | 1.8 |
| 45-64 | 11,300 | 12,300 | 12,900 | 1.7 | 1.2 |
| 65-84 | 11,500 | 12,400 | 13,000 | 1.6 | 1.1 |
| 85+ | 9,200 | 9,900 | 10,200 | 1.5 | 0.8 |
| Primary payer | |||||
| Medicare | 11,000 | 11,800 | 12,200 | 1.4 | 0.9 |
| Medicaid | 6,900 | 7,300 | 8,100 | 1.3 | 2.5 |
| Private insurance | 7,600 | 8,800 | 9,700 | 2.9 | 2.4 |
| Uninsured | 7,500 | 7,700 | 8,800 | 0.5 | 3.5 |
| Note: Data from 2008 were used as end points in both the 2003-2008 and 2008-2012 analyses. Source: Agency for Healthcare Research and Quality (AHRQ), Center for Delivery, Organization, and Markets, Healthcare Cost and Utilization Project (HCUP), National (Nationwide) Inpatient Sample (NIS), 2003, 2008, and 2012 | |||||
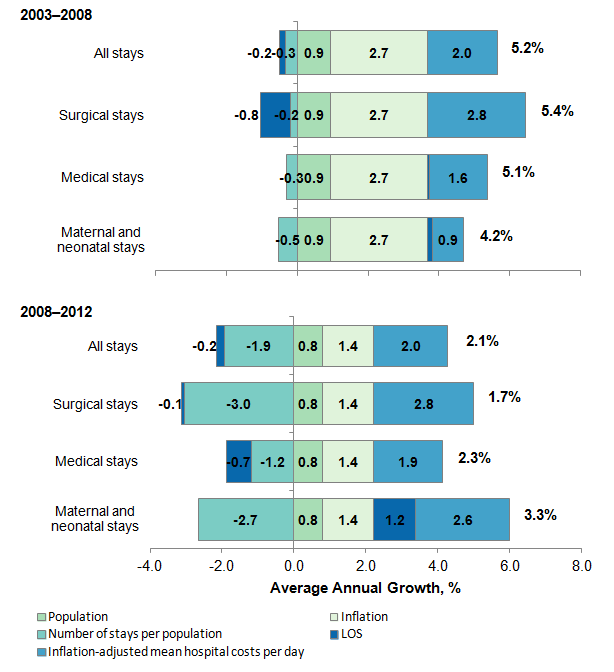
Components of growth in aggregate hospital costs by type of hospital stay, 2003-2012 Figure 3 presents the components of growth in aggregate hospital costs by type of stay for the 2003-2008 and 2008-2012 time periods. It differs from Table 1 in that it takes into account additional factors (inflation, changes in the number of stays per population, and population growth) that contribute to the increase in aggregate costs. In addition, Figure 3 decomposes the mean hospital costs per stay in Table 1 into mean costs per day and length of stay (LOS).4 Thus, growth in aggregate hospital costs was deconstructed into five components: population growth, change in number of stays per population, change in average LOS, growth in inflation-adjusted mean hospital costs per day, and inflation. Component-specific cost reductions are shown to the left of the center line (which denotes zero average annual growth), and component-specific cost increases are shown to the right of the center line. Overall growth in aggregate hospital costs (combining all five components) for each type of stay is shown in bold to the right of the bars. |
|
Figure 3. Factors accounting for growth in aggregate annual hospital costs by type of stay, 2003-2008 and 2008-2012
LOS: Length of stay Figure 3 is a bar chart that shows the extent to which population growth, the change in number of stays per population, the change in average length of stay, growth in inflation-adjusted mean hospital costs per day, and inflation accounted for growth in aggregate hospital costs for all stays, for surgical stays, for medical stays, and for maternal and neonatal stays, for the 2003-2008 and 2008-2012 time periods. For 2003-2008, factors accounting for growth in aggregate hospital costs for all stays: length of stay, -0.2%; number of stays per population, -0.3%; population growth, 0.9%; inflation, 2.7%; inflation-adjusted mean hospital costs per day, 2.0%, for a total growth in aggregate costs for all stays of 5.2%. Factors accounting for growth in aggregate hospital costs for surgical stays: length of stay, -0.8%, number of stays per population, -0.2%; population growth, 0.9%; inflation, 2.7%; inflation-adjusted mean hospital costs per day, 2.8%, for a total growth in aggregate costs for surgical stays of 5.4%. Factors accounting for growth in aggregate costs for medical stays: number of stays per population, -0.3%; population growth, 0.9%; inflation, 2.7%; length of stay, 0.1%; inflation-adjusted mean hospital costs per day, 1.6%, for a total growth in aggregate costs for medical stays of 5.1%. Factors accounting for growth in aggregate costs for maternal and neonatal stays: number of stays per population, -0.5%; population growth, 0.9%; inflation, 2.7%; length of stay, 0.1%; inflation-adjusted mean hospital costs, 0.9%, for a total growth in aggregate costs for maternal and neonatal stays of 4.2%. For 2008-2012, factors accounting for growth aggregate hospital costs for all stays: length of stay, -0.2%; number of stays per population -1.9%; population growth, 0.8%; inflation, 1.4%; inflation-adjusted mean hospital costs per day, 2.0%, for a total growth in aggregate costs for all stays of 2.1%. Factors accounting for growth in aggregate costs for surgical stays: length of stay, -0.1%, number of stays, -3.0%; population growth, 0.8%; inflation 1.4%; inflation-adjusted mean hospital costs per day, 2.8%, for a total growth in aggregate costs for surgical stays of 1.7%. Factors accounting for growth in aggregate costs for medical stays: length of stay, -0.7%; number of stays per population, -1.2%; population growth, 0.8%; inflation, 1.4%; inflation-adjusted mean hospital costs per day, 1.9%, for a total growth in aggregate costs for surgical stays of 2.3%. Factors accounting for growth in aggregate hospital costs for maternal and neonatal stays: number of stays per population, -2.7%; population growth, 0.8%; inflation, 1.4%; length of stay, 1.2%; inflation-adjusted mean hospital costs, 2.6%, for a total growth in aggregate costs for maternal and neonatal stays of 3.3%. Source: Agency for Healthcare Research and Quality (AHRQ), Center for Delivery, Organization, and Markets, Healthcare Cost and Utilization Project (HCUP), National (Nationwide) Inpatient Sample (NIS), 2003, 2008, and 2012. |
Data Source The estimates in this Statistical Brief are based upon data from the Healthcare Cost and Utilization Project (HCUP) 2012 National Inpatient Sample (NIS). Historical data were drawn from the 2003 and 2008 Nationwide Inpatient Sample (NIS). The statistics were generated from HCUPnet, a free, online query system that provides users with immediate access to the largest set of publicly available, all-payer national, regional, and State-level hospital care databases from HCUP.5 Supplemental sources included population denominator data for use with HCUP databases, derived from information available from the Bureau of the Census.6 The 2012 NIS was redesigned to optimize national estimates. The redesign incorporates two critical changes:
The new sampling strategy is expected to result in more precise estimates than those that resulted from the previous NIS design by reducing sampling error: for many estimates, confidence intervals under the new design are about half the length of confidence intervals under the previous design. The change in sample design for 2012 necessitates recomputation of prior years' NIS data to enable analysis of trends that uses the same definitions of discharges and hospitals. Many hypothesis tests were conducted for this Statistical Brief. Thus, to decrease the number of false-positive results, we reduced the significance level to .001 for individual tests. Definitions Diagnosis-related groups (DRGs) and major diagnostic categories (MDCs) DRGs comprise a patient classification system that categorizes patients into groups that are clinically coherent and homogeneous with respect to resource use. DRGs group patients according to diagnosis, type of treatment (procedure), age, and other relevant criteria. Each hospital stay has one assigned DRG. MDCs assign ICD-9-CM principal diagnosis codes to one of 25 general diagnosis categories. For this report, maternal hospital stays were identified using MDC 14 (pregnancy, childbirth, and the puerperium) and neonatal hospital stays were identified using MDC 15 (newborns and other neonates with conditions originating during the perinatal period). Surgical stays were defined as valid O.R. procedures on the basis of DRG coding principles. Stays other than maternal/neonatal stays or surgical stays were considered medical stays. Types of hospitals included in the HCUP National (Nationwide) Inpatient Sample The National (Nationwide) Inpatient Sample (NIS) is based on data from community hospitals, which are defined as short-term, non-Federal, general, and other hospitals, excluding hospital units of other institutions (e.g., prisons). The NIS includes obstetrics and gynecology, otolaryngology, orthopedic, cancer, pediatric, public, and academic medical hospitals. Excluded are long-term care facilities such as rehabilitation, psychiatric, and alcoholism and chemical dependency hospitals. Beginning in 2012, long-term acute care hospitals are also excluded. However, if a patient received long-term care, rehabilitation, or treatment for psychiatric or chemical dependency conditions in a community hospital, the discharge record for that stay will be included in the NIS. Unit of analysis The unit of analysis is the hospital discharge (i.e., the hospital stay), not a person or patient. This means that a person who is admitted to the hospital multiple times in 1 year will be counted each time as a separate discharge from the hospital. Costs and charges Total hospital charges were converted to costs using HCUP Cost-to-Charge Ratios based on hospital accounting reports from the Centers for Medicare & Medicaid Services (CMS).7 Costs reflect the actual expenses incurred in the production of hospital services, such as wages, supplies, and utility costs; charges represent the amount a hospital billed for the case. For each hospital, a hospital-wide cost-to-charge ratio is used. Hospital charges reflect the amount the hospital billed for the entire hospital stay and do not include professional (physician) fees. For the purposes of this Statistical Brief, costs are reported to the nearest hundred. Annual costs were inflation adjusted using the Gross Domestic Product (GDP) Price Index from the U.S. Department of Commerce, Bureau of Economic Analysis (BEA), with 2012 as the index base.8 That is, all costs are expressed in 2012 dollars. In general, costs for cases with a high proportion of ancillary charges (e.g., major surgery) tend to be overestimated using these cost-to-charge ratios, whereas costs for cases with a high proportion of room and board charges (e.g., tracheostomy, mental illness, premature newborns) tend to be underestimated.9 How HCUP estimates of costs differ from National Health Expenditure Accounts There are a number of differences between the costs cited in this Statistical Brief and spending as measured in the National Health Expenditure Accounts (NHEA), which are produced annually by the Centers for Medicare & Medicaid Services (CMS).10 The largest source of difference comes from the HCUP coverage of inpatient treatment only in contrast to the NHEA inclusion of outpatient costs associated with emergency departments and other hospital-based outpatient clinics and departments as well. The outpatient portion of hospitals’ activities has been growing steadily and may exceed half of all hospital revenue in recent years. On the basis of the American Hospital Association Annual Survey, 2012 outpatient gross revenues (or charges) were about 44 percent of total hospital gross revenues.11 Smaller sources of differences come from the inclusion in the NHEA of hospitals that are excluded from HCUP. These include Federal hospitals (Department of Defense, Veterans Administration, Indian Health Services, and Department of Justice [prison] hospitals) as well as psychiatric, substance abuse, and long-term care hospitals. A third source of difference lies in the HCUP reliance on billed charges from hospitals to payers, adjusted to provide estimates of costs using hospital-wide cost-to-charge ratios, in contrast to the NHEA measurement of spending or revenue. HCUP costs estimate the amount of money required to produce hospital services, including expenses for wages, salaries, and benefits paid to staff as well as utilities, maintenance, and other similar expenses required to run a hospital. NHEA spending or revenue measures the amount of income received by the hospital for treatment and other services provided, including payments by insurers, patients, or government programs. The difference between revenues and costs include profit for for-profit hospitals or surpluses for nonprofit hospitals. Average annual percentage change Average annual percentage change is calculated using the following formula: Average annual percentage change is calculated using the following formula: Average annual percentage change equals open bracket, open parenthesis, end value divided by beginning value, close parenthesis, to the power of 1 divided by change in years, minus 1, close bracket, multiplied by 100. Payer Payer is the expected primary payer for the hospital stay. To make coding uniform across all HCUP data sources, payer combines detailed categories into general groups:
Hospital stays billed to the State Children's Health Insurance Program (SCHIP) may be classified as Medicaid, Private Insurance, or Other, depending on the structure of the State program. Because most State data do not identify patients in SCHIP specifically, it is not possible to present this information separately. When more than one payer is listed for a hospital discharge, the first-listed payer is used. The Other group was dropped from results displaying differences by payer, with the exception of Figure 1, because of the difficulty interpreting results for such a heterogeneous group. About HCUP The Healthcare Cost and Utilization Project (HCUP, pronounced "H-Cup") is a family of databases and related software tools and products developed through a Federal-State-Industry partnership and sponsored by the Agency for Healthcare Research and Quality (AHRQ). HCUP databases bring together the data collection efforts of State data organizations, hospital associations, private data organizations, and the Federal government to create a national information resource of encounter-level data (HCUP Partners). HCUP includes the largest collection of longitudinal hospital care data in the United States, with all-payer, encounter-level information beginning in 1988. These databases enable research on a broad range of health policy issues, including cost and quality of health services, medical practice patterns, access to programs, and outcomes of treatments at the national, State, and local market levels. HCUP would not be possible without the contributions of the following data collection Partners from across the United States: Alaska State Hospital and Nursing Home Association Arizona Department of Health Services Arkansas Department of Health California Office of Statewide Health Planning and Development Colorado Hospital Association Connecticut Hospital Association Florida Agency for Health Care Administration Georgia Hospital Association Hawaii Health Information Corporation Illinois Department of Public Health Indiana Hospital Association Iowa Hospital Association Kansas Hospital Association Kentucky Cabinet for Health and Family Services Louisiana Department of Health and Hospitals Maine Health Data Organization Maryland Health Services Cost Review Commission Massachusetts Center for Health Information and Analysis Michigan Health & Hospital Association Minnesota Hospital Association Mississippi Department of Health Missouri Hospital Industry Data Institute Montana MHA - An Association of Montana Health Care Providers Nebraska Hospital Association Nevada Department of Health and Human Services New Hampshire Department of Health & Human Services New Jersey Department of Health New Mexico Department of Health New York State Department of Health North Carolina Department of Health and Human Services North Dakota (data provided by the Minnesota Hospital Association) Ohio Hospital Association Oklahoma State Department of Health Oregon Association of Hospitals and Health Systems Oregon Health Policy and Research Pennsylvania Health Care Cost Containment Council Rhode Island Department of Health South Carolina Revenue and Fiscal Affairs Office South Dakota Association of Healthcare Organizations Tennessee Hospital Association Texas Department of State Health Services Utah Department of Health Vermont Association of Hospitals and Health Systems Virginia Health Information Washington State Department of Health West Virginia Health Care Authority Wisconsin Department of Health Services Wyoming Hospital Association About Statistical Briefs HCUP Statistical Briefs are descriptive summary reports presenting statistics on hospital inpatient and emergency department use and costs, quality of care, access to care, medical conditions, procedures, patient populations, and other topics. The reports use HCUP administrative data. About the NIS The HCUP National (Nationwide) Inpatient Sample (NIS) is a national (nationwide) database of hospital inpatient stays. The NIS is nationally representative of all community hospitals (i.e., short-term, non-Federal, nonrehabilitation hospitals). The NIS is a sample of hospitals and includes all patients from each hospital, regardless of payer. It is drawn from a sampling frame that contains hospitals comprising more than 95 percent of all discharges in the United States. The vast size of the NIS allows the study of topics at the national and regional levels for specific subgroups of patients. In addition, NIS data are standardized across years to facilitate ease of use. About HCUPnet HCUPnet is an online query system that offers instant access to the largest set of all-payer databases that are publicly available. HCUPnet has an easy step-by-step query system that creates tables and graphs of national and regional statistics as well as data trends for community hospitals in the United States. HCUPnet generates statistics using data from HCUP's National (Nationwide) Inpatient Sample (NIS), the Kids' Inpatient Database (KID), the Nationwide Emergency Department Sample (NEDS), the State Inpatient Databases (SID), and the State Emergency Department Databases (SEDD). For More Information For more information about HCUP, visit http://www.hcup-us.ahrq.gov/. For additional HCUP statistics, visit HCUPnet, our interactive query system, at https://datatools.ahrq.gov/hcupnet. For information on other hospitalizations in the United States, refer to the following HCUP Statistical Briefs located at http://www.hcup-us.ahrq.gov/reports/statbriefs/statbriefs.jsp:
For a detailed description of HCUP and more information on the design of the National (Nationwide) Inpatient Sample (NIS), please refer to the following database documentation: Agency for Healthcare Research and Quality. Overview of the National (Nationwide) Inpatient Sample (NIS). Healthcare Cost and Utilization Project (HCUP). Rockville, MD: Agency for Healthcare Research and Quality. Updated July 2014. http://www.hcup-us.ahrq.gov/nisoverview.jsp. Accessed September 11, 2014. Suggested Citation Moore B (Truven Health Analytics), Levit K (Truven Health Analytics), Elixhauser A (AHRQ). Costs for Hospital Stays in the United States, 2012. HCUP Statistical Brief #181. October 2014. Agency for Healthcare Research and Quality, Rockville, MD. http://www.hcup-us.ahrq.gov/reports/statbriefs/sb181-Hospital-Costs-United-States-2012.pdf. *** AHRQ welcomes questions and comments from readers of this publication who are interested in obtaining more information about access, cost, use, financing, and quality of in the United States. We also invite you to tell us how you are using this Statistical Brief and other HCUP data and tools, and to share suggestions on how HCUP products might be enhanced to further meet your needs. Please e-mail us at hcup@ahrq.gov or send a letter to the address below:Irene Fraser, Ph.D., Director Center for Delivery, Organization, and Markets Agency for Healthcare Research and Quality 540 Gaither Road Rockville, MD 20850 1 Centers for Medicare & Medicaid Services. National Health Expenditures 2012 Highlights. http://www.cms.gov/Research-Statistics-Data-and-Systems/Statistics-Trends-and-Reports/NationalHealthExpendData/downloads/highlights.pdf. Accessed April 14, 2014. 2 Gonzalez JM. National Health Care Expenses in the U.S. Civilian Noninstitutionalized Population, 2011. Statistical Brief #425. November 2013. Agency for Healthcare Research and Quality, Rockville, MD. http://www.meps.ahrq.gov/mepsweb/data_files/publications/st425/stat425.shtml. Accessed April 22, 2014. 3 Estimates of cost in this Statistical Brief differ from the National Health Expenditure Accounts (NHEA) produced annually by the Centers for Medicare & Medicaid Services (CMS). These differences include the following: (1) HCUP covers only hospital inpatient treatment, whereas the NHEA include hospital outpatient treatment as well (emergency departments, outpatient clinics, and other outpatient departments); (2) HCUP excludes Federal, psychiatric, substance abuse, and long-term care hospitals, whereas the NHEA include those hospitals; and (3) HCUP is based on billed charges, which are converted to estimates of the costs of producing hospital services using hospital-wide cost-to-charge ratios, whereas the NHEA reports revenue or income. For more details, see How HCUP estimates of costs differ from National Health Expenditure Accounts in the Definitions section. 4 Average annual growth in inflation-adjusted mean hospital costs per day in Figure 3 was 2.0 percent for both time periods. The average annual change in length of stay for both time periods was -0.2 percent, a slight decline. These two numbers combined reflect the average annual change in inflation-adjusted mean hospital costs shown in Table 1 (1.8 percent). 5 Agency for Healthcare Research and Quality. HCUPnet website. https://datatools.ahrq.gov/hcupnet. Accessed September 11, 2014. 6 Barrett M, Lopez-Gonzalez L, Coffey R, Levit K. Population Denominator Data for Use with the HCUP Databases (Updated with 2013 Population Data). HCUP Methods Series Report #2014-02. August 18, 2014. U.S. Agency for Healthcare Research and Quality. http://www.hcup-us.ahrq.gov/reports/methods/2014-02.pdf. Accessed September 11, 2014. 7 Agency for Healthcare Research and Quality. HCUP Cost-to-Charge Ratio (CCR) Files. Healthcare Cost and Utilization Project (HCUP). 2001-2011. Rockville, MD: Agency for Healthcare Research and Quality. Updated August 2014. http://www.hcup-us.ahrq.gov/db/state/costtocharge.jsp. Accessed September 11, 2014. 8 U.S. Bureau of Economic Analysis. National Income and Product Account Tables, Table 1.1.4 Price Indexes for Gross Domestic Product. http://www.bea.gov/iTable/iTable.cfm?ReqID=9&step=1#reqid=9&step=1&isuri=1. Accessed March 20, 2014. 9 Sun Y, Friedman B. Tools for More Accurate Inpatient Cost Estimates With HCUP Databases, 2009. Errata added October 25, 2012. 2012. HCUP Methods Series Report # 2011-04. October 29, 2012. Rockville, MD: Agency for Healthcare Research and Quality. http://www.hcup-us.ahrq.gov/reports/methods/methods.jsp. Accessed August 22, 2014. 10 For additional information about the NHEA, see Centers for Medicare & Medicaid Services (CMS). National Health Expenditure Data. CMS website May 2014. http://www.cms.gov/Research-Statistics-Data-and-Systems/Statistics-Trends-and-Reports/NationalHealthExpendData/index.html?redirect=/NationalHealthExpendData/. Accessed October 9, 2014. 11 American Hospital Association. TrendWatch Chartbook, 2014. Table 4.2. Distribution of Inpatient vs. Outpatient Revenues, 1992-2012. Original source is no longer available on the Web; for related information refer to TrendWatch Chartbook, 2018. Table 4.2. Distribution of Inpatient vs. Outpatient Revenues, 1995-2016. www.aha.org/system/files/2018-05/2018-chartbook-table-4-2.pdf. |