STATISTICAL BRIEF #180 |
October 2014
Audrey J. Weiss, Ph.D. and Anne Elixhauser, Ph.D. Introduction Hospital inpatient care constitutes almost one-third of all expenditures in the United States.1 Overall, hospitalizations affect a large proportion of Americans directly and represent a significant impact to the U.S economy. Although general population growth and a higher prevalence of chronic health conditions suggest that hospital utilization may increase over time, particularly among some groups, greater use of chronic disease management programs and emphasis on outpatient treatment may result in a declining trend in hospital stays. This Statistical Brief presents data from the Healthcare Cost and Utilization Project (HCUP) on characteristics of inpatient stays in U.S. community hospitals in 2012. The distribution of type of hospital stay (surgical, medical, and maternal or neonatal) is presented for different characteristics (patient age, primary payer, and hospital region). Changes in hospital utilization and costs from 2003 to 2012 are provided, along with changes in hospital utilization by primary payer and patient age. All differences between mean estimates noted in the text are statistically significant at the 0.0005 level or better. Differences between proportions noted in the text differ by at least 10 percent. |
|
Findings
Characteristics of hospital stays, 2012 Table 1 presents utilization and cost data for hospital inpatient stays in 2012 by selected patient and hospital characteristics. |
| Table 1. Number and rate of hospital stays, length of stay, and costs by patient, payer, community income, and hospital characteristics, 2012 | ||||||
| Characteristic | Hospital stays | Mean length of stay, days | Costs | |||
|---|---|---|---|---|---|---|
| Number, thousands | Percent | Rate per 1,000 population | Mean cost per stay, $ | Aggregate, millions $ | ||
| All hospital stays | 36,500 | 100 | 116.2 | 4.5 | 10,400 | 377,455 |
| Patient age, years | ||||||
| <1 | 4,300 | 11.7 | 1,070.9 | 3.8 | 5,000 | 21,101 |
| 1-17 | 1,500 | 4.0 | 21.1 | 3.9 | 9,900 | 14,635 |
| 18-44 | 9,000 | 24.7 | 78.9 | 3.6 | 7,600 | 68,425 |
| 45-64 | 9,000 | 24.7 | 108.8 | 4.9 | 12,900 | 116,075 |
| 65-84 | 9,700 | 26.7 | 260.9 | 5.2 | 13,000 | 126,573 |
| 85+ | 3,000 | 8.2 | 502.0 | 5.2 | 10,200 | 30,512 |
| Patient sex | ||||||
| Male | 15,400 | 42.3 | 99.9 | 4.8 | 11,700 | 180,587 |
| Female | 21,000 | 57.7 | 132.0 | 4.3 | 9,400 | 196,833 |
| Primary payera | ||||||
| Medicare | 14,300 | 39.1 | n/a | 5.2 | 12,200 | 174,609 |
| Medicaid | 7,600 | 20.9 | n/a | 4.3 | 8,100 | 61,679 |
| Private insurance | 11,200 | 30.6 | n/a | 3.8 | 9,700 | 107,807 |
| Uninsured | 2,000 | 5.6 | n/a | 4.0 | 8,800 | 18,056 |
| Community incomeb | ||||||
| Low | 10,900 | 30.0 | 136.8 | 4.6 | 9,700 | 105,981 |
| Not low | 24,700 | 67.8 | 106.1 | 4.4 | 10,600 | 262,789 |
| Hospital region | ||||||
| Northeast | 7,000 | 19.1 | 125.2 | 4.9 | 10,800 | 75,146 |
| Midwest | 8,200 | 22.6 | 122.4 | 4.3 | 10,200 | 84,140 |
| South | 14,100 | 38.7 | 120.4 | 4.5 | 9,300 | 131,635 |
| West | 7,200 | 19.6 | 97.2 | 4.2 | 12,300 | 86,533 |
| a Population rates are not available by primary payer. b Patients in the first quartile are designated as llow income, and patients in the upper three quartiles are designated as not low income. Source: Agency for Healthcare Research and Quality (AHRQ), Center for Delivery, Organization, and Markets, Healthcare Cost and Utilization Project (HCUP), National Inpatient Sample (NIS), 2012 | ||||||
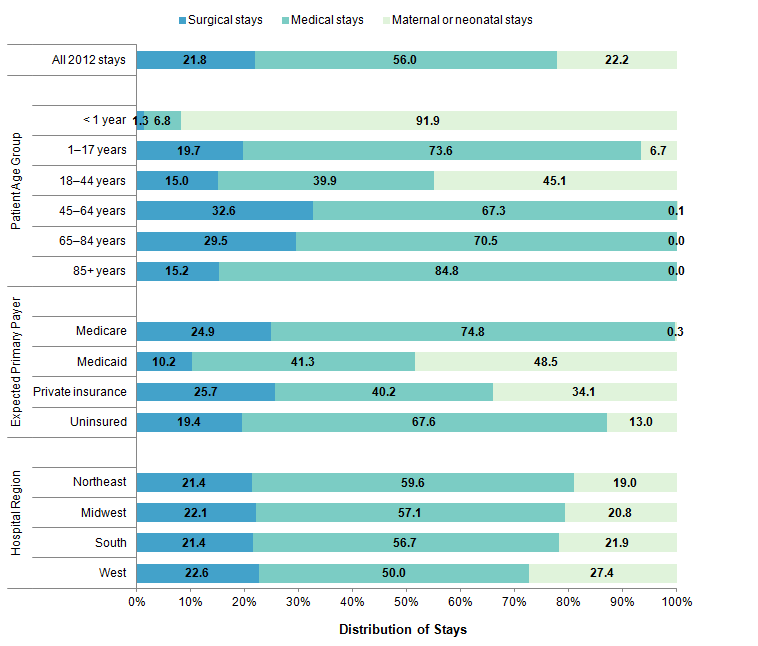
Figure 1 provides the distribution of hospital stays by patient age, primary payer, and hospital region, comparing each subgroup by type of stay—surgical, medical, and maternal or neonatal. |
|
Figure 1. Distribution of inpatient stays by patient age group, primary payer, hospital region, and type of stay, 2012
Source: Agency for Healthcare Research and Quality (AHRQ), Center for Delivery, Organization, and Markets, Healthcare Cost and Utilization Project (HCUP), National Inpatient Sample (NIS), 2012 Figure 1 is a bar chart that shows how hospital stays are distributed among surgical, medical, and material or neonatal stays. This distribution is split out by age group, by insurance payer, and by hospital region. Of all stays, 21.8% were surgical, 56.0% were medical, and 22.2% were maternal or neonatal. For patients that were younger than 1 year, 1.3% were surgical stays, 6.8% were medical stays, and 91.9% were maternal or neonatal stays. For patients that were between 1 and 17 years old, 19.7% were surgical stays, 73.6% were medical stays, and 6.7% were maternal or neonatal stays. For patients that were between 18 and 44 years old, 15.0% were surgical stays, 39.9% were medical stays, and 45.1% were maternal or neonatal stays. For patients who were between 45 and 64 years old, 32.6% were surgical stays, 67.3% were medical stays, and 0.1% were maternal or neonatal stays. For those who were between 65 and 84 years old, 29.5% were surgical stays, 70.5% were medical stays, and 0.0% were maternal or neonatal stays. For patients who were older than 85 years, 15.2% were surgical stays, 84.8% were medical stays, and 0.0% were maternal or neonatal stays. For stays that were paid for by Medicare, 24.9% were surgical stays, 74.8% were medical stays, and 0.3% were maternal or neonatal stays. For those that were paid for by Medicaid, 0.2% were surgical stays, 41.3% were medical stays, and 48.5% were maternal or neonatal stays. For stays that were covered by primary insurance, 25.7% were surgical stays, 40.1% were medical stays, and 34.1% were maternal or neonatal stays. For stays of patients who were uninsured, 19.4% were surgical stays, 67.6% were medical stays, and 13.0% were maternal or neonatal stays. For hospitals in the Northeast, 21.4% were surgical stays, 59.6% were medical stays, and 19.0% were maternal or neonatal stays. For hospitals that were in the Midwest, 22.1% were surgical stays, 57.1% were medical stays, and 20.8% were maternal or neonatal stays. For hospitals that were in the South, 21.4% were surgical stays, 56.7% were medical stays, and 21.9% were maternal or neonatal stays, For hospitals that were in the West, 22.6% were surgical stays, 50.0% were medical stays, and 27.4% were maternal or neonatal stays. Source: Agency for Healthcare Research and Quality (AHRQ), Center for Delivery, Organization, and Markets, Healthcare Cost and Utilization Project (HCUP), National Inpatient Sample (NIS), 2012. |
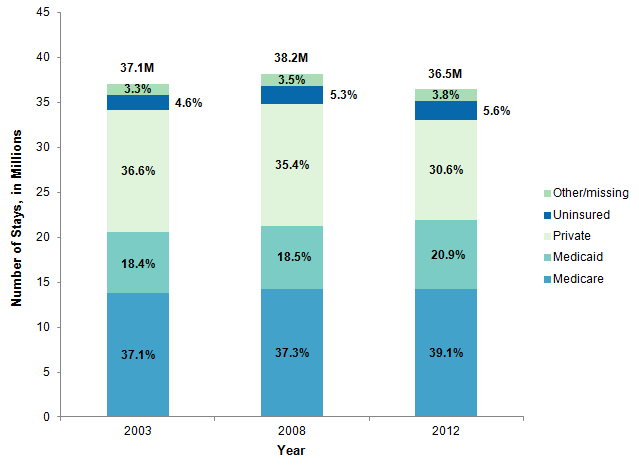
Figure 2 presents the distribution of hospital stays by primary payer for 2012 and for 2 prior years (2003 and 2008), covering a 10-year time period. |
|
Figure 2. Distribution of inpatient stays by primary payer, 2003, 2008, and 2012
Source: Agency for Healthcare Research and Quality (AHRQ), Center for Delivery, Organization, and Markets, Healthcare Cost and Utilization Project (HCUP), National (Nationwide) Inpatient Sample (NIS), 2003, 2008, 2012 Figure 2 is a bar chart that shows the distribution of hospital stays by insurance payer, for 2003, 2008, and 2012. In 2003, 37.1% of hospital stays were covered by Medicare, 18.4% of stays were covered by Medicaid, 36.6% of stays were covered by private insurance, 4.6% of stays were for uninsured individuals, and insurance records for the remaining 3.3% were marked as Other or Missing. In 2008, 37.3% of hospital stays were covered by Medicare, 18.5% of stays were covered by Medicaid, 35.4% of stays were covered by private insurance, 5.3% of stays were for uninsured individuals, and insurance records for the remaining 3.5% were marked as Other or Missing. In 2012, 39.1% of hospital stays were covered by Medicare, 20.9% of stays were covered by Medicaid, 30.6% of stays were covered by private insurance, 5.6% of stays were for uninsured individuals, and insurance records for the remaining 3.8% wre marked as Other or Missing. Source: Agency for Healthcare Research and Quality (AHRQ), Center for Delivery, Organization, and Markets, Healthcare Cost and Utilization Project (HCUP), National (Nationwide) Inpatient Sample (NIS), 2003, 2008, 2012. |
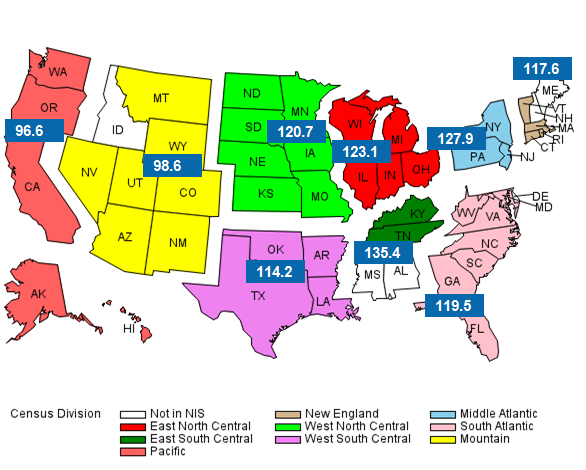
Figure 3 presents the rate of hospital inpatient stays across the nine U.S. Census divisions in 2012. |
|
Figure 3. Rate of inpatient stays per 1,000 population by U.S. Census division, 2012
Source: Agency for Healthcare Research and Quality (AHRQ), Center for Delivery, Organization, and Markets, Healthcare Cost and Utilization Project (HCUP), National Inpatient Sample (NIS), 2012 Figure 3 is a map of the United States split into nine color-coded Census divisions. Idaho, Mississippi, and Alabama are not in the National Inpatient Sample and were excluded from the analysis. The rate of inpatient stays (which is the number of hospital stays for each 1,000 people residing in that region) is shown for each Census region. For the East North Central Census division, there were 123.1 hospital stays per 1,000 population. For the East South Central Census division, there were 135.4 hospital stays per 1,000 population. For the Pacific Census division, there were 96.6 hospital stays per 1,000 population. For the New England Census division, there were 117.6 hospital stays per 1,000 population. For the West North Central Census division, there were 120.7 hospital stays per 1,000. For the West South Central Census division, there were 114.2 hospital stays per 1,000. For the Middle Atlantic Census division, there were 127.9 hospital stays per 1,000. For the South Atlantic Census division, there were 119.5 hospital stays per 1,000. For the Mountain Census division, there were 98.6 hospital stays per 1,000. Source: Agency for Healthcare Research and Quality (AHRQ), Center for Delivery, Organization, and Markets, Healthcare Cost and Utilization Project (HCUP), National Inpatient Sample (NIS), 2012. |
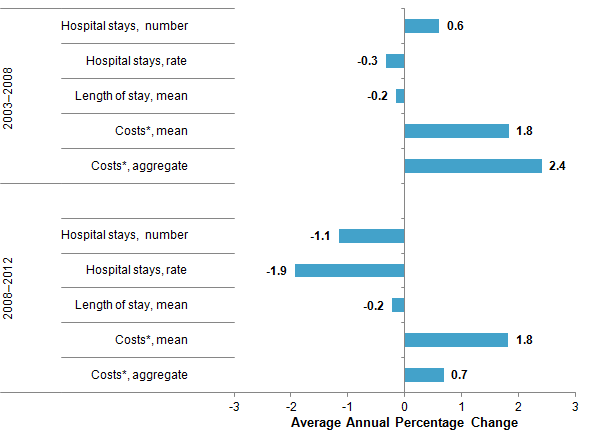
Changes in utilization and costs of hospital stays, 2003-2012 Figure 4 presents overall changes in utilization and costs associated with hospital inpatient stays. |
|
Figure 4. Average annual percentage change in hospital inpatient utilization and inflation-adjusted costs, 2003-2008 and 2008-2012
* Growth in mean and aggregate hospital costs was calculated using inflation-adjusted costs. Figure 4 is a bar chart that shows the percentage change in number of hospital stays, rate of hospital stays (that is, number of stays per 1,000 population), average length of stay, average cost per stay, and aggregate cost, for both the 2003 to 2008 and the 2008 to 2012 time periods. For 2003 to 2008, the change in number of hospital stays was 0.6%, the change in rate of hospital stays was -0.3%, the change in average length of hospital stay was -0.2%, the change in average cost per stay was 1.8%, and the change in aggregate costs of hospital stays was 2.4%. For 2008 to 2012, the change in number of hospital stays was -1.1%, the change in rate of hospital stays was 1.9%, the change in average length of hospital stay was -0.2%, the change in average cost per stay was 1.8%, and the change in aggregate costs of hospital stays was 0.7%. Source: Agency for Healthcare Research and Quality (AHRQ), Center for Delivery, Organization, and Markets, Healthcare Cost and Utilization Project (HCUP), National (Nationwide) Inpatient Sample (NIS), 2003, 2008, 2012. |
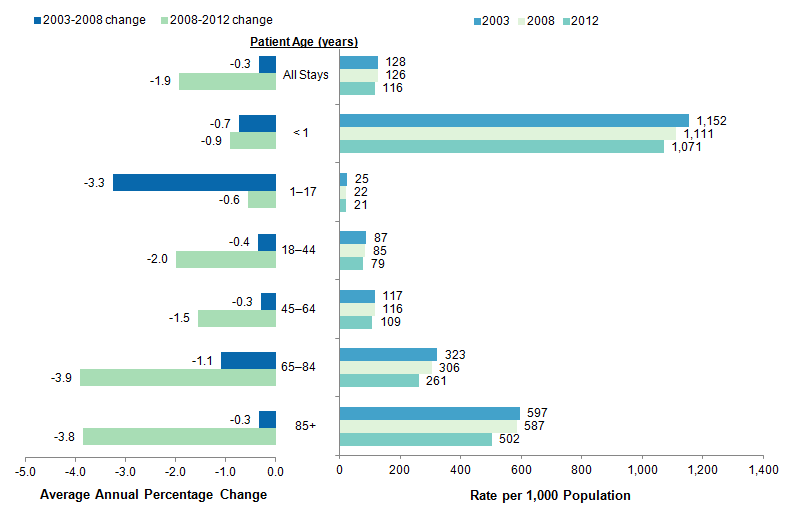
Figure 5 presents the rate of stays by patient age for 2003, 2008, and 2012, along with the average annual percentage change for two consecutive 5-year time periods (2003-2008 and 2008-2012). |
|
Figure 5. Rate of inpatient stays and change over time by patient age, 2003-2012
Note: Data from 2008 were used as end points in both the 2003-2008 and the 2008-2012 analyses. Figure 5 is a bar chart that shows the average annual percentage change in the rate of hospital stays by age group for the 2003 to 2008 and the 2008 to 2012 time periods. It also shows the number of hospital stays per 1,000 population by age group in 2003, 2008, and 2012. The average annual percentage change for all stays was -0.3% for 2003 to 2008 and -1.9% for 2008 to 2012. Broken down by age group, average annual percentage change for patients younger than 1 year was -0.7% for 2003 to 2008 and -0.9% for 2008 to 2012, for patients between 1 and 17 years old it was -3.3% for 2003 to 2008 and -0.6% for 2008 to 2012, for patients between 18 and 44 years old it was -0.4% for 2003 to 2008 and -2.0% for 2008 to 2012, for patients between 45 and 64 years old it was -0.3% for 2003 to 2008 and -1.5% for 2008 to 2012, for patients between 65 and 84 years old it was -1.1% for 2003 to 2008 and -3.9% for 2008 to 2012, and for patients older than 85 years it was -0.3% for 2003 to 2008 and -3.8% for 2008 to 2012. The rate of inpatient stays for 2003, 2008, and 2012 broken down by age group as follows: for all stays, 128 for 2003, 126 for 2008, and 116 for 2012; for patients younger than 1 year, 1,152 for 2003, 1,111 for 2008, and 1,071 for 2012; for patients between 1 and 17 years old, 25 for 2003, 22, for 2008, and 21 for 2009; for patients between 18 and 44 years old, 87 for 2003, 85 for 2008, and 79 for 2012; for patients between 45 and 64 years old, 117 for 2003, 116 for 2008, and 109 for 2012; for patients between 65 and 84 years old, 323 for 2003, 306 for 2008, and 261 for 2012; and for patients older than 85 years, 597 for 2003, 587 for 2008, and 502 for 2012. Source: Agency for Healthcare Research and Quality (AHRQ), Center for Delivery, Organization, and Markets, Healthcare Cost and Utilization Project (HCUP), National (Nationwide) Inpatient Sample (NIS), 2003, 2008, 2012. |
Data Source The estimates in this Statistical Brief are based upon data from the Healthcare Cost and Utilization Project (HCUP) 2012 National Inpatient Sample (NIS). Historical data were drawn from the 2003 and 2008 Nationwide Inpatient Sample (NIS). The statistics were generated from HCUPnet, a free, online query system that provides users with immediate access to the largest set of publicly available, all-payer national, regional, and State-level hospital care databases from HCUP.2 The 2012 NIS was redesigned to optimize national estimates. The redesign incorporates two critical changes:
The new sampling strategy is expected to result in more precise estimates than did the previous NIS design by reducing sampling error: for many estimates, confidence intervals under the new design are about half the length of confidence intervals under the previous design. The change in sample design for 2012 necessitates recomputation of prior years' NIS data to enable analysis of trends that uses the same definitions of discharges and hospitals. This is the first Statistical Brief that reports data from the 2012 NIS. Many hypothesis tests were conducted for this Statistical Brief. Thus, to decrease the number of false—positive results, we reduced the significance level to 0.0005 for individual tests. Definitions Diagnoses, ICD-9-CM, major diagnostic categories (MDCs), and diagnosis-related groups (DRGs) The principal diagnosis is that condition established after study to be chiefly responsible for the patient's admission to the hospital. Secondary diagnoses are concomitant conditions that coexist at the time of admission or develop during the stay. ICD-9-CM is the International Classification of Diseases, Ninth Revision, Clinical Modification, which assigns numeric codes to diagnoses and procedures. There are approximately 14,000 ICD-9-CM diagnosis codes and approximately 4,000 ICD-9-CM procedure codes. MDCs assign ICD-9-CM principal diagnosis codes to one of 25 general diagnosis categories. For this report, maternal hospital stays were identified using MDC 14 (pregnancy, childbirth, and the puerperium) and neonatal hospital stays were identified using MDC 15 (newborns and other neonates with conditions originating during the perinatal period). DRGs comprise a patient classification system that categorizes patients into groups that are clinically coherent and homogeneous with respect to resource use. DRGs group patients according to diagnosis, type of treatment (procedure), age, and other relevant criteria. Each hospital stay has one assigned DRG. For this report, surgical stays were defined as valid O.R. procedures on the basis of DRG coding principles. Stays other than maternal/neonatal stays or surgical stays were considered medical stays. Types of hospitals included in the HCUP National (Nationwide) Inpatient Sample The National (Nationwide) Inpatient Sample (NIS) is based on data from community hospitals, which are defined as short-term, non-Federal, general, and other hospitals, excluding hospital units of other institutions (e.g., prisons). The NIS includes obstetrics and gynecology, otolaryngology, orthopedic, cancer, pediatric, public, and academic medical hospitals. Excluded are long-term care facilities such as rehabilitation, psychiatric, and alcoholism and chemical dependency hospitals. Beginning in 2012, long-term acute care hospitals are also excluded. However, if a patient received long-term care, rehabilitation, or treatment for psychiatric or chemical dependency conditions in a community hospital, the discharge record for that stay will be included in the NIS. Unit of analysis The unit of analysis is the hospital discharge (i.e., the hospital stay), not a person or patient. This means that a person who is admitted to the hospital multiple times in 1 year will be counted each time as a separate discharge from the hospital. Costs and charges Total hospital charges were converted to costs using HCUP Cost-to-Charge Ratios based on hospital accounting reports from the Centers for Medicare & Medicaid Services (CMS).3 Costs reflect the actual expenses incurred in the production of hospital services, such as wages, supplies, and utility costs; charges represent the amount a hospital billed for the case. For each hospital, a hospital-wide cost-to-charge ratio is used. Hospital charges reflect the amount the hospital billed for the entire hospital stay and do not include professional (physician) fees. For the purposes of this Statistical Brief, costs are reported to the nearest hundred. Annual costs were inflation adjusted using the Gross Domestic Product (GDP) from the U.S. Department of Commerce, Bureau of Economic Analysis (BEA), with 2012 as the index base.4 That is, all costs are expressed in 2012 dollars. Average annual percentage change Average annual percentage change is calculated using the following formula: Average annual percentage change is calculated using the following formula: Average annual percentage change equals open bracket, open parenthesis, end value divided by beginning value, close parenthesis, to the power of 1 divided by change in years, minus 1, close bracket, multiplied by 100. Median community-level income Median community-level income is the median household income of the patient' s ZIP Code of residence. Income levels are separated into quartiles with cut-offs determined using ZIP Code demographic data obtained from the Nielsen Company. Patients in the first quartile are designated as having low income, and patients in the upper three quartiles are designated as having not low income. The income quartile is missing for patients who are homeless or foreign. Payer Payer is the expected primary payer for the hospital stay. To make coding uniform across all HCUP data sources, payer combines detailed categories into general groups:
Hospital stays billed to the State Children's Health Insurance Program (SCHIP) may be classified as Medicaid, Private Insurance, or Other, depending on the structure of the State program. Because most State data do not identify patients in SCHIP specifically, it is not possible to present this information separately. When more than one payer is listed for a hospital discharge, the first-listed payer is used. Region Region is one of the four regions defined by the U.S. Census Bureau:
About HCUP The Healthcare Cost and Utilization Project (HCUP, pronounced "H-Cup") is a family of databases and related software tools and products developed through a Federal-State-Industry partnership and sponsored by the Agency for Healthcare Research and Quality (AHRQ). HCUP databases bring together the data collection efforts of State data organizations, hospital associations, private data organizations, and the Federal government to create a national information resource of encounter-level data (HCUP Partners). HCUP includes the largest collection of longitudinal hospital care data in the United States, with all-payer, encounter-level information beginning in 1988. These databases enable research on a broad range of health policy issues, including cost and quality of health services, medical practice patterns, access to programs, and outcomes of treatments at the national, State, and local market levels. HCUP would not be possible without the contributions of the following data collection Partners from across the United States: Alaska State Hospital and Nursing Home Association Arizona Department of Health Services Arkansas Department of Health California Office of Statewide Health Planning and Development Colorado Hospital Association Connecticut Hospital Association Florida Agency for Health Care Administration Georgia Hospital Association Hawaii Health Information Corporation Illinois Department of Public Health Indiana Hospital Association Iowa Hospital Association Kansas Hospital Association Kentucky Cabinet for Health and Family Services Louisiana Department of Health and Hospitals Maine Health Data Organization Maryland Health Services Cost Review Commission Massachusetts Center for Health Information and Analysis Michigan Health & Hospital Association Minnesota Hospital Association Mississippi Department of Health Missouri Hospital Industry Data Institute Montana MHA - An Association of Montana Health Care Providers Nebraska Hospital Association Nevada Department of Health and Human Services New Hampshire Department of Health & Human Services New Jersey Department of Health New Mexico Department of Health New York State Department of Health North Carolina Department of Health and Human Services North Dakota (data provided by the Minnesota Hospital Association) Ohio Hospital Association Oklahoma State Department of Health Oregon Association of Hospitals and Health Systems Oregon Health Policy and Research Pennsylvania Health Care Cost Containment Council Rhode Island Department of Health South Carolina Revenue and Fiscal Affairs Office South Dakota Association of Healthcare Organizations Tennessee Hospital Association Texas Department of State Health Services Utah Department of Health Vermont Association of Hospitals and Health Systems Virginia Health Information Washington State Department of Health West Virginia Health Care Authority Wisconsin Department of Health Services Wyoming Hospital Association About Statistical Briefs HCUP Statistical Briefs are descriptive summary reports presenting statistics on hospital inpatient and emergency department use and costs, quality of care, access to care, medical conditions, procedures, patient populations, and other topics. The reports use HCUP administrative data. About the NIS The HCUP National (Nationwide) Inpatient Sample (NIS) is a national (nationwide) database of hospital inpatient stays. The NIS is nationally representative of all community hospitals (i.e., short-term, non-Federal, nonrehabilitation hospitals). The NIS is a sample of hospitals and includes all patients from each hospital, regardless of payer. It is drawn from a sampling frame that contains hospitals comprising more than 95 percent of all discharges in the United States. The vast size of the NIS allows the study of topics at the national and regional levels for specific subgroups of patients. In addition, NIS data are standardized across years to facilitate ease of use. About HCUPnet HCUPnet is an online query system that offers instant access to the largest set of all-payer databases that are publicly available. HCUPnet has an easy step-by-step query system that creates tables and graphs of national and regional statistics as well as data trends for community hospitals in the United States. HCUPnet generates statistics using data from HCUP's National (Nationwide) Inpatient Sample (NIS), the Kids' Inpatient Database (KID), the Nationwide Emergency Department Sample (NEDS), the State Inpatient Databases (SID), and the State Emergency Department Databases (SEDD). For More Information For more information about HCUP, visit http://www.hcup-us.ahrq.gov/. For additional HCUP statistics, visit HCUPnet, our interactive query system, at https://datatools.ahrq.gov/hcupnet. For information on other hospitalizations in the United States, refer to the following HCUP Statistical Briefs located at http://www.hcup-us.ahrq.gov/reports/statbriefs/statbriefs.jsp:
For a detailed description of HCUP and more information on the design of the National (Nationwide) Inpatient Sample (NIS), please refer to the following database documentation: Agency for Healthcare Research and Quality. Overview of the National (Nationwide) Inpatient Sample (NIS). Healthcare Cost and Utilization Project (HCUP). Rockville, MD: Agency for Healthcare Research and Quality. Updated July 2014. http://www.hcup-us.ahrq.gov/nisoverview.jsp. Accessed September 11, 2014. Suggested Citation Weiss AJ (Truven Health Analytics), Elixhauser A (AHRQ). Overview of Hospital Stays in the United States, 2012. HCUP Statistical Brief #180. October 2014. Agency for Healthcare Research and Quality, Rockville, MD. http://www.hcup-us.ahrq.gov/reports/statbriefs/sb180-Hospitalizations-United-States-2012.pdf. *** AHRQ welcomes questions and comments from readers of this publication who are interested in obtaining more information about access, cost, use, financing, and quality of in the United States. We also invite you to tell us how you are using this Statistical Brief and other HCUP data and tools, and to share suggestions on how HCUP products might be enhanced to further meet your needs. Please e-mail us at hcup@ahrq.gov or send a letter to the address below:Irene Fraser, Ph.D., Director Center for Delivery, Organization, and Markets Agency for Healthcare Research and Quality 540 Gaither Road Rockville, MD 20850 1 Gonzalez JM. National Health Care Expenses in the U.S. Civilian Noninstitutionalized Population, 2011. MEPS Statistical Brief No. 425. Rockville, MD: Agency for Healthcare Research and Quality, 2013. http://meps.ahrq.gov/data_files/publications/st425/stat425.pdf. Accessed March 28, 2014. 2 Agency for Healthcare Research and Quality. HCUPnet website. https://datatools.ahrq.gov/hcupnet. Accessed September 11, 2014. 3 Agency for Healthcare Research and Quality. HCUP Cost-to-Charge Ratio (CCR) Files. Healthcare Cost and Utilization Project (HCUP). 2001-2011. Rockville, MD: Agency for Healthcare Research and Quality. Updated August 2014. http://www.hcup-us.ahrq.gov/db/state/costtocharge.jsp. Accessed September 11, 2014. 4 U.S. Bureau of Economic Analysis. National Income and Product Account Tables, Table 1.1.4 Price Indexes for Gross Domestic Product. http://www.bea.gov/iTable/iTable.cfm?ReqID=9&step=1#reqid=9&step=1&isuri=1. Accessed March 20, 2014. |
| Internet Citation: Statistical Brief #180. Healthcare Cost and Utilization Project (HCUP). September 2014. Agency for Healthcare Research and Quality, Rockville, MD. hcup-us.ahrq.gov/reports/statbriefs/sb180-Hospitalizations-United-States-2012.jsp. |
| Are you having problems viewing or printing pages on this website? |
| If you have comments, suggestions, and/or questions, please contact hcup@ahrq.gov. |
| If you are experiencing issues related to Section 508 accessibility of information on this website, please contact hcup@ahrq.gov. |
| Privacy Notice, Viewers & Players |
| Last modified 9/29/14 |