STATISTICAL BRIEF #178 |
September 2014
Celeste M. Torio, Ph.D., M.P.H. and Roxanne M. Andrews, Ph.D. Introduction Potentially preventable hospitalizations are admissions to a hospital for certain acute illnesses or worsening chronic conditions that might have been avoided with the delivery of high-quality outpatient treatment and disease management. They can serve as potential markers of health system efficiency. Lack of access to healthcare and poor-quality care can lead to increases in these types of hospitalizations. Access to care and level of quality vary by geographic areas. A study examining trends in potentially preventable hospitalizations from 1980 through 1998 in all four geographic regions of the country found the highest increases in rates of hospitalizations in the Northeast and the lowest increases in the West.1 Urban and rural areas are each rich in cultural diversity and heterogeneous with respect to population density, economics, and social characteristics. However, compared with urban areas, rural areas tend to have fewer healthcare organizations and professionals of all types, less choice and competition among them, and broad variation in their availability at the local level.2 In essence, rural communities continually struggle to sustain viable healthcare services. Highlighting geographic variation may serve to narrow disparities in health outcomes and identify strategies for reducing hospitalizations by providing adequate and appropriately targeted resources.3,4 In fact, reducing preventable hospitalization rates is crucial to controlling healthcare costs.3 This Statistical Brief presents data from the Healthcare Cost and Utilization Project (HCUP) on the characteristics of potentially preventable hospitalizations from 2005 through 2011. The Agency for Healthcare Research and Quality (AHRQ) Prevention Quality Indicators (PQIs) were used to develop estimates of the number of potentially preventable hospitalizations for overall PQIs, acute PQIs, and chronic PQIs from 2005 through 2011. An earlier Statistical Brief on potentially preventable hospitalizations presented trends from 2005 through 2010 for adults and children.5 This Statistical Brief is the latest in a series on potentially preventable hospitalizations that have focused on a range of topics that include acute and chronic conditions,6 individuals who are dually eligible for Medicare and Medicaid,7 older adults,8 nationwide frequency and costs,9 racial and ethnic disparities,10,11 and trends among adults and children from 1997-2004.12 (See http://www.hcup-us.ahrq.gov/reports/statbriefs/sb_preventable.jsp for a complete list of Statistical Briefs in this series.) Rates of hospitalization for acute PQIs were based on admissions for dehydration, bacterial pneumonia, and urinary tract infections. Rates of hospitalization for chronic PQIs were based on admissions for diabetes, angina, congestive heart failure, hypertension, asthma, and chronic obstructive pulmonary disease. The rates for potentially preventable hospitalizations are adjusted for age and sex. With respect to geographic characteristics, this Statistical Brief examines geographic region and urban and rural areas using four categories ranging from large metropolitan to remote rural areas. All differences between estimates noted in the text, table, and figures are statistically significant at the 0.05 level or better. Findings Geographic characteristics of potentially preventable hospitalizations, 2005 and 2011 Table 1 reports geographic characteristics of potentially preventable hospitalizations for overall, acute, and chronic conditions in 2005 and 2011. |
|
| Table 1. Potentially preventable hospitalizations for overall, acute, and chronic conditions by geographic characteristics, 2005 and 2011 | ||||||
| Geographic characteristics | Discharge ratesa per 100,000 population | |||||
|---|---|---|---|---|---|---|
| Overall conditions (PQI 90) | Acute conditions (PQI 91) | Chronic conditions (PQI 92) | ||||
| 2005 | 2011 | 2005 | 2011 | 2005 | 2011 | |
| United States | 1,941 | 1,669c | 823 | 657c | 1,118 | 1,012c |
| Region | ||||||
| Northeast | 1,869d | 1,776d | 762d | 658d | 1,107d | 1,118d |
| Midwest | 1,978d | 1,726d | 857d | 705d | 1,121d | 1,021d |
| South | 2,274d | 1,845d | 947d | 730d | 1,328d | 1,115d |
| Westb | 1,406 | 1,220 | 635 | 484 | 772 | 736 |
| Location of patient residence | ||||||
| Large metropolitan | 1,904 | 1,715d | 784 | 641 | 1,120 | 1,074d |
| Small metropolitanb | 1,725 | 1,416 | 736 | 566 | 989 | 850 |
| Micropolitan | 2,252d | 1,784d | 980d | 742d | 1,272d | 1,042d |
| Remote rural | 2,586d | 2,227d | 1,195d | 1,014d | 1,391d | 1,213d |
| a Rates are adjusted by age and sex b Reference group c Statistical difference between 2005 and 2011 d Statistically significant at p<0.05 compared with the reference group Abbreviation: PQI, Prevention Quality Indicator Source: Agency for Healthcare Research and Quality (AHRQ), Center for Delivery, Organization, and Markets, Healthcare Cost and Utilization Project (HCUP), Nationwide Inpatient Sample (NIS), 2005 and 2011 | ||||||
Rates of hospitalizations for potentially preventable conditions by region, 2005-2011 Figures 1 and 2 portray trends in the rates of potentially preventable hospitalizations for acute conditions (Figure 1) and chronic conditions (Figure 2) by region for 2005 through 2011. |
|
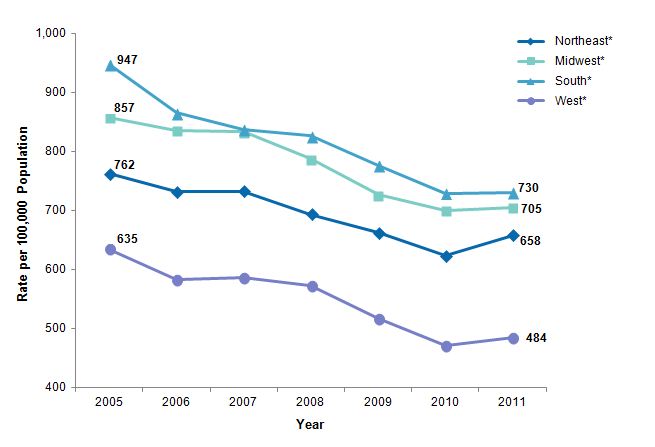
Figure 1. Rates of potentially preventable hospitalizations for acute conditions by region, 2005-2011
* The difference in rates between 2005 and 2011 is statistically significant at p<0.05. Rates are per 100,000 population. Figure 1 is a line graph showing the slope of the change in rates between 2005 and 2011 per 100,000. The differences in rates between 2005 and 2011 were statistically significant at p<0.05 for all regions. The South had a steady decline in rates that ranged from a high of 947 in 2005 to a low of 730 in 2011. The Midwest rates began at 857 in 2005 and remained fairly stable through 2007. They then declined steadily to 705 in 2011. The Northeast had a steady decline in rates from a high of 762 in 2005 to a low of 623 in 2010. The rate then increased to 658 in 2011. The West had a steady decline in rates from 635 in 2005 to a low of 471 in 2010. The rate then slightly increased to 484 in 2011. Source: Agency for Healthcare Research and Quality (AHRQ), Center for Delivery, Organization, and Markets, Healthcare Cost and Utilization Project (HCUP), Nationwide Inpatient Sample (NIS), 2005 through 2011. |
|
|
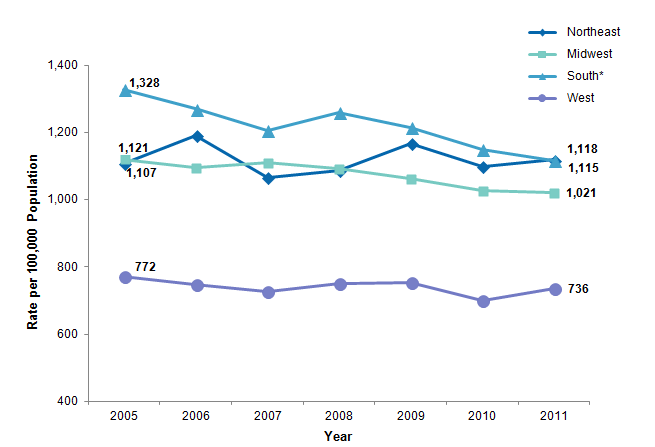
Figure 2. Rates of potentially preventable hospitalizations for chronic conditions by region, 2005-2011
* The difference in rates between 2005 and 2011 is statistically significant at p<0.05. Rates are per 100,000 population. Figure 2 is a line graph showing the slope of the change in rates between 2005 and 2011 per 100,000. The difference in rates between 2005 and 2011 was statistically significant at p<0.05 only for the South. The South had a steady decline in rates that ranged from a high of 1328 in 2005 to a low of 1115 in 2011. The Midwest had a steady but smaller decline in rates that ranged from a high of 1121 in 2005 to a low of 1021 in 2011. The Northeast had more variable rates. In 2005, the rate was 1107. The highest rate of 1191 occurred in 2006, and the lowest rate of 1067 occurred in 2007. The rate in 2011 was 1118. The West consistently had the lowest rates, and they showed little variation across time. They began at 772 in 2005 and ended at 736 in 2011. Source: Agency for Healthcare Research and Quality (AHRQ), Center for Delivery, Organization, and Markets, Healthcare Cost and Utilization Project (HCUP), Nationwide Inpatient Sample (NIS), 2005 through 2011. |
Rates of potentially preventable hospitalizations by location of patient residence, 2005-2011 Figures 3 and 4 present trends in the rates of potentially preventable hospitalizations for acute conditions (Figure 3) and chronic conditions (Figure 4) by location of patient residence for 2005 through 2011. |
|
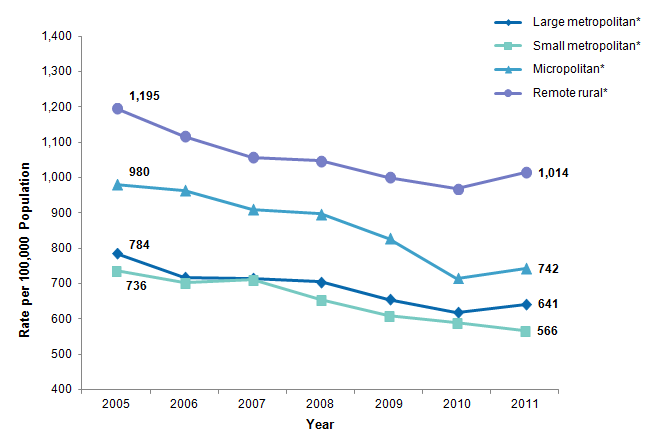
Figure 3. Rates of potentially preventable hospitalizations for acute conditions by location of patient residence, 2005-2011
* The difference in rates between 2005 and 2011 is statistically significant at p<0.05. Rates are per 100,000 population. Figure 3 is a line graph showing the slope of the change in rates between 2005 and 2011 per 100,000. The differences in rates between 2005 and 2011 were statistically significant at p<0.05 for all locations of patient residence. Rates in remote rural locations steadily declined from a high of 1195 in 2005 to a low of 998 in 2010. There was then a slight increase to 1014 in 2011. Rates in micropolitan locations steadily declined from a high of 980 in 2005 to a low of 715 in 2010. There was then a slight increase to 742 in 2011. Rates in large metropolitan locations steadily declined from a high of 784 in 2005 to a low of 617 in 2010. There was then a slight increase to 641 in 2011. Rates in small metropolitan locations steadily declined from a high of 736 in 2005 to a low of 566 in 2011. Source: Agency for Healthcare Research and Quality (AHRQ), Center for Delivery, Organization, and Markets, Healthcare Cost and Utilization Project (HCUP), Nationwide Inpatient Sample (NIS), 2005 through 2011. |
|
|
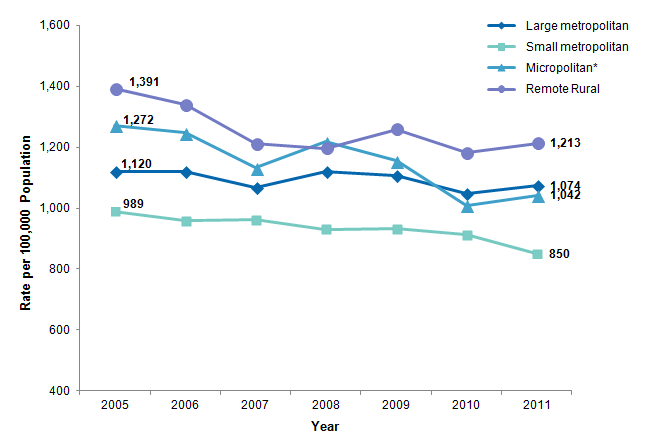
Figure 4. Rates of potentially preventable hospitalizations for chronic conditions by location of patient residence, 2005-2011
* The difference in rates between 2005 and 2011 is statistically significant at p<0.05. Rates are per 100,000 population. Figure 4 is a line graph showing the slope of the change in rates between 2005 and 2011 per 100,000. The difference in rates between 2005 and 2011 was statistically significant at p<0.05 only for the micropolitan location. Rates in remote rural locations steadily declined from a high of 1391 in 2005 to a low of 1181 in 2010. There was then a slight increase to 1213 in 2011. Rates in micropolitan locations declined from a high of 1272 in 2005 to a low of 1010 in 2010. There was then a slight increase to 1042 in 2011. Rates in large metropolitan were relatively stable. They were 1120 in 2005 and 1074 in 2011. Rates in small metropolitan locations declined from a high of 989 in 2005 to a low of 850 in 2011. Source: Agency for Healthcare Research and Quality (AHRQ), Center for Delivery, Organization, and Markets, Healthcare Cost and Utilization Project (HCUP), Nationwide Inpatient Sample (NIS), 2005 through 2011. |
Data Source The estimates in this Statistical Brief are based upon data from the Healthcare Cost and Utilization Project (HCUP) Nationwide Inpatient Sample (NIS) for 2005 through 2011. Supplemental sources included population denominator data for use with HCUP databases.13 Definitions Types of hospitals included in HCUP HCUP is based on data from community hospitals, which are defined as short-term, non-Federal, general, and other hospitals, excluding hospital units of other institutions (e.g., prisons). HCUP data include obstetrics and gynecology, otolaryngology, orthopedic, cancer, pediatric, public, and academic medical hospitals. Excluded are long-term care, rehabilitation, psychiatric, and alcoholism and chemical dependency hospitals. However, if a patient received long-term care, rehabilitation, or treatment for psychiatric or chemical dependency conditions in a community hospital, the discharge record for that stay will be included in the Nationwide Inpatient Sample (NIS). Unit of analysis The unit of analysis is the hospital discharge (i.e., the hospital stay), not a person or patient. This means that a person who is admitted to the hospital multiple times in one year will be counted each time as a separate "discharge" from the hospital. Location of patients' residence Place of residence is based on a simplified adaptation of the 2003 version of the Urban Influence Codes (UIC). The 12 categories of the UIC are combined into four broader categories that differentiate between large and small metropolitan, micropolitan, and a non-urban residual (termed "remote rural" in this Statistical Brief). The four categories have the following definitions:
Region Region is one of the four regions defined by the U.S. Census Bureau:
Prevention Quality Indicators The Prevention Quality Indicators (PQIs; version 4.5), a component of the AHRQ Quality Indicators (QIs), are a set of measures that can be used with hospital inpatient discharge data to identify access to and quality of care for "ambulatory care-sensitive conditions." These are conditions for which good outpatient care can potentially prevent the need for hospitalization or for which early intervention can prevent complications or more severe disease. PQI rates can also be affected by other factors such as disease prevalence. The PQIs are adjusted for age and sex. Further information on the AHRQ QIs, including documentation and free software downloads, is available at http://www.qualityindicators.ahrq.gov/. Additional information on how the QI software was applied to the HCUP data for the statistics reported in this Statistical Brief is available in Coffey et al., 2012.14 About HCUP The Healthcare Cost and Utilization Project (HCUP, pronounced "H-Cup") is a family of healthcare databases and related software tools and products developed through a Federal-State-Industry partnership and sponsored by the Agency for Healthcare Research and Quality (AHRQ). HCUP databases bring together the data collection efforts of State data organizations, hospital associations, private data organizations, and the Federal government to create a national information resource of encounter-level healthcare data (HCUP Partners). HCUP includes the largest collection of longitudinal hospital care data in the United States, with all-payer, encounter-level information beginning in 1988. These databases enable research on a broad range of health policy issues, including cost and quality of health services, medical practice patterns, access to healthcare programs, and outcomes of treatments at the national, State, and local market levels. HCUP would not be possible without the contributions of the following data collection Partners from across the United States: Alaska State Hospital and Nursing Home Association Arizona Department of Health Services Arkansas Department of Health California Office of Statewide Health Planning and Development Colorado Hospital Association Connecticut Hospital Association Florida Agency for Health Care Administration Georgia Hospital Association Hawaii Health Information Corporation Illinois Department of Public Health Indiana Hospital Association Iowa Hospital Association Kansas Hospital Association Kentucky Cabinet for Health and Family Services Louisiana Department of Health and Hospitals Maine Health Data Organization Maryland Health Services Cost Review Commission Massachusetts Center for Health Information and Analysis Michigan Health & Hospital Association Minnesota Hospital Association Mississippi Department of Health Missouri Hospital Industry Data Institute Montana MHA - An Association of Montana Health Care Providers Nebraska Hospital Association Nevada Department of Health and Human Services New Hampshire Department of Health & Human Services New Jersey Department of Health New Mexico Department of Health New York State Department of Health North Carolina Department of Health and Human Services North Dakota (data provided by the Minnesota Hospital Association) Ohio Hospital Association Oklahoma State Department of Health Oregon Association of Hospitals and Health Systems Oregon Health Policy and Research Pennsylvania Health Care Cost Containment Council Rhode Island Department of Health South Carolina Revenue and Fiscal Affairs Office South Dakota Association of Healthcare Organizations Tennessee Hospital Association Texas Department of State Health Services Utah Department of Health Vermont Association of Hospitals and Health Systems Virginia Health Information Washington State Department of Health West Virginia Health Care Authority Wisconsin Department of Health Services Wyoming Hospital Association About Statistical Briefs HCUP Statistical Briefs are descriptive summary reports presenting statistics on hospital inpatient and emergency department use and costs, quality of care, access to care, medical conditions, procedures, patient populations, and other topics. The reports use HCUP administrative healthcare data. About the NIS The HCUP Nationwide Inpatient Sample (NIS) is a nationwide database of hospital inpatient stays. The NIS is nationally representative of all community hospitals (i.e., short-term, non-Federal, nonrehabilitation hospitals). The NIS is a sample of hospitals and includes all patients from each hospital, regardless of payer. It is drawn from a sampling frame that contains hospitals comprising more than 95 percent of all discharges in the United States. The vast size of the NIS allows the study of topics at both the national and regional levels for specific subgroups of patients. In addition, NIS data are standardized across years to facilitate ease of use. For More Information For more information about HCUP, visit http://www.hcup-us.ahrq.gov/. For additional HCUP statistics, visit HCUPnet, our interactive query system, at https://datatools.ahrq.gov/hcupnet. For information on other hospitalizations in the United States, refer to the following HCUP Statistical Briefs located at http://www.hcup-us.ahrq.gov/reports/statbriefs/statbriefs.jsp:
For a detailed description of HCUP, more information on the design of the Nationwide Inpatient Sample (NIS), and methods to calculate estimates, please refer to the following publications: Introduction to the HCUP Nationwide Inpatient Sample, 2009. Online. May 2011. U.S. Agency for Healthcare Research and Quality. http://hcup-us.ahrq.gov/db/nation/nis/NIS_2009_INTRODUCTION.pdf. Accessed June 4, 2014. Houchens R, Elixhauser A. Final Report on Calculating Nationwide Inpatient Sample (NIS) Variances, 2001. HCUP Methods Series Report #2003-2. Online. June 2005 (revised June 6, 2005). U.S. Agency for Healthcare Research and Quality. http://www.hcup-us.ahrq.gov/reports/methods/2003_02.pdf. Accessed June 4, 2014. Suggested Citation Torio CM (AHRQ), Andrews RM (AHRQ). Geographic Variation in Potentially Preventable Hospitalizations for Acute and Chronic Conditions, 2005-2011. HCUP Statistical Brief #178. September 2014. Agency for Healthcare Research and Quality, Rockville, MD. http://www.hcup-us.ahrq.gov/reports/statbriefs/sb178-Preventable-Hospitalizations-by-Region. *** AHRQ welcomes questions and comments from readers of this publication who are interested in obtaining more information about access, cost, use, financing, and quality of healthcare in the United States. We also invite you to tell us how you are using this Statistical Brief and other HCUP data and tools, and to share suggestions on how HCUP products might be enhanced to further meet your needs. Please e-mail us at hcup@ahrq.gov or send a letter to the address below:Irene Fraser, Ph.D., Director Center for Delivery, Organization, and Markets Agency for Healthcare Research and Quality 540 Gaither Road Rockville, MD 20850 1 Kozak LJ, Hall MJ, Owings MF. Trends in avoidable hospitalizations, 1980-1998. Health Affairs (Millwood). 2001 Mar-Apr;20(2):225-32. 2 Institute of Medicine. Quality Through Collaboration: The Future of Rural Health. Washington, DC: National Academy Press, 2005. 3 Kozak et al., 2001. 4 Moy E, Chang E, Barrett M. Potentially preventable hospitalizations - United States, 2001-2009. Morbidity and Mortality Weekly Report. 2013;62(3):139-43. 5 Torio CM, Elixhauser A, Andrews RM. Trends in Potentially Preventable Admissions among Adults and Children, 2005-2010. HCUP Statistical Brief #151. March 2013. Agency for Healthcare Research and Quality, Rockville, MD. http://www.hcup-us.ahrq.gov/reports/statbriefs/sb151.pdf. Accessed July 16, 2014. 6 Stranges E, Stocks C. Potentially Preventable Hospitalizations for Acute and Chronic Conditions, 2008. HCUP Statistical Brief #99. November 2010. Agency for Healthcare Research and Quality, Rockville, MD. http://www.hcup-us.ahrq.gov/reports/statbriefs/sb99.pdf. Accessed August 12, 2014. 7 Jiang HJ, Wier LM, Potter DEB, Burgess J. Potentially Preventable Hospitalizations among Medicare-Medicaid Dual Eligibles, 2008. HCUP Statistical Brief #96. September 2010. Agency for Healthcare Research and Quality, Rockville, MD. http://www.hcup-us.ahrq.gov/reports/statbriefs/sb96.pdf. Accessed August 12, 2014. 8 Stranges E, Friedman B. Potentially Preventable Hospitalization Rates Declined for Older Adults, 2003-2007. HCUP Statistical Brief #83. December 2009. Agency for Healthcare Research and Quality, Rockville, MD. http://www.hcup-us.ahrq.gov/reports/statbriefs/sb83.pdf. Accessed August 12, 2014. 9 Jiang HJ, Russo CA, Barrett ML. Nationwide Frequency and Costs of Potentially Preventable Hospitalizations, 2006. HCUP Statistical Brief #72. April 2009. Agency for Healthcare Research and Quality, Rockville, MD. http://www.hcup-us.ahrq.gov/reports/statbriefs/sb72.pdf. Accessed August 12, 2014. 10 Stranges E, Coffey R, Andrews RM. Potentially Preventable Hospitalizations among Hispanic Adults, 2006. HCUP Statistical Brief #61. October 2008. Agency for Healthcare Research and Quality, Rockville, MD. http://www.hcup-us.ahrq.gov/reports/statbriefs/sb61.pdf. Accessed August 12, 2014. 11 Russo CA, Andrews RM, Coffey RM. Racial and Ethnic Disparities in Potentially Preventable Hospitalizations, 2003. HCUP Statistical Brief #10. July 2006. Agency for Healthcare Research and Quality, Rockville, MD. http://www.hcup-us.ahrq.gov/reports/statbriefs/sb10.pdf. Accessed August 12, 2014. 12 Russo A, Jiang HJ, Barrett M. Trends in Potentially Preventable Hospitalizations among Adults and Children, 1997-2004. HCUP Statistical Brief #36. August 2007. Agency for Healthcare Research and Quality, Rockville, MD. http://www.hcup-us.ahrq.gov/reports/statbriefs/sb36.pdf. Accessed August 12, 2014. 13 Barrett M, Lopez-Gonzalez L, Coffey R, Levit K. Population Denominator Data for use with the HCUP Databases (Updated with 2012 Population data). HCUP Methods Series Report #2013-01. Online. March 8, 2013. U.S. Agency for Healthcare Research and Quality. http://www.hcup-us.ahrq.gov/reports/methods/2013_01.pdf. Accessed June 4, 2014. 14 Coffey R, Barrett M, Houchens R, Moy E, Andrews R, Coenen N. Methods Applying AHRQ Quality Indicators to Healthcare Cost and Utilization Project (HCUP) Data for the Eleventh (2013) National Healthcare Quality Report (NHQR) and National Healthcare Disparities Report (NHDR). HCUP Methods Series Report #2012-03. Online. November 12, 2012. U.S. Agency for Healthcare Research and Quality. http://www.hcup-us.ahrq.gov/reports/methods/2012_03.pdf. Accessed June 4, 2014. |