STATISTICAL BRIEF #174 |
June 2014
Audrey J. Weiss, Ph.D., Lauren M. Wier, M.P.H., Carol Stocks, Ph.D., R.N., and Janice Blanchard, M.D., Ph.D. Introduction Emergency departments (EDs) provide a significant source of medical care in the United States, with over 131 million total ED visits occurring in 2011.1 Over the past decade, the increase in ED utilization has outpaced growth of the general population, despite a national decline in the total number of ED facilities.2,3 In 2009, approximately half of all hospital inpatient admissions originated in the ED.4 In particular, EDs were the primary portal of entry for hospital admission for uninsured and publicly insured patients (privately insured patients were more likely to be directly admitted to the hospital from a doctor's office or clinic).5 ED utilization reflects the greater health needs of the surrounding community and may provide the only readily available care for individuals who cannot obtain care elsewhere.6 Many ED visits are "resource sensitive" and potentially preventable, meaning that access to high-quality, community-based healthcare can prevent the need for a portion of ED visits. This HCUP Statistical Brief presents data on ED visits in the United States in 2011. Patient and hospital characteristics for two types of ED visits are provided: ED visits with admission to the same hospital and ED visits resulting in discharge, which includes patients who were stabilized in the ED and then discharged home, transferred to another hospital, or any other disposition. The most frequent conditions treated by patient age group also are presented for both types of ED visits. All differences between estimates noted in the text are statistically significant at the .0005 level or better. Findings Emergency department visits by selected patient and hospital characteristics, 2011 In 2011, rates of ED visits varied by the patient's sex, age group, residence, and hospital region (Figure 1). |
|
|
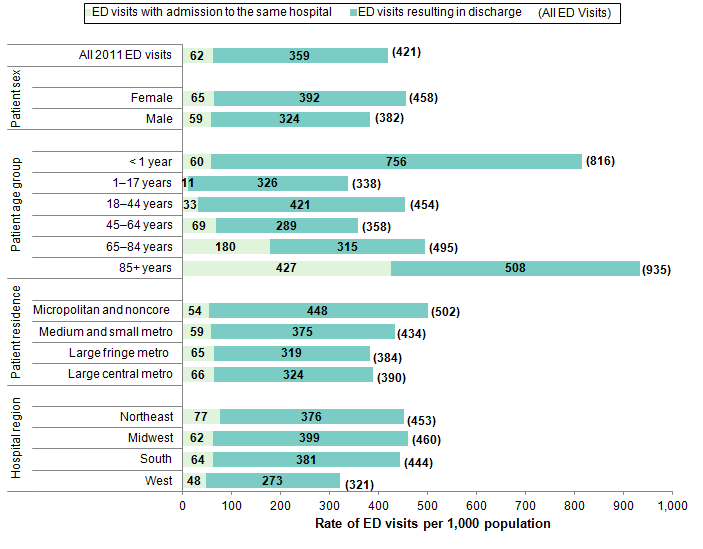
Figure 1. Rate of emergency department visits by the patient's sex, age group, residence, and hospital region, 2011
Note: ED visits resulting in discharge" includes patients who were stabilized in the ED and then discharged home, transferred to another hospital, or any other disposition. Figure 1 is a bar graph showing the rate of ED visits per 1,000 population by demographic characteristics. All 2011 ED visits: ED visits with admission to the same hospital, 62, ED visits resulting in discharge, 359, All ED visits, 421. Patient sex Female: ED visits with admission to the same hospital, 65, ED visits resulting in discharge, 392, All ED visits, 458. Male: ED visits with admission to the same hospital, 59, ED visits resulting in discharge, 324, All ED visits, 382. Patient age group - Less than 1 year: ED visits with admission to the same hospital, 60, ED visits resulting in discharge, 756, All ED visits, 816. 1-17 years: ED visits with admission to the same hospital, 11, ED visits resulting in discharge, 326, All ED visits, 338. 18-44 years: ED visits with admission to the same hospital, 33, ED visits resulting in discharge, 421, All ED visits, 454. 45-64 years: ED visits with admission to the same hospital, 69, ED visits resulting in discharge, 289, All ED visits, 358. 65-84 years: ED visits with admission to the same hospital, 180, ED visits resulting in discharge, 315, All ED visits, 495. 85 years and older: ED visits with admission to the same hospital, 427, ED visits resulting in discharge, 508, All ED visits, 935. Patient residence - Micropolitan and noncore: ED visits with admission to the same hospital, 54, ED visits resulting in discharge, 448, All ED visits, 502. Medium and small metro: ED visits with admission to the same hospital, 59, ED visits resulting in discharge, 375, All ED visits, 434. Large fringe metro: ED visits with admission to the same hospital, 65, ED visits resulting in discharge, 319, All ED visits, 384. Large central metro: ED visits with admission to the same hospital, 66, ED visits resulting in discharge, 324, All ED visits, 390. Hospital region - Northeast: ED visits with admission to the same hospital, 77, ED visits resulting in discharge, 376, All ED visits, 453. Midwest: ED visits with admission to the same hospital, 62, ED visits resulting in discharge, 399, All ED visits, 460. South: ED visits with admission to the same hospital, 64, ED visits resulting in discharge, 381, All ED visits, 444. West: ED visits with admission to the same hospital, 48, ED visits resulting in discharge, 273, All ED visits, 321. Note: "ED visits resulting in discharge" includes patients who were stabilized in the ED and then discharged home, transferred to another hospital, or any other disposition. Source: Agency for Healthcare Research and Quality (AHRQ), Center for Delivery, Organization, and Markets, Healthcare Cost and Utilization Project (HCUP), Nationwide Emergency Department Sample (NEDS), 2011. |
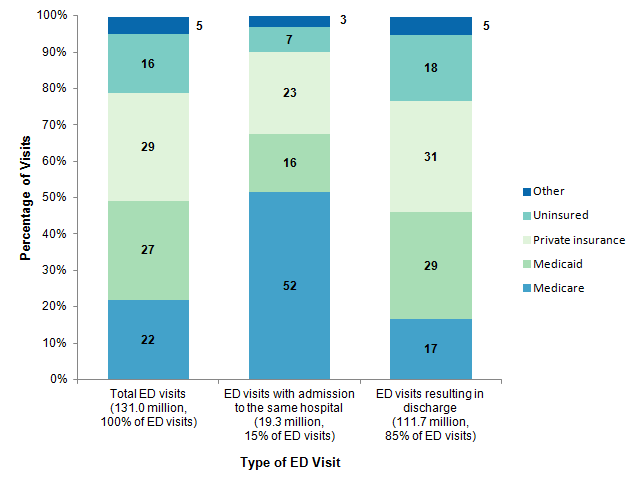
The proportions of ED visits that were attributable to each expected primary payer are provided in Figure 2. |
|
Figure 2. Proportions of emergency department visits by expected primary payer, 2011
Note: "ED visits resulting in discharge" includes patients who were stabilized in the ED and then discharged home, transferred to another hospital, or any other disposition. Figure 2 is a stacked bar graph showing the percentage of visits by the type of ED visit. Total ED visits (131.0 million, 100% of ED visits): Medicare, 22%, Medicaid, 27%, Private insurance, 29%, Uninsured, 16%, Other, 5%. ED visits with admission to the same hospital (19.3 million, 15% of ED visits): Medicare, 52%, Medicaid, 16%, Private insurance, 23%, Uninsured, 7%, Other, 3%. ED visits resulting in discharge (111.7 million, 85% of ED visits): Medicare, 17%, Medicaid, 29%, Private insurance, 31%, Uninsured, 18%, Other, 5%. Note: "ED visits resulting in discharge" includes patients who were stabilized in the ED and then discharged home, transferred to another hospital, or any other disposition. Source: Agency for Healthcare Research and Quality (AHRQ), Center for Delivery, Organization, and Markets, Healthcare Cost and Utilization Project (HCUP), Nationwide Emergency Department Sample (NEDS), 2011. |
Reasons for emergency department visits by patient age group, 2011 |
| Table 1. Top five principal conditions for admission to the same hospital after an emergency department visit, by age group, 2011 | ||||||||||||
| Principal conditiona | Number and rankb of ED visits with admission to the same hospital, by age group | |||||||||||
|---|---|---|---|---|---|---|---|---|---|---|---|---|
| <1 year | 1-17 years | 18-44 years | 45-64 years | 65-84 years | 85+ years | |||||||
| n | Rank | n | Rank | n | Rank | n | Rank | n | Rank | n | Rank | |
| Total ED visits with admission to the same hospital | 238,317 | 799,637 | 3,734,009 | 5,679,839 | 6,421,521 | 2,449,425 | ||||||
| Acute bronchitis | 52,200 | 1 | ||||||||||
| Pneumonia (except that caused by tuberculosis and sexually transmitted diseases) | 17,600 | 2 | 69,400 | 2 | 203,500 | 3 | 328,000 | 3 | 149,400 | 3 | ||
| Urinary tract infections | 11,900 | 3 | 125,400 | 4 | ||||||||
| Fever of unknown origin | 7,900 | 4 | ||||||||||
| Hemolytic jaundice and perinatal jaundice | 7,700 | 5 | ||||||||||
| Asthma | 76,900 | 1 | ||||||||||
| Appendicitis and other appendiceal conditions | 59,200 | 3 | ||||||||||
| Mood disorders | 37,400 | 4 | 226,300 | 1 | ||||||||
| Skin and subcutaneous tissue infections | 33,300 | 5 | 133,700 | 3 | 161,800 | 5 | ||||||
| Diabetes mellitus with complications | 134,200 | 2 | ||||||||||
| Schizophrenia and other psychotic disorders | 120,400 | 4 | ||||||||||
| Biliary tract disease | 116,300 | 5 | ||||||||||
| Septicemia (except in labor) | 237,500 | 1 | 392,700 | 1 | 167,500 | 2 | ||||||
| Nonspecific chest pain | 233,200 | 2 | ||||||||||
| Chronic obstructive pulmonary disease and bronchiectasis | 198,500 | 4 | 309,000 | 4 | ||||||||
| Congestive heart failure, nonhypertensive | 350,100 | 2 | 190,500 | 1 | ||||||||
| Cardiac dysrhythmias | 278,600 | 5 | ||||||||||
| Fracture of neck of femur (hip) | 105,600 | 5 | ||||||||||
| a Principal conditions are based on the first-listed diagnosis on the hospital discharge record and are classified using AHRQ's Clinical Classifications Software (CCS). Two general CCS "other" conditions are not reported in the table for infants aged <1 year: other perinatal conditions (26,200 ED visits) and other upper respiratory infections (8,200 ED visits). "Other" CCS categories include miscellaneous, otherwise unclassifiable diagnoses that may be difficult to interpret as a group. b Rank of the principal condition by number of ED visits within each age group Source: Agency for Healthcare Research and Quality (AHRQ), Center for Delivery, Organization, and Markets, Healthcare Cost and Utilization Project (HCUP), Nationwide Emergency Department Sample (NIS), 2011 | ||||||||||||
|
| Table 2. Top five principal conditions for emergency department visits resulting in discharge, by age group, 2011 | ||||||||||||
| Principal conditiona | Number and rankb of ED visits resulting in discharge, by age group | |||||||||||
|---|---|---|---|---|---|---|---|---|---|---|---|---|
| <1 year | 1-17 years | 18-44 years | 45-64 years | 65-84 years | 85+ years | |||||||
| n | Rank | n | Rank | n | Rank | n | Rank | n | Rank | n | Rank | |
| Total ED visits resulting in dischargec | 3,021,782 | 22,819,322 | 47,788,338 | 23,953,917 | 11,220,150 | 2,915,116 | ||||||
| Fever of unknown origin | 269,900 | 1 | 842,400 | 5 | ||||||||
| Otitis media and related conditions | 266,200 | 2 | 1,266,500 | 2 | ||||||||
| Acute bronchitis | 181,000 | 3 | ||||||||||
| Viral infections | 145,600 | 4 | ||||||||||
| Nausea and vomiting | 121,300 | 5 | ||||||||||
| Superficial injury, contusion | 1,575,900 | 1 | 2,178,700 | 3 | 1,066,500 | 5 | 565,800 | 2 | 213,400 | 1 | ||
| Open wounds of head, neck, and trunk | 1,142,600 | 3 | 96,200 | 4 | ||||||||
| Sprains and strains | 1,061,100 | 4 | 3,181,700 | 1 | 1,350,800 | 2 | ||||||
| Abdominal pain | 2,958,300 | 2 | 1,197,600 | 4 | 425,200 | 3 | ||||||
| Spondylosis, intervertebral disc disorders, other back problems | 1,827,600 | 4 | 1,200,600 | 3 | 368,000 | 4 | ||||||
| Headache, including migraine | 1,770,000 | 5 | ||||||||||
| Nonspecific chest pain | 1,525,200 | 1 | 643,000 | 1 | 117,200 | 3 | ||||||
| Urinary tract infections | 359,900 | 5 | 127,100 | 5 | ||||||||
| Open wounds of extremities | 82,800 | 5 | ||||||||||
| a Principal conditions are based on the first-listed diagnosis on the ED visit record and are classified using AHRQ's Clinical Classifications Software (CCS). General CCS "other" conditions are not reported in the table and include the following conditions by age group: other upper respiratory infections (<1 year: 540,700 ED visits; 1-17 years: 2,550,600 ED visits; 18-44: 1,926,500 ED visits); other perinatal conditions (<1 year: 151,400 ED visits); other injuries and conditions due to external causes (1-17 years: 1,075,500 ED visits; 85+ years: 126,200 ED visits). "Other" CCS categories include miscellaneous, otherwise unclassifiable diagnoses that may be difficult to interpret as a group. b Rank of the principal condition by number of ED visits within each age group c "ED visits resulting in discharge" include patients who were stabilized in the ED and then discharged home, transferred to another hospital, or any other disposition. Source: Agency for Healthcare Research and Quality (AHRQ), Center for Delivery, Organization, and Markets, Healthcare Cost and Utilization Project (HCUP), Nationwide Emergency Department Sample (NIS), 2011 | ||||||||||||
The estimates in this Statistical Brief are based upon data from the Healthcare Cost and Utilization Project (HCUP) Nationwide Emergency Department Sample (NEDS), 2011. The statistics were generated from HCUPnet, a free, online query system that provides users with immediate access to the largest set of publicly available, all-payer national, regional, and State-level hospital care databases from HCUP.7 Many statistical tests were conducted for this Statistical Brief. Thus, to decrease the number of false-positive results, we reduced the significance level to .0005 for individual tests. Definitions Diagnoses, ICD-9-CM, and Clinical Classifications Software (CCS) The principal diagnosis is that condition established after study to be chiefly responsible for the patient's admission to the hospital. Secondary diagnoses are concomitant conditions that coexist at the time of admission or develop during the stay. ICD-9-CM is the International Classification of Diseases, Ninth Revision, Clinical Modification, which assigns numeric codes to diagnoses. There are approximately 14,000 ICD-9-CM diagnosis codes. CCS categorizes ICD-9-CM diagnoses into a manageable number of clinically meaningful categories.8 This "clinical grouper" makes it easier to quickly understand patterns of diagnoses. CCS categories identified as "Other" typically are not reported; these categories include miscellaneous, otherwise unclassifiable diagnoses that may be difficult to interpret as a group Types of hospitals included in HCUP HCUP is based on data from community hospitals, which are defined as short-term, non-Federal, general, and other hospitals, excluding hospital units of other institutions (e.g., prisons). HCUP data include obstetrics and gynecology, otolaryngology, orthopedic, cancer, pediatric, public, and academic medical hospitals. Excluded are long-term care, rehabilitation, psychiatric, and alcoholism and chemical dependency hospitals. Community hospitals included in the Nationwide Emergency Department Sample (NEDS) have hospital-based emergency departments and no more than 90 percent of their ED visits resulting in admission. Unit of analysis The unit of analysis is the emergency department (ED) encounter, not a person or patient. This means that a person who is seen in the ED multiple times in one year will be counted each time as a separate "encounter" in the ED. Location of patients' residence Place of residence is based on the urban-rural classification scheme for U.S. counties developed by the National Center for Health Statistics (NCHS). For this Statistical Brief, we collapsed the NCHS categories into either urban or rural according to the following: Urban:
Payer is the expected primary payer for the hospital stay. To make coding uniform across all HCUP data sources, payer combines detailed categories into general groups:
When more than one payer is listed for a hospital discharge, the first-listed payer is used. Region Region is one of the four regions defined by the U.S. Census Bureau:
The Healthcare Cost and Utilization Project (HCUP, pronounced "H-Cup") is a family of healthcare databases and related software tools and products developed through a Federal-State-Industry partnership and sponsored by the Agency for Healthcare Research and Quality (AHRQ). HCUP databases bring together the data collection efforts of State data organizations, hospital associations, private data organizations, and the Federal government to create a national information resource of encounter-level healthcare data (HCUP Partners). HCUP includes the largest collection of longitudinal hospital care data in the United States, with all-payer, encounter-level information beginning in 1988. These databases enable research on a broad range of health policy issues, including cost and quality of health services, medical practice patterns, access to healthcare programs, and outcomes of treatments at the national, State, and local market levels. HCUP would not be possible without the contributions of the following data collection Partners from across the United States: Alaska State Hospital and Nursing Home Association Arizona Department of Health Services Arkansas Department of Health California Office of Statewide Health Planning and Development Colorado Hospital Association Connecticut Hospital Association Florida Agency for Health Care Administration Georgia Hospital Association Hawaii Health Information Corporation Illinois Department of Public Health Indiana Hospital Association Iowa Hospital Association Kansas Hospital Association Kentucky Cabinet for Health and Family Services Louisiana Department of Health and Hospitals Maine Health Data Organization Maryland Health Services Cost Review Commission Massachusetts Center for Health Information and Analysis Michigan Health & Hospital Association Minnesota Hospital Association Mississippi Department of Health Missouri Hospital Industry Data Institute Montana MHA - An Association of Montana Health Care Providers Nebraska Hospital Association Nevada Department of Health and Human Services New Hampshire Department of Health & Human Services New Jersey Department of Health New Mexico Department of Health New York State Department of Health North Carolina Department of Health and Human Services North Dakota (data provided by the Minnesota Hospital Association) Ohio Hospital Association Oklahoma State Department of Health Oregon Association of Hospitals and Health Systems Oregon Health Policy and Research Pennsylvania Health Care Cost Containment Council Rhode Island Department of Health South Carolina Budget & Control Board South Dakota Association of Healthcare Organizations Tennessee Hospital Association Texas Department of State Health Services Utah Department of Health Vermont Association of Hospitals and Health Systems Virginia Health Information Washington State Department of Health West Virginia Health Care Authority Wisconsin Department of Health Services Wyoming Hospital Association About Statistical Briefs HCUP Statistical Briefs are descriptive summary reports presenting statistics on hospital inpatient and emergency department use and costs, quality of care, access to care, medical conditions, procedures, patient populations, and other topics. The reports use HCUP administrative healthcare data. About the NEDS The HCUP Nationwide Emergency Department Database (NEDS) is a unique and powerful database that yields national estimates of emergency department (ED) visits. The NEDS was constructed using records from both the HCUP State Emergency Department Databases (SEDD) and the State Inpatient Databases (SID). The SEDD capture information on ED visits that do not result in an admission (i.e., treat-and-release visits and transfers to another hospital); the SID contain information on patients initially seen in the emergency room and then admitted to the same hospital. The NEDS was created to enable analyses of ED utilization patterns and support public health professionals, administrators, policymakers, and clinicians in their decision making regarding this critical source of care. The NEDS is produced annually beginning in 2006. About HCUPnet HCUPnet is an online query system that offers instant access to the largest set of all-payer healthcare databases that are publicly available. HCUPnet has an easy step-by-step query system that creates tables and graphs of national and regional statistics as well as data trends for community hospitals in the United States. HCUPnet generates statistics using data from HCUP's Nationwide Inpatient Sample (NIS), the Kids' Inpatient Database (KID), the Nationwide Emergency Department Sample (NEDS), the State Inpatient Databases (SID), and the State Emergency Department Databases (SEDD). For More Information For more information about HCUP, visit http://www.hcup-us.ahrq.gov/. For additional HCUP statistics, visit HCUPnet, our interactive query system, at https://datatools.ahrq.gov/hcupnet. For information on other hospitalizations in the United States, refer to the following HCUP Statistical Briefs located at http://www.hcup-us.ahrq.gov/reports/statbriefs/statbriefs.jsp:
For a detailed description of HCUP, more information on the design of the Nationwide Emergency Department Sample (NEDS), and methods to calculate estimates, please refer to the following publications: Introduction to the HCUP Nationwide Emergency Department Sample, 2010. Online. November 2012. U.S. Agency for Healthcare Research and Quality. http://hcup-us.ahrq.gov/db/nation/neds/NEDS2010Introductionv3.pdf. Accessed May 7, 2014. Introduction to the HCUP State Emergency Department Databases. Online. August 2013. U.S. Agency for Healthcare Research and Quality. http://hcup-us.ahrq.gov/db/state/sedddist/Introduction_to_SEDD.pdf. Accessed May 7, 2014. Suggested Citation Weiss AJ (Truven Health Analytics), Wier LM (Truven Health Analytics), Stocks C (AHRQ), Blanchard J (RAND). Overview of Emergency Department Visits in the United States, 2011. HCUP Statistical Brief #174. June 2014. Agency for Healthcare Research and Quality, Rockville, MD http://www.hcup-us.ahrq.gov/reports/statbriefs/sb174-Emergency-Department-Visits-Overview.pdf. *** AHRQ welcomes questions and comments from readers of this publication who are interested in obtaining more information about access, cost, use, financing, and quality of healthcare in the United States. We also invite you to tell us how you are using this Statistical Brief and other HCUP data and tools, and to share suggestions on how HCUP products might be enhanced to further meet your needs. Please e-mail us at hcup@ahrq.gov or send a letter to the address below:Irene Fraser, Ph.D., Director Center for Delivery, Organization, and Markets Agency for Healthcare Research and Quality 540 Gaither Road Rockville, MD 20850 1 HCUPnet. 2011 National Statistics, All ED Visits. https://datatools.ahrq.gov/hcupnet. Accessed May 7, 2014. 2 Tang N, Stein J, Hsia RY, Maselli JH, Gonzales R. Trends and characteristics of US emergency department visits, 1997-2007. Journal of the American Medical Association. 2010;304(6):664-70. 3 Goodell S, DeLia D, Cantor JC. Emergency Department Utilization and Capacity. 2009, Robert Wood Johnson Foundation Policy Brief No. 17. Princeton, NJ: Robert Wood Johnson Foundation. http://www.rwjf.org/content/dam/farm/reports/issue_briefs/2009/rwjf43566. 4 Morganti-Gonzalez K, Baufman S, Blanchard J, Abir M, Iyer N, Smith A, et al. The Evolving Role of Emergency Departments in the United States. RAND RR 280-ACEP. Santa Monica, CA: Rand Corp; May 2013. 5 Ibid. Note: excludes live births. 6 Tang et al., 2010. 7 Agency for Healthcare Research and Quality. HCUPnet website. https://datatools.ahrq.gov/hcupnet. Accessed May 7, 2014. 8 HCUP Clinical Classifications Software (CCS). Healthcare Cost and Utilization Project (HCUP). U.S. Agency for Healthcare Research and Quality, Rockville, MD. Updated April 2014. http://www.hcup-us.ahrq.gov/toolssoftware/ccs/ccs.jsp. Accessed May 7, 2014. |