STATISTICAL BRIEF #171 |
March 2014
Audrey J. Weiss, Ph.D. and Anne Elixhauser, Ph.D. Introduction More than 24 million hospital stays (63% of all stays) in 2011 involved some type of procedure.1 Some of these procedures (such as a chest X-ray or skin biopsy) occurred outside of the operating room (OR). Others were major OR procedures (such as hip replacement or heart valve repair). Hospital stays that involve OR procedures are more costly, on average, than stays that do not involve OR procedures.2 Over time, some OR procedures have become more prevalent, while others have decreased in frequency. For instance, prior research has found that the volume of coronary artery bypass graft (CABG) decreased by 70 percent from 1997 to 2007, while the volume of percutaneous transluminal coronary angioplasty (PTCA) increased by 20 percent during this same time period.3 Such trends may reflect changing standards in surgical care, the introduction of new surgical techniques, a shift in procedure setting from inpatient to outpatient, or an aging population, among other reasons. This Statistical Brief presents data from the Healthcare Cost and Utilization Project (HCUP) on trends in OR procedures from 2001 through 2011. For this Statistical Brief, OR procedures are defined using the HCUP procedure classes tool.4 In this tool, OR procedures are identified based on diagnosis-related groups (DRGs) that use physician panels to determine whether the procedure would be performed in a hospital OR in most hospitals. The findings in this Statistical Brief represent an update of 2007 statistics reported by Elixhauser and Andrews.5 We present the 2001 and 2011 volume of OR procedures by major clinical body system. For selected high-volume procedures, we provide the trends and identify differences over the 11-year period examined. All differences between estimates noted in the text are significantly different at the .001 level or better. Findings Operating room procedures by clinical body system, 2001 and 2011 Table 1 presents the number of OR procedures by major clinical body system in 2001 and 2011. Although the overall number of procedures remained relatively unchanged across this time frame, the mix of procedures changed substantially. |
|
| Table 1. Operating room procedures by clinical body system, 2001 and 2011 | |||||
| Rank (2011) | Clinical body system | 2001 | 2011 | ||
|---|---|---|---|---|---|
| Number, in thousands | Percent | Number, in thousands | Percent | ||
| Total operating room procedures | 15,334 | 100.0 | 15,662 | 100.0 | |
| 1 | Musculoskeletal system | 2,740 | 17.9 | 3,785 | 24.2 |
| 2 | Digestive system | 2,764 | 18.0 | 2,898 | 18.5 |
| 3 | Cardiovascular system | 2,383 | 15.5 | 2,123 | 13.6 |
| 4 | Female genital organs | 2,000 | 13.0 | 1,343 | 8.6 |
| 5 | Obstetrical procedures | 1,064 | 6.9 | 1,307 | 8.3 |
| 6 | Male genital organs | 1,428 | 9.3 | 1,283 | 8.2 |
| 7 | Nervous system | 796 | 5.2 | 917 | 5.9 |
| 8 | Integumentary system | 596 | 3.9 | 473 | 3.0 |
| 9 | Urinary system | 471 | 3.1 | 432 | 2.8 |
| 10 | Hemic and lymphatic system | 290 | 1.9 | 331 | 2.1 |
| 11 | Respiratory system | 301 | 2.0 | 313 | 2.0 |
| 12 | Miscellaneous | 191 | 1.2 | 171 | 1.1 |
| 13 | Nose, mouth, and pharynx | 146 | 1.0 | 125 | 0.8 |
| 14 | Endocrine system | 96 | 0.6 | 116 | 0.7 |
| 15 | Eye | 41 | 0.3 | 24 | 0.2 |
| 16 | Ear | 29 | 0.2 | 20 | 0.1 |
| Note: The difference in volume between 2001 and 2011 was statistically significant for each clinical body system at p<.0001. Source: Agency for Healthcare Research and Quality (AHRQ), Center for Delivery, Organization, and Markets, Healthcare Cost and Utilization Project (HCUP), Nationwide Inpatient Sample (NIS), 2001 and 2011 | |||||
In 2011, nearly one-fourth (24.2 percent) of the 15,661,700 total OR procedures involved the musculoskeletal system, which is a 38 percent increase from 17.9 percent in 2001. There was a small increase (5 percent) in OR procedures of the digestive system between 2001 and 2011—from 18.0 percent to 18.5 percent of all OR procedures. OR procedures involving the cardiovascular system decreased from 15.5 percent of all OR procedures in 2001 to 13.6 percent in 2011 (an 11 percent decrease in volume). OR procedures involving the female and male genital organs each constituted over 8 percent of all OR procedures in 2011, and both decreased in volume from 2001 (33 percent for female genital organs and 10 percent for male genital organs). Obstetrical procedures also represented just over 8 percent of all OR procedures in 2011—a 23 percent increase in volume since 2001.
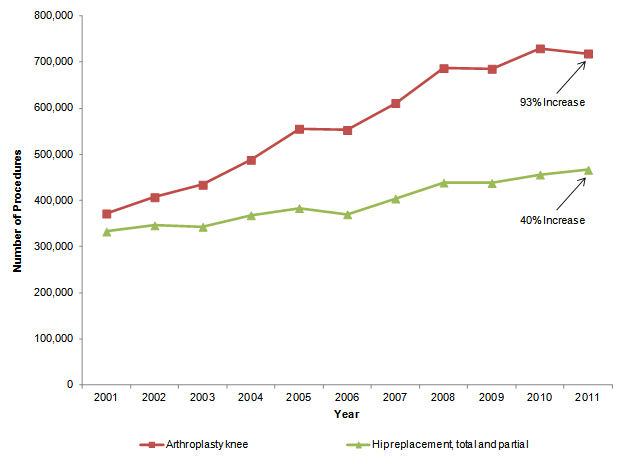
Figures 1 through 7 provide the 2001—2011 trends for selected OR procedures from the clinical body systems in Table 1 that comprise the largest number of procedures performed in 2011. Selected OR procedures presented in the figures are those with at least 100,000 annual discharges and those that represent relatively homogeneous groups of procedures.6 Trends for selected musculoskeletal OR procedures, 2001—2011 Figure 1 presents the trend in two orthopedic OR procedures from 2001 through 2011. Knee arthroplasty nearly doubled (93 percent increase) over the 11-year period, from 371,600 procedures in 2001 to 718,500 procedures in 2011. Hip replacement procedures increased by 40 percent over the 10-year period, from 332,500 procedures in 2001 to 466,500 procedures in 2011. |
|
Figure 1. Orthopedic operating room procedures, 2001—2011
Note: Percentage differences presented in the figure refer to changes in procedure volume between 2001 and 2011. This figure is a line chart showing the number of procedures by year for two procedures. Arthroplasty of the knee (93% increase in procedure volume from 2001 to 2011): 2001: 372,000, 2002: 407,000, 2003: 434,000, 2004: 488,000, 2005: 556,000, 2006: 553,000, 2007: 611,000, 2008: 687,000, 2009: 686,000, 2010: 730,000, 2011: 718,000. Hip replacement, total and partial (40% increase in procedure volume from 2001 to 2011): 2001: 332,000, 2002: 346,000, 2003: 343,000, 2004: 368,000, 2005: 383,000, 2006: 370,000,2007: 404,000, 2008: 439,000, 2009: 438,000, 2010: 456,000, 2011: 467,000. Source: Agency for Healthcare Research and Quality (AHRQ), Center for Delivery, Organization, and Markets, Healthcare Cost and Utilization Project (HCUP), Nationwide Inpatient Sample (NIS), 2001—2011. |
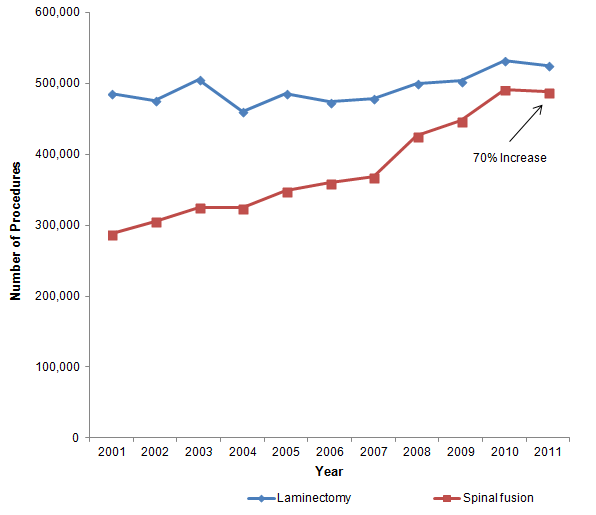
Back-related OR procedures are shown in Figure 2. Spinal fusion increased by 70 percent, from 287,600 procedures in 2001 to 488,300 procedures in 2011. Laminectomy remained relatively stable during the same time period at about 490,000 procedures each year.
|
|
Figure 2. Back-related operating room procedures, 2001—2011
Note: Percentage differences presented in the figure refer to changes in procedure volume between 2001 and 2011. This figure is a line chart showing the number of procedures by year for two operating room procedures. Laminectomy: 2001: 485,000, 2002: 476,000, 2003: 325,000, 2004: 324,000, 2005: 349,000, 2006: 360,000, 2007: 368,000, 2008: 426,000, 2009: 447,000, 2010: 492,000, 2011: 488,000. Spinal fusion (70% increase in procedure volume from 2001 to 2011): 2001: 288,000, 2002: 306,000, 2003: 325,000, 2004: 324,000, 2005: 349,000, 2006: 360,000, 2007: 368,000, 2008: 426,000, 2009: 447,000, 2010: 492,000, 2011: 488,000. Source: Agency for Healthcare Research and Quality (AHRQ), Center for Delivery, Organization, and Markets, Healthcare Cost and Utilization Project (HCUP), Nationwide Inpatient Sample (NIS), 2001—2011. |
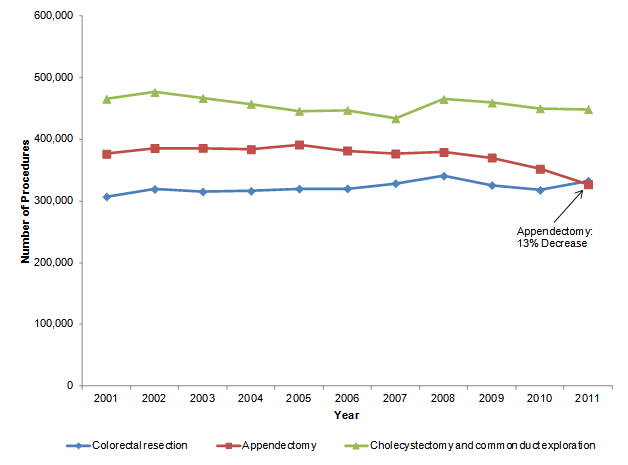
Trends for selected digestive OR procedures, 2001—2011 As shown in Figure 3, the volume of appendectomy procedures decreased by 13 percent over the 11-year period, from 376,700 procedures in 2001 to 327,100 procedures in 2011. Colorectal resection procedures and cholecystectomy/common duct exploration procedures remained relatively stable during this time: colorectal resection (about 320,000 procedures per year) and cholecystectomy (about 460,000 procedures per year). |
|
Figure 3. Digestive-related operating room procedures, 2001—2011
Note: Percentage differences presented in the figure refer to changes in procedure volume between 2001 and 2011. This figure is a line chart showing the number of procedures by year for three operating room procedures. Colorectal resection: 2001: 307,000, 2002: 319,000, 2003: 315,000, 2004: 316,000, 2005: 320,000, 2006: 320,000, 2007: 329,000, 2008: 341,000, 2009: 326,000, 2010: 318,000, 2011: 333,000. Appendectomy (13% decrease in procedure volume from 2001 to 2011): 2001: 377,000, 2002: 386,000, 2003: 386,000, 2004: 384,000, 2005: 391,000, 2006: 382,000, 2007: 377,000, 2008: 379,000, 2009: 370,000, 2010: 352,000, 2011: 327,000.Cholecystectomy and common duct exploration: 2001: 466,000, 2002: 477,000, 2003: 467,000, 2004: 456,000, 2005: 446,000, 2006: 448,000, 2007: 434,000, 2008: 465,000, 2009: 460,000, 2010: 450,000, 2011: 449,000. Source: Agency for Healthcare Research and Quality (AHRQ), Center for Delivery, Organization, and Markets, Healthcare Cost and Utilization Project (HCUP), Nationwide Inpatient Sample (NIS), 2001—2011. |
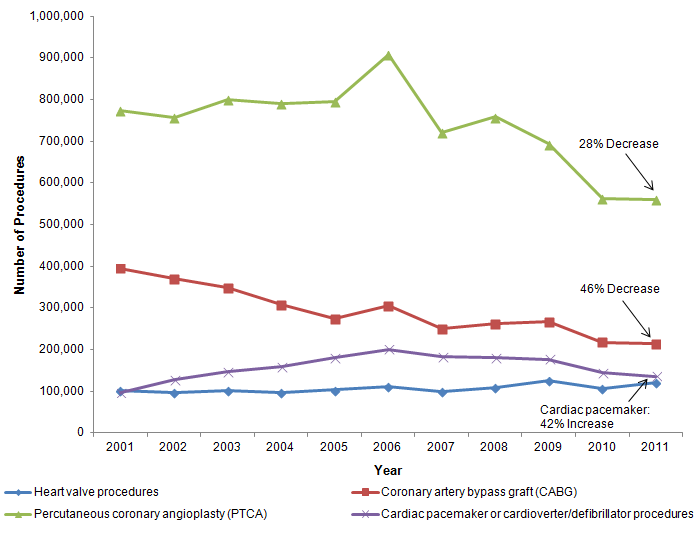
Trends for selected cardiovascular OR procedures, 2001—2011 Figure 4 shows that the number of coronary artery bypass graft (CABG) procedures decreased by 46 percent, from 395,100 procedures in 2001 to 213,700 procedures in 2011. Similarly, percutaneous coronary angioplasty (PTCA) decreased by 28 percent, from 773,900 procedures in 2001 to 560,500 procedures in 2011; the decrease occurred primarily between 2006 and 2011. The volume of cardiac pacemaker or cardioverter/defibrillator procedures increased by 42 percent during this time, from 96,000 procedures in 2001 to 135,800 procedures in 2011. Heart valve procedures remained relatively stable during the 11-year time period at about 110,000 procedures each year. |
|
Figure 4. Heart-related operating room procedures, 2001—2011
Note: Percentage differences presented in the figure refer to changes in procedure volume between 2001 and 2011. This figure is a line chart showing the number of procedures by year for four operating room procedures. Heart valve procedures: 2001: 100,000, 2002: 97,000, 2003: 102,000, 2004: 96,000, 2005: 103,000, 2006: 110,000, 2007: 98,000, 2008: 108,000, 2009: 124,000, 2010: 107,000, 2011: 120,000. Coronary artery bypass graft (46% decrease in procedure volume from 2001 to 2011): 2001: 395,000, 2002: 370,000, 2003: 348,000, 2004: 308,000, 2005: 275,000, 2006: 305,000, 2007: 251,000, 2008: 262,000, 2009: 268,000, 2010: 218,000, 2011: 214,000. Percutaneous coronary angioplasty (PTCA) (28% decrease in procedure volume from 2001 to 2011): 2001: 774,000, 2002: 757,000, 2003: 800,000, 2004: 791,000, 2005: 795,000, 2006: 907,000, 2007: 722,000, 2008: 758,000, 2009: 693,000, 2010: 562,000, 2011: 560,000. Cardiac pacemaker or cardioverter/defibrillator procedures (42% increase in procedure volume from 2001 to 2011): 2001: 96,000, 2002: 127,000, 2003: 146,000, 2004: 159,000, 2005: 179,000, 2006: 201,000, 2007: 182,000, 2008: 179,000, 2009: 177,000, 2010: 143,000, 2011: 136,000. Source: Agency for Healthcare Research and Quality (AHRQ), Center for Delivery, Organization, and Markets, Healthcare Cost and Utilization Project (HCUP), Nationwide Inpatient Sample (NIS), 2001—2011. |
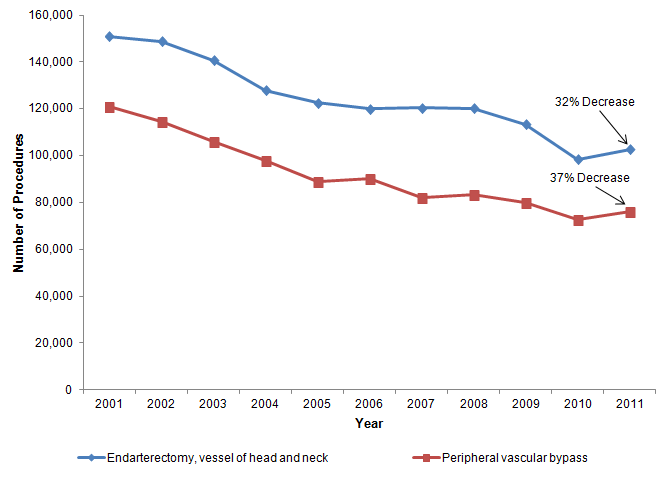
Figure 5 shows a decrease in two specific vascular OR procedures that are not related to the heart. Both endarterectomy and peripheral vascular bypass decreased by approximately one-third between 2001 and 2011. Endarterectomy decreased from 151,000 procedures in 2001 to 102,700 procedures in 2011. Peripheral vascular bypass decreased from 121,000 procedures in 2001 to 76,200 procedures in 2011.
|
|
Figure 5. Other vascular operating room procedures, 2001—2011
Note: Percentage differences presented in the figure refer to changes in procedure volume between 2001 and 2011. This figure is a line chart showing the number of procedures by year for two operating room procedures. Endarterectomy, vessel of head and neck (32% decrease in procedure volume from 2001 to 2011): 2001: 151,000, 2002: 149,000, 2003: 141,000, 2004: 128,000, 2005: 123,000, 2006: 120,000, 2007: 120,000, 2008: 120,000, 2009: 113,000, 2010: 98,000, 2011: 103,000. Peripheral vascular bypass (37% decrease in procedure volume from 2001 to 2011): 2001: 121,000, 2002: 114,000, 2003: 106,000, 2004: 98,000, 2005: 89,000, 2006: 90,000, 2007: 82,000, 2008: 83,000, 2009: 80,000, 2010: 73,000, 2011: 76,000. Source: Agency for Healthcare Research and Quality (AHRQ), Center for Delivery, Organization, and Markets, Healthcare Cost and Utilization Project (HCUP), Nationwide Inpatient Sample (NIS), 2001—2011. |
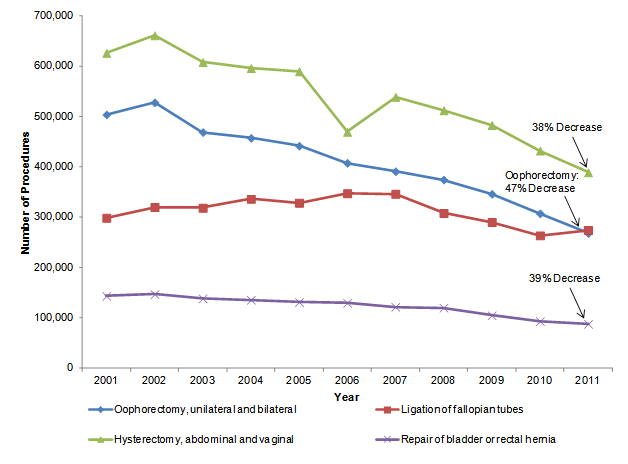
Trends for selected OR procedures related to female genital organs, 2001—2011 Figure 6 shows that the volume of hysterectomy, oophorectomy, and repair of bladder or rectal hernia procedures each decreased by about 40 percent between 2001 and 2011. Hysterectomy decreased from 626,600 procedures in 2001 to 389,100 procedures in 2011. Oophorectomy decreased from 504,100 procedures in 2001 to 268,200 procedures in 2011. Repair of bladder or rectal hernia procedures decreased from 143,400 procedures in 2001 to 87,800 procedures in 2011. In contrast, ligation of the fallopian tubes remained relatively stable during the 11-year time period at about 310,000 procedures each year. |
|
Figure 6. Operating room procedures related to female genital organs, 2001—2011
Note: Percentage differences presented in the figure refer to changes in procedure volume between 2001 and 2011. This figure is a line chart showing the number of procedures by year for four operating room procedures. Oophorectomy, unilateral and bilateral (47% decrease in procedure volume from 2001 to 2011): 2001: 504,000, 2002: 528,000, 2003: 469,000, 2004: 458,000, 2005: 442,000, 2006: 408,000, 2007: 391,000, 2008: 375,000, 2009: 346,000, 2010: 307,000, 2011: 268,000. Ligation of fallopian tubes: 2001: 299,000, 2002: 320,000, 2003: 319,000, 2004: 336,000, 2005: 329,000, 2006: 347,000, 2007: 346,000, 2008: 308,000, 2009: 290,000, 2010: 432,000, 2011: 274,000. Hysterectomy, abdominal and vaginal (38% decrease in procedure volume from 2001 to 2011): 2001: 627,000, 2002: 662,000, 2003: 608,000, 2004: 596,000, 2005: 590,000, 2006: 469,000, 2007: 539,000, 2008: 512,000 ,2009: 483,000, 2010: 432,000, 2011: 389,000. Repair of bladder or rectal hernia (39% decrease in procedure volume from 2001 to 2011): 2001: 143,000, 2002: 147,000, 2003: 138,000, 2004: 136,000, 2005: 131,000, 2006: 130,000, 2007: 122,000, 2008: 120,000, 2009: 105,000, 2010: 93,000, 2011: 88,000. Source: Agency for Healthcare Research and Quality (AHRQ), Center for Delivery, Organization, and Markets, Healthcare Cost and Utilization Project (HCUP), Nationwide Inpatient Sample (NIS), 2001—2011. |
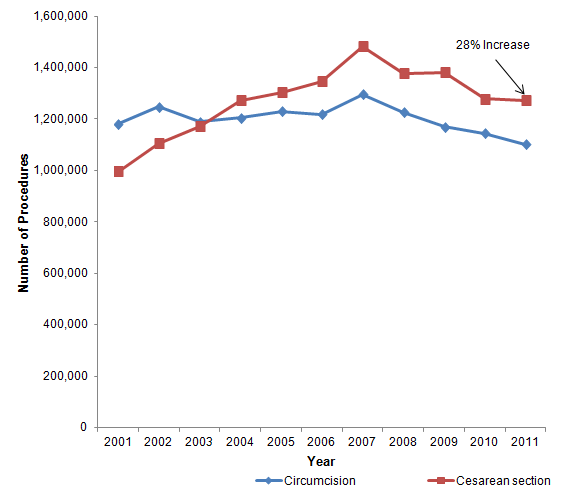
Trends for selected obstetrical and newborn OR procedures, 2001—2011 Figure 7 shows that the volume of Cesarean section increased 28 percent from 995,700 procedures in 2001 to 1,272,000 procedures in 2011, although there appears to be some retreat from the high point in 2007. Circumcision remained relatively stable during the 11-year period at about 1,200,000 procedures each year.7 |
|
Figure 7. Delivery and newborn operating room procedures, 2001—2011
Note: Percentage differences presented in the figure refer to changes in procedure volume between 2001 and 2011. This figure is a line chart showing the number of procedures by year for two operating room procedures. Circumcision: 2001: 1,182,000, 2002: 1,247,000, 2003: 1,189,000, 2004: 1,205,000, 2005: 1,229,000, 2006: 1,218,000, 2007: 1,297,000, 2008: 1,225,000, 2009: 1,167,000, 2010: 1,144,000, 2011: 1,101,000. Cesarean section (28% increase in procedure volume from 2001 to 2011): 2001: 996,000, 2002: 1,104,000, 2003: 1,171,000, 2004: 1,271,000, 2005: 1,304,000, 2006: 1,346,000, 2007: 1,482,000, 2008: 1,378,000, 2009: 1,382,000, 2010: 1,278,000, 2011: 1,272,000. Source: Agency for Healthcare Research and Quality (AHRQ), Center for Delivery, Organization, and Markets, Healthcare Cost and Utilization Project (HCUP), Nationwide Inpatient Sample (NIS), 2001—2011. |
Data Source
The estimates in this Statistical Brief are based upon data from the Healthcare Cost and Utilization Project (HCUP) 2001 through 2011 Nationwide Inpatient Sample (NIS). Estimates of the volume for selected operating room (OR) procedures were taken from HCUPnet, the online query system that provides free access to information from HCUP: https://datatools.ahrq.gov/hcupnet. HCUPnet provides the ability to retrieve health statistics and information on hospital inpatient and emergency department utilization. For the purposes of this Statistical Brief, the number of OR procedures is reported to the nearest hundred. Many hypothesis tests were conducted for this Statistical Brief. Thus, to decrease the number of false-positive results, we reduced the significance level to .001 for individual tests. Definitions Procedures, ICD-9-CM, and Clinical Classifications Software (CCS) All-listed procedures include all procedures performed during the hospital stay, whether for definitive treatment or for diagnostic or exploratory purposes. ICD-9-CM is the International Classification of Diseases, Ninth Revision, Clinical Modification, which assigns numeric codes to procedures. There are about 4,000 ICD-9-CM procedure codes. CCS categorizes procedure codes into clinically meaningful categories.8 This "clinical grouper" makes it easier to quickly understand patterns of procedure use. CCS categories identified as "Other" typically are not reported; these categories include miscellaneous, otherwise unclassifiable procedures that may be difficult to interpret as a group. Major OR procedures were defined using procedure classes, which categorize each ICD-9-CM procedure code as either major therapeutic, major diagnostic, minor therapeutic, or minor diagnostic.9 Table 2 lists the specific CCS procedure categories and clinical body systems for the selected OR procedures presented in the trend figures in this Statistical Brief. |
| Table 2. Clinical Classifications Software procedure category and clinical body system for selected operating room (OR) procedures presented in trend figures | ||
| Trend figure | CCS procedure category | Clinical body system |
|---|---|---|
| Figure 1: Orthopedic OR procedures | 152: Arthroplasty knee | Musculoskeletal system |
| 153: Hip replacement, total and partial | Musculoskeletal system | |
| Figure 2: Back-related OR procedures | 3: Laminectomy | Nervous system |
| 158: Spinal fusion | Musculoskeletal system | |
| Figure 3: Digestive-related OR procedures | 78: Colorectal resection | Digestive system |
| 80: Appendectomy | Digestive system | |
| 84: Cholecystectomy and common duct exploration | Digestive system | |
| Figure 4: Heart-related OR procedures | 43: Heart valve procedures | Cardiovascular system |
| 44: Coronary artery bypass graft (CABG) | Cardiovascular system | |
| 45: Percutaneous coronary angioplasty (PTCA) | Cardiovascular system | |
| 48: Cardiac pacemaker or cardioverter/defibrillator procedures | Cardiovascular system | |
| Figure 5: Other vascular OR procedures | 51: Endarterectomy, vessel of head and neck | Cardiovascular system |
| 55: Peripheral vascular bypass | Cardiovascular system | |
| Figure 6: OR procedures related to female genital organs | 119: Oophorectomy, unilateral and bilateral | Female genital organs |
| 121: Ligation of fallopian tubes | Female genital organs | |
| 124: Hysterectomy, abdominal and vaginal | Female genital organs | |
| 129: Repair of bladder or rectal hernia | Female genital organs | |
| Figure 7: Delivery and newborn OR procedures | 115: Circumcision | Male genital organs |
| 134: Cesarean section | Obstetrical procedures | |
Types of hospitals included in HCUP HCUP is based on data from community hospitals, which are defined as short-term, non-Federal, general, and other hospitals, excluding hospital units of other institutions (e.g., prisons). HCUP data include obstetrics and gynecology, otolaryngology, orthopedic, cancer, pediatric, public, and academic medical hospitals. Excluded are long-term care, rehabilitation, psychiatric, and alcoholism and chemical dependency hospitals. However, if a patient received long-term care, rehabilitation, or treatment for psychiatric or chemical dependency conditions in a community hospital, the discharge record for that stay will be included in the Nationwide Inpatient Sample (NIS). Unit of analysis The unit of analysis is the hospital discharge (i.e., the hospital stay), not a person or patient. This means that a person who is admitted to the hospital multiple times in one year will be counted each time as a separate "discharge" from the hospital. About HCUP HCUP is a family of powerful healthcare databases, software tools, and products for advancing research. Sponsored by the Agency for Healthcare Research and Quality (AHRQ), HCUP includes the largest all-payer encounter-level collection of longitudinal healthcare data (inpatient, ambulatory surgery, and emergency department) in the United States, beginning in 1988. HCUP is a Federal-State-Industry Partnership that brings together the data collection efforts of many organizations—such as State data organizations, hospital associations, private data organizations, and the Federal government—to create a national information resource. HCUP would not be possible without the contributions of the following data collection Partners from across the United States: Alaska State Hospital and Nursing Home Association Arizona Department of Health Services Arkansas Department of Health California Office of Statewide Health Planning and Development Colorado Hospital Association Connecticut Hospital Association Florida Agency for Health Care Administration Georgia Hospital Association Hawaii Health Information Corporation Illinois Department of Public Health Indiana Hospital Association Iowa Hospital Association Kansas Hospital Association Kentucky Cabinet for Health and Family Services Louisiana Department of Health and Hospitals Maine Health Data Organization Maryland Health Services Cost Review Commission Massachusetts Center for Health Information and Analysis Michigan Health & Hospital Association Minnesota Hospital Association Mississippi Department of Health Missouri Hospital Industry Data Institute Montana MHA - An Association of Montana Health Care Providers Nebraska Hospital Association Nevada Department of Health and Human Services New Hampshire Department of Health & Human Services New Jersey Department of Health New Mexico Department of Health New York State Department of Health North Carolina Department of Health and Human Services North Dakota (data provided by the Minnesota Hospital Association) Ohio Hospital Association Oklahoma State Department of Health Oregon Association of Hospitals and Health Systems Oregon Health Policy and Research Pennsylvania Health Care Cost Containment Council Rhode Island Department of Health South Carolina Budget & Control Board South Dakota Association of Healthcare Organizations Tennessee Hospital Association Texas Department of State Health Services Utah Department of Health Vermont Association of Hospitals and Health Systems Virginia Health Information Washington State Department of Health West Virginia Health Care Authority Wisconsin Department of Health Services Wyoming Hospital Association About the NIS The HCUP Nationwide Inpatient Sample (NIS) is a nationwide database of hospital inpatient stays. The NIS is nationally representative of all community hospitals (i.e., short-term, non-Federal, nonrehabilitation hospitals). The NIS is a sample of hospitals and includes all patients from each hospital, regardless of payer. It is drawn from a sampling frame that contains hospitals comprising more than 95 percent of all discharges in the United States. The vast size of the NIS allows the study of topics at both the national and regional levels for specific subgroups of patients. In addition, NIS data are standardized across years to facilitate ease of use. About HCUPnet HCUPnet is an online query system that offers instant access to the largest set of all-payer healthcare databases publicly available. HCUPnet has an easy step-by-step query system, allowing for tables and graphs to be generated on national and regional statistics as well as trends for community hospitals in the United States. HCUPnet generates statistics using data from HCUP's Nationwide Inpatient Sample (NIS), the Kids' Inpatient Database (KID), the Nationwide Emergency Department Sample (NEDS), the State Inpatient Databases (SID), and the State Emergency Department Databases (SEDD). For More Information For more information about HCUP, visit http://www.hcup-us.ahrq.gov/. For additional HCUP statistics, visit HCUPnet, our interactive query system, at https://datatools.ahrq.gov/hcupnet. For information on other hospitalizations in the United States, refer to the following HCUP Statistical Briefs located at http://www.hcup-us.ahrq.gov/reports/statbriefs/statbriefs.jsp:
Introduction to the HCUP Nationwide Inpatient Sample, 2009. Online. May 2011. U.S. Agency for Healthcare Research and Quality. http://hcup-us.ahrq.gov/db/nation/nis/NIS_2009_INTRODUCTION.pdf. Accessed December 4, 2013. Houchens R, Elixhauser A. Final Report on Calculating Nationwide Inpatient Sample (NIS) Variances, 2001. HCUP Methods Series Report #2003-2. Online. June 2005 (revised June 6, 2005). U.S. Agency for Healthcare Research and Quality. http://www.hcup-us.ahrq.gov/reports/methods/2003_02.pdf. Accessed December 4, 2013. Suggested Citation Weiss AJ (Truven Health Analytics), Elixhauser A (AHRQ). Trends in Operating Room Procedures in U.S. Hospitals, 2001—2011. HCUP Statistical Brief #171. March 2014. Agency for Healthcare Research and Quality, Rockville, MD. http://www.hcup-us.ahrq.gov/reports/statbriefs/sb171-Operating-Room-Procedure-Trends.pdf. Acknowledgments The authors would like to acknowledge the contributions of Minya Sheng of Truven Health Analytics and Ed Hock of Social & Scientific Systems, Inc. *** AHRQ welcomes questions and comments from readers of this publication who are interested in obtaining more information about access, cost, use, financing, and quality of healthcare in the United States. We also invite you to tell us how you are using this Statistical Brief and other HCUP data and tools, and to share suggestions on how HCUP products might be enhanced to further meet your needs. Please e-mail us at hcup@ahrq.gov or send a letter to the address below:Irene Fraser, Ph.D., Director Center for Delivery, Organization, and Markets Agency for Healthcare Research and Quality 540 Gaither Road Rockville, MD 20850 1 Pfuntner A, Wier LM, Stocks C. Most Frequent Procedures Performed in U.S. Hospitals, 2011. HCUP Statistical Brief #165. October 2013. Agency for Healthcare Research and Quality. Rockville, MD. http://www.hcup-us.ahrq.gov/reports/statbriefs/sb165.pdf. 2 Elixhauser A, Andrews RM. Profile of inpatient operating room procedures in US hospitals in 2007. Arch Surg. December 2010;145(12):1201—8. 3 Ibid. 4 HCUP Procedure Classes. Healthcare Cost and Utilization Project (HCUP). U.S. Agency for Healthcare Research and Quality. Rockville, MD. Updated September 2013. http://www.hcup-us.ahrq.gov/toolssoftware/procedure/procedure.jsp. Accessed December 4, 2013. 5 Elixhauser and Andrews 2010. 6 Procedures are identified using AHRQ's Clinical Classifications Software (CCS). Certain CCS procedure categories with at least 100,000 annual discharges are not reported: procedures that are identified as “other”; procedures that are nonspecific and could be performed for a variety of reasons (e.g., treatment, fracture, or dislocation of lower extremity other than hip or femur; small bowel resection; amputation of lower extremity; partial excision of the bone); and procedures that are likely to be adjuncts to other procedures (e.g., excision, lysis peritoneal adhesions; treatment, fracture, or dislocation of hip and femur). 7 Non-neonatal circumcisions represent fewer than 1 percent of all OR circumcision procedures and were excluded from Figure 7. 8 HCUP Clinical Classifications Software (CCS). Healthcare Cost and Utilization Project (HCUP). U.S. Agency for Healthcare Research and Quality, Rockville, MD. Updated March 2013. http://www.hcup-us.ahrq.gov/toolssoftware/ccs/ccs.jsp. Accessed December 4, 2013. 9 HCUP Procedure Classes. Healthcare Cost and Utilization Project (HCUP). U.S. Agency for Healthcare Research and Quality. Rockville, MD. Updated August 30, 2012. http://www.hcup-us.ahrq.gov/toolssoftware/procedure/procedure.jsp. Accessed December 4, 2013. |