STATISTICAL BRIEF #17
|
|
November 2006
C. Allison Russo, M.P.H. and H. Joanna Jiang, Ph.D.
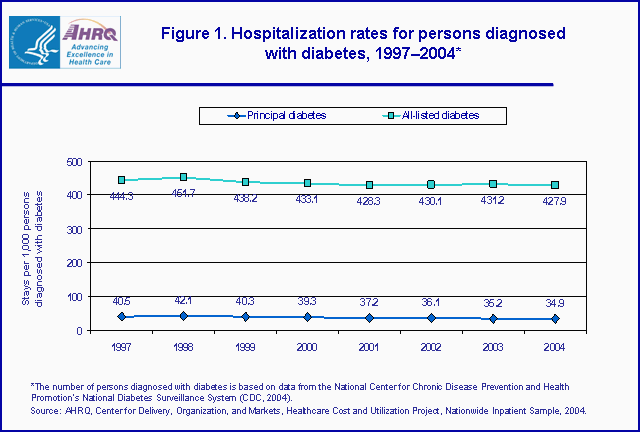
Introduction In 2004, 14.7 million Americans were diagnosed with diabetes.1 Diabetes is a disease in which the body does not produce or pro-perly use insulin. This disorder is marked by high levels of blood glucose that can lead to serious complications and premature death. Without high-quality primary and preventive care, individuals with diabetes are at a higher risk for renal, visual, neurological, and circulatory disorders, and can experience serious complications such as lower-limb amputations. These chronic and debilitating complications make diabetes an important source of hospital- based medical care and costs. This Statistical Brief presents data from the Healthcare Cost and Utilization Project (HCUP) on hospital stays among patients with diabetes in 2004. The utilization and costs of hospital care are compared for patients with diabetes and those without. Variation in hospital utilization among patients with diabetes is illustrated by principal reason for hospitalization and by expected primary source of payment. Lower-limb amputations among patients hospitalized with diabetes are also described. All differences between estimates noted in the text are statistically significant at the 0.05 level or better. Findings In 2004, nearly 6.3 million hospital stays occurred among patients with diabetes (i.e., diabetes was the principal reason for hospital-ization or was a coexisting condition). This figure resulted in a hospitalization rate of 427.9 stays per 1,000 people with diagnosed diabetes–a slight decrease from 1997, when the hospitalization rate was 444.3 stays per 1,000 people with diagnosed diabetes (figure 1).2 These counts may include multiple hospitalizations by the same individuals, which is common among patients with diabetes.3 Hospital stays for patients principally admitted for diabetes cost $3.9 billion, but stays with any mention of diabetes as either a principal or coexisting condition totaled $57.8 billion in hospital costs in 2004 (table 1). In total, 20 percent of hospital costs in the United States involved diabetes. General characteristics of hospital stays among patients with diabetes Table 1 shows that, on average, patients hospitalized with diabetes were nearly 21 years older than patients without diabetes (64.6 years versus 43.8 years). Males accounted for 46.0 percent of all hospitalizations of patients with diabetes, while non-diabetes stays were 39.8 percent male. In 2004, the mean length of stay for hospitalizations among patients with diabetes was 5.5 days, which was one day longer than non-diabetes stays. The average cost per hospitalization among patients with diabetes was about 29 percent higher than the average cost for all non-diabetes stays ($9,400 versus $7,300). More-over, hospital admissions originating in the emergency department accounted for 59.1 percent of all hospital stays for patients with diabetes compared with 40.0 percent for non-diabetes stays. |
|
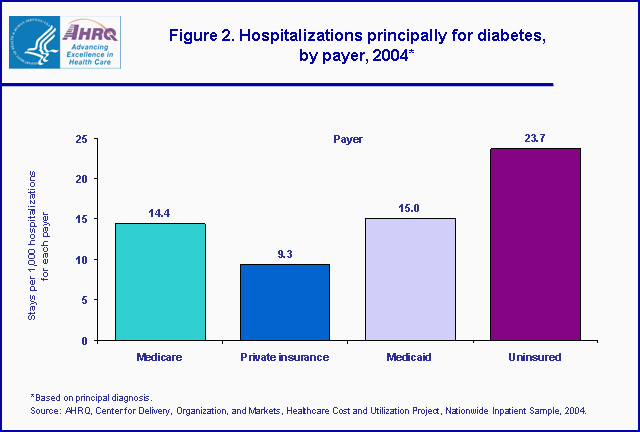
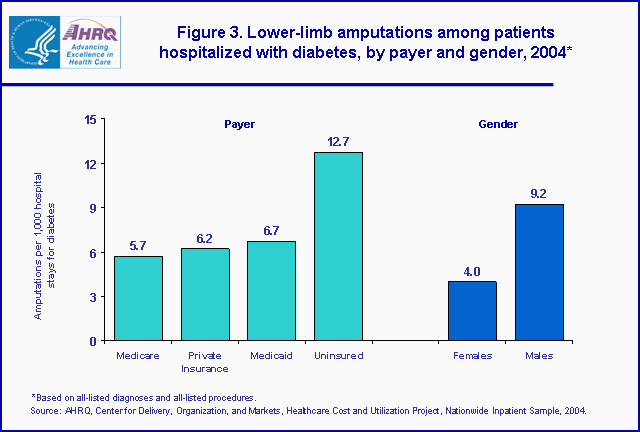
Diabetes was the principal reason for hospitalization in 8 percent (512,500) of all hospital stays among patients with diabetes. Patients admitted principally for the treatment of diabetes were nearly 12 years younger than all patients hospitalized with diabetes. Hospital stays principally for the treatment of diabetes were also slightly shorter and less costly than all hospital stays among patients with diabetes. However, admissions principally for diabetes were more likely to originate in the emergency department than all hospitalizations among patients with diabetes (67.4 percent and 59.1 percent, respectively).
The percentage of stays covered by Medicare was lower when diabetes was the principal reason for admission (35.9 percent), as compared with all diabetes stays (53.5 percent). It is also worth noting that the percentage of uninsured hospitalizations was nearly three times higher for hospital stays principally for treating diabetes than for all stays among patients with diabetes (9.1 percent versus 3.3 percent). Hospital stays principally for diabetes, by payer Figure 2 shows the number of hospitalizations principally for diabetes per 1,000 stays for each payer. Hospital stays principally for treating diabetes were more likely to be uninsured. There were 23.7 diabetes stays per 1,000 uninsured hospitalizations. On the other hand, diabetes was the principal reason for admission for 15.0 stays per 1,000 Medicaid stays, 14.4 stays per 1,000 Medicare stays, and 9.3 stays per 1,000 privately insured hospitalizations. Most common principal reasons for the hospitalization of patients with diabetes Table 2 illustrates that diabetes was the most common principal reason for hospital admission among patients with diabetes. However, nearly a quarter of all stays for patients with diabetes were principally for the treatment of six circulatory disorders: congestive heart failure, coronary atherosclerosis (hardening of the arteries), acute myocardial infarction (heart attack), nonspecific chest pain, acute cerebrovascular disease (stroke), and cardiac dysrhythmias. Pneumonia, complication of medical devices, and skin and subcutaneous tissue infections were also common reasons for hospitalization among patients with diabetes. Diabetes was a coexisting condition for 40.1 percent of stays for congestive heart failure, 32.8 percent of stays for coronary atherosclerosis, and 30.2 percent of stays for acute myocardial infarction. Diabetes was also present in more than one-fourth of all hospitalizations for acute cerebrovascular disease (28.2 percent), skin and subcutaneous infections (27.6 percent), and complications of medical devices (26.3 percent). Amputations among patients hospitalized with diabetes Long-term peripheral circulatory problems caused by diabetes can lead to gangrene and necrosis of the muscle and skin in the legs; often, these complications will lead to amputation of the toes, feet, or legs. Lower-limb amputations suggest poor control of diabetes. In 2004, lower-limb amputations among patients hospitalized for diabetes varied significantly by expected source of payment and by sex (figure 3). The number of amputations per 1,000 hospital stays for patients with diabetes was twice as high among the uninsured (12.7), as compared with hospital stays covered by Medicare (5.7), private insurance (6.2), and Medicaid (6.7). In addition, males hospitalized with diabetes had more than twice as many amputations (9.2 per 1,000 stays) as females (4.0 amputations per 1,000 hospital stays). Data Source The estimates in this Statistical Brief are based on data from the HCUP 2004 Nationwide Inpatient Sample (NIS). Historical data were drawn from the 1997, 1998, 1999, 2000, 2001, 2002, and 2003 NIS. Definitions Types of hospitals included in HCUP HCUP is based on data from community hospitals, defined as short-term, non-Federal, general and other hospitals, excluding hospital units of other institutions (e.g., prisons). HCUP data include OB-GYN, ENT, orthopedic, cancer, pediatric, public, and academic medical hospitals. They exclude long-term care, rehabilitation, psychiatric, and alcoholism and chemical dependency hospitals, but these types of discharges are included if they are from community hospitals. Unit of analysis The unit of analysis is the hospital discharge (i.e., the hospital stay), not a person or patient. This means that a person who is admitted to the hospital multiple times in one year will be counted each time as a separate "discharge" from the hospital. Costs and charges Total hospital charges were converted to costs using cost-to-charge ratios based on hospital accounting reports from the Centers for Medicare and Medicaid Services (CMS).4 Costs will tend to reflect the actual costs of production, while charges represent what the hospital billed for the case. For each hospital, a hospital-wide cost-to-charge ratio is used because detailed charges are not available across all HCUP States. Hospital charges reflect the amount the hospital charged for the entire hospital stay and does not include professional (physician) fees. For the purposes of this Statistical Brief, costs are reported to the nearest hundreds. Payer Up to two payers can be coded for a hospital stay in HCUP data. When this occurs, the following hierarchy is used: – If either payer is listed as Medicaid, the payer is "Medicaid." – For non-Medicaid stays, if either payer is listed as Medicare, the payer is "Medicare." – For stays that are neither Medicaid nor Medicare, if either payer is listed as private insurance, the payer is "private insurance." – For stays that are not Medicaid, Medicare or private insurance, if either payer is some other third-party payer, the payer is "other," which consists of Worker‘s Compensation, TRICARE/CHAMPUS, CHAMPVA, Title V, and other government programs. – For stays that have no third-party payer and the payer is listed as "self-pay" or "no charge," the payer is "uninsured." Diagnoses, Procedures, ICD-9-CM, and Clinical Classifications Software (CCS) The principal diagnosis is that condition established after study to be chiefly responsible for the patient‘s admission to the hospital. Secondary diagnoses are concomitant conditions that coexist at the time of admission or that develop during the stay. All-listed diagnoses include the principal diagnosis plus these additional secondary conditions. All-listed procedures include all procedures performed during the hospital stay. ICD-9-CM is the International Classification of Diseases, Ninth Revision, Clinical Modification, which assigns numeric codes to diagnoses and procedures. There are about 12,000 ICD-9-CM diagnosis codes and 3,500 procedure codes. CCS categorizes ICD-9-CM diagnoses and procedures into 260 clinically meaningful categories.5 This "clinical grouper" makes it easier to quickly understand patterns of diagnoses and procedures. For this Statistical Brief, diabetes hospitalizations were identified using ICD-9-CM diagnosis codes in the range of 250.00–250.93, 790.2–790.29, 791.5–791.6, V45.85, V53.91, and V65.46. Lower-limb amputations were identified using all-listed ICD-9-CM procedure codes in the range of 84.10-84.19 and exclude amputations related to trauma. Admission source Admission source indicates where the patient was located prior to admission to the hospital. Emergency admission indicates the patient was admitted to the hospital through the emergency department. About the NIS The HCUP Nationwide Inpatient Sample (NIS) is a nationwide database of hospital inpatient stays. The NIS is nationally representative of all community hospitals (i.e., short-term, non-Federal, non-rehabilitation hospitals). The NIS is a sample of hospitals and includes all patients from each hospital, regardless of payer. It is drawn from a sampling frame that contains hospitals comprising about 90 percent of all discharges in the United States. The vast size of the NIS allows the study of topics at both the national and regional levels for specific subgroups of patients. In addition, NIS data are standardized across years to facilitate ease of use. About HCUP HCUP is a family of powerful healthcare databases, software tools, and products for advancing research. Sponsored by the Agency for Healthcare Research and Quality (AHRQ), HCUP includes the largest all-payer encounter-level collection of longitudinal healthcare data (inpatient, ambulatory surgery, and emergency department) in the United States, beginning in 1988. HCUP is a Federal-State-Industry Partnership that brings together the data collection efforts of many organizations–such as State data organizations, hospital associations, private data organizations, and the Federal government–to create a national information resource. For more information about HCUP, visit http://www.hcup-us.ahrq.gov/. HCUP would not be possible without the contributions of the following data collection Partners from across the United States: Arizona Department of Health Services Arkansas Department of Health & Human Services California Office of Statewide Health Planning & Development Colorado Health & Hospital Association Connecticut Integrated Health Information (Chime, Inc.) Florida Agency for Health Care Administration Georgia GHA: An Association of Hospitals & Health Systems Hawaii Health Information Corporation Illinois Health Care Cost Containment Council and Department of Public Health Indiana Hospital&Health Association Iowa Hospital Association Kansas Hospital Association Kentucky Cabinet for Health and Family Services Maryland Health Services Cost Review Commission Massachusetts Division of Health Care Finance and Policy Michigan Health & Hospital Association Minnesota Hospital Association Missouri Hospital Industry Data Institute Nebraska Hospital Association Nevada Division of Health Care Financing and Policy, Department of Human Resources New Hampshire Department of Health & Human Services New Jersey Department of Health and Senior Services New York State Department of Health North Carolina Department of Health and Human Services Ohio Hospital Association Oregon Office for Oregon Health Policy and Research and Oregon Association of Hospitals and Health Systems Rhode Island Department of Health South Carolina State Budget and Control Board South Dakota Association of Healthcare Organizations Tennessee Hospital Association Texas Department of State Health Services Utah Department of Health Vermont Association of Hospitals and Health Systems Virginia Health Information Washington State Department of Health West Virginia Health Care Authority Wisconsin Department of Health and Family Services For additional HCUP statistics, visit HCUPnet, our interactive query system at https://datatools.ahrq.gov/hcupnet. References For a detailed description of HCUP and more information on the design of the NIS and methods to calculate estimates, please refer to the following publications: Steiner, C., Elixhauser, A., Schnaier, J. The Healthcare Cost and Utilization Project: An Overview. Effective Clinical Practice 5(3):143–51, 2002. Design of the HCUP Nationwide Inpatient Sample, 2004. Online. August 8, 2006. U.S. Agency for Healthcare Research and Quality. http://www.hcup-us.ahrq.gov/db/nation/nis/reports/NIS_2004_Design_Report.pdf Houchens, R., Elixhauser, A. Final Report on Calculating Nationwide Inpatient Sample (NIS) Variances, 2001. HCUP Methods Series Report #2003-2. Online. June 2005 (revised June 6, 2005). U.S. Agency for Healthcare Research and Quality. http://www.hcup-us.ahrq.gov/reports/methods/2003_02.pdf Houchens, R., Elixhauser, A. Using the HCUP Nationwide Inpatient Sample to Estimate Trends. (Updated for 1988–2004). HCUP Methods Series Report #2006-05 Online. August 18, 2006. U.S. Agency for Healthcare Research and Quality. http://www.hcup-us.ahrq.gov/reports/methods/2006_05_NISTrendsReport_1988-2004.pdf Suggested Citation Russo, C. A., and Jiang, H. J. Hospital Stays among Patients with Diabetes, 2004. HCUP Statistical Brief #17. November 2006. Agency for Healthcare Research and Quality, Rockville, MD. http://www.hcup-us.ahrq.gov/reports/statbriefs/sb17.pdf *** AHRQ welcomes questions and comments from readers of this publication who are interested in obtaining more information about access, cost, use, financing, and quality of healthcare in the United States. We also invite you to tell us how you are using this Statistical Brief and other HCUP data and tools, and to share suggestions on how HCUP products might be enhanced to further meet your needs. Please e-mail us at hcup@ahrq.gov or send a letter to the address below:Irene Fraser, Ph.D., Director Center for Delivery, Organization, and Markets Agency for Healthcare Research and Quality 540 Gaither Road Rockville, MD 20850 1Centers for Disease Control and Prevention, National Center for Chronic Disease Prevention and Health Promotion, National Diabetes Surveillance System, 2004. http://www.cdc.gov/diabetes/statistics/index.htm#prevalence (Accessed on October 24, 2006). 2The denominator is the total number of persons diagnosed with diabetes in the United States in 2004, which was approximately 14.7 million people (CDC, 2004). 3Jiang HJ, Stryer D, Friedman B, Andrews R. Multiple Hospitalizations for Patients with Diabetes. Diabetes Care 26(5):1421-26, 2003. 4HCUP Cost-to-Charge Ratio Files (CCR). Healthcare Cost and Utilization Project (HCUP). 2001–2003. U.S. Agency for Healthcare Research and Quality, Rockville, MD. http://www.hcup-us.ahrq.gov/db/state/costtocharge.jsp. 5HCUP CCS. Healthcare Cost and Utilization Project (HCUP). August 2006. U.S. Agency for Healthcare Research and Quality, Rockville, MD. http://www.hcup-us.ahrq.gov/toolssoftware/ccs/ccs.jsp. |
| Table 1. Hospital stays of patients with diabetes compared to all non-diabetes hospital stays, 2004 | ||||||||
| Principal diagnosis of diabetes | All-listed diagnosis of diabetes* | All non-diabetes hospital stays | ||||||
| Total number of discharges | 512,500 | 6,290,000 | 32,371,800 | |||||
| Mean age | 52.9 | 64.6 | 43.8 | |||||
| Percent male | 50.6% | 46.0% | 39.8% | |||||
| Mean length of stay, days | 5.3 | 5.5 | 4.5 | |||||
| Mean cost of hospitalization | $7,600 | $9,400 | $7,300 | |||||
| Aggregate costs for U.S. (in billions) | $3.9 | $57.8 | $231.1 | |||||
| Percentage admitted through the emergency department | 67.4% | 59.1% | 40.0% | |||||
| Payer: | ||||||||
| Medicare | 35.9% | 53.5% | 29.2% | |||||
| Medicaid | 28.1% | 20.6% | 25.6% | |||||
| Private Insurance | 24.2% | 20.4% | 37.2% | |||||
| Uninsured | 9.1% | 3.3% | 5.0% | |||||
| *All-listed diabetes includes hospital stays with diabetes listed as the principal diagnosis or as a secondary diagnosis. Source: AHRQ, Center for Delivery, Organization, and Markets, Healthcare Cost and Utilization Project, Nationwide Inpatient Sample, 2004. | ||||||||
| Table 2. Top 10 most common principal reasons for hospitalization among patients with diabetes, 2004* | ||||||||
| Rank | Principal diagnosis | Number of hospital stays among patients with diabetes (percentage of all diabetes stays)* | Percentage of hospital stays with diabetes as a coexisting condition** | |||||
| 1 | Diabetes | 512,500 (8.1%) | N/A | |||||
| 2 | Congestive heart failure, non-hypertensive | 442,400 (7.0%) | 40.1% | |||||
| 3 | Coronary atherosclerosis (hardening of the arteries) | 391,400 (6.2%) | 32.8% | |||||
| 4 | Pneumonia | 261,000 (4.1%) | 21.5% | |||||
| 5 | Acute myocardial infarction (heart attack) | 209,700 (3.3%) | 30.2% | |||||
| 6 | Nonspecific chest pain | 202,500 (3.2%) | 23.9% | |||||
| 7 | Complication of device, implant or graft | 158,200 (2.5%) | 26.3% | |||||
| 8 | Acute cerebrovascular disease (stroke) | 153,800 (2.4%) | 28.2% | |||||
| 9 | Cardiac dysrhythmias | 146,100 (2.3%) | 21.1% | |||||
| 10 | Skin and subcutaneous tissue infections | 139,300 (2.2%) | 27.6% | |||||
| *Based on all-listed diagnoses. **Based on records with diabetes as a secondary diagnosis. Source: AHRQ, Center for Delivery, Organization, and Markets, Healthcare Cost and Utilization Project, Nationwide Inpatient Sample, 2004. | ||||||||
|
| Internet Citation: Statistical Brief #17. Healthcare Cost and Utilization Project (HCUP). November 2006. Agency for Healthcare Research and Quality, Rockville, MD. hcup-us.ahrq.gov/reports/statbriefs/sb17.jsp. |
| Are you having problems viewing or printing pages on this website? |
| If you have comments, suggestions, and/or questions, please contact hcup@ahrq.gov. |
| If you are experiencing issues related to Section 508 accessibility of information on this website, please contact hcup@ahrq.gov. |
| Privacy Notice, Viewers & Players |
| Last modified 11/16/06 |