STATISTICAL BRIEF #166 |
November 2013
Anne Pfuntner, Lauren M. Wier, M.P.H., and Anne Elixhauser, Ph.D. Introduction The Agency for Healthcare Research and Quality has provided an annual overview of national statistics on inpatient hospital stays using data from the Healthcare Cost and Utilization Project (HCUP) since 2005. The results from 2005 through 2009 are presented in a series of HCUP Facts and Figures reports.1 The overview of 2010 data was published in Statistical Brief #144, Overview of Hospital Stays in the United States, 2010.2 The present Statistical Brief provides 2011 data on characteristics of stays in community hospitals in the United States and compares the results to data from previous years. Statistics also are included for stays by primary payer, age, discharge status, and community income. All differences between estimates noted in the text are statistically significant at the .001 level or better. Findings Overall characteristics of stays in U.S. hospitals, 1997-2011 Table 1 shows characteristics of stays in U.S. community hospitals in 1997, 2010, and 2011. There were 38.6 million hospital stays in 2011, which is an 11 percent increase since 1997; however, the hospitalization rate remained stable during this period (about 1,240-1,270 stays per 10,000 population). The national distribution of stays by hospital location, teaching status, and ownership remained unchanged between 1997 and 2011. In 2011, most stays (87 percent) occurred in metropolitan hospitals, nearly half of stays occurred in teaching hospitals, and about three quarters of stays were in private, not-for-profit hospitals. The charge per stay is the amount that hospitals bill to patients for their rooms, nursing care, diagnostic tests, procedures, and other services. Mean charges per stay more than doubled since 1997 to $35,400 in 2011 (inflation adjusted). The cost per stay is the amount of the hospital's actual expenses incurred for producing services. Mean costs per stay in 2011 were $10,000, which represents a 47 percent increase since 1997 (inflation adjusted). Aggregate hospital costs were $387.3 billion in 2011; this was a 63 percent increase since 1997 (inflation adjusted). |
|
| Table 1. Characteristics of U.S. community hospitals, 1997, 2010, and 2011 | |||
| Utilization, charges, and costs | 1997 | 2010 | 2011 |
|---|---|---|---|
| Number of stays | |||
| Total stays in millions | 34.7 | 39.0 | 38.6 |
| Stays per 10,000 population | 1,272 | 1,261 | 1,239 |
| Total days of care in millions | 168.1 | 181.7 | 177.6 |
| Mean length of stay, days | 4.8 | 4.7 | 4.6 |
| Percentage of discharges in: | |||
| Metropolitan hospitals | 84 | 87 | 87 |
| Teaching hospitals | 47 | 48 | 48 |
| Hospital ownership | |||
| Non-Federal government hospitals | 14 | 14 | 11 |
| Private not-for-profit hospitals | 73 | 72 | 74 |
| Private for-profit hospitals | 13 | 13 | 14 |
| Charges and costs,* U.S. $ | |||
| Mean charges per stay | 15,100 | 33,800 | 35,400 |
| Mean costs per stay | 6,800 | 10,300 | 10,000 |
| Total aggregate costs, in billions | 237.2 | 401.1 | 387.3 |
| * Charges per stay, costs per stay, and aggregate costs are inflation-adjusted to 2011 dollars. Source: Agency for Healthcare Research and Quality (AHRQ), Center for Delivery, Organization, and Markets, Healthcare Cost and Utilization Project (HCUP), Nationwide Inpatient Sample (NIS), 1997, 2010, and 2011 |
|||
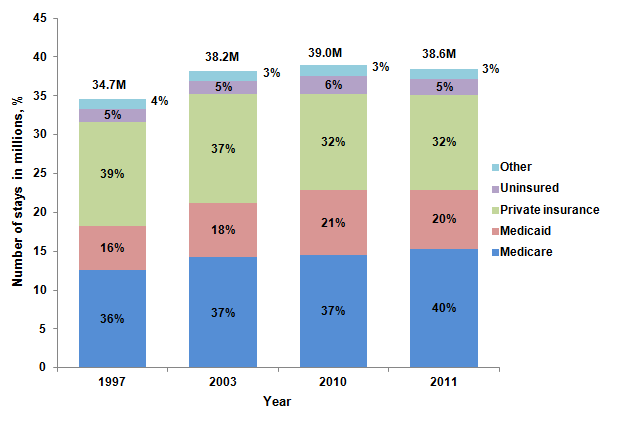
Hospital stays by expected primary payer, 1997-2011 In 2011, more than half of stays (60 percent) were billed to government payers Medicare and Medicaid (Figure 1). The percentage of stays billed to Medicare and Medicaid increased between 1997 and 2011: from 36 percent to 40 percent for Medicare and from 16 percent to 20 percent for Medicaid. The percentage of stays billed to private insurance, however, decreased during this period from 39 percent to 32 percent. The share of uninsured stays and stays billed to other payers remained stable between 1997 and 2011 at about 5 percent and 3 percent of stays, respectively. |
|
Figure 1. Number and distribution of hospital stays by expected primary payer, 1997-2011
Note: Excludes a small number of stays with missing payer. This is a stacked bar chart showing the number of stays in millions in percent by year. 1997 - total 34.7 million: Medicare, 36%; Medicaid, 16%; Private insurance, 39%; Uninsured, 5%; Other, 4%. 2003 - total 38.2 million: Medicare, 37%; Medicaid, 18%; Private insurance, 37%; Uninsured, 5%; Other, 3%. 2010 - total 39.0 million: Medicare, 37%; Medicaid, 21%; Private insurance, 32%; Uninsured, 6%; Other, 3%. 2011 - total 38.6 million: Medicare, 40%; Medicaid, 20%; Private insurance, 32%; Uninsured, 5%; Other, 3%. Note: Excludes a small number of stays with missing payer. Source: Agency for Healthcare Research and Quality (AHRQ), Center for Delivery, Organization, and Markets, Healthcare Cost and Utilization Project (HCUP), Nationwide Inpatient Sample (NIS), 1997, 2003, 2010, and 2011. |
Patient characteristics in U.S. hospitals, 2011 Table 2 shows characteristics of patients who were hospitalized in 2011. With the exception of infants, hospitalization rates increased with age. The high hospitalization rate for infants (10,665 hospital stays per 10,000 population) was largely due to births occurring in the hospital in addition to those infants who required additional hospitalization after birth. Females accounted for 58 percent of hospital stays in 2011; the hospitalization rate for females was also higher than for males (1,411 versus 1,056 stays per 10,000 population). About 30 percent of patients in 2011 were from low-income areas. The hospitalization rate for patients from the lowest income area (1,401 stays per 10,000 population) was higher than for patients from higher income areas (1,155 stays per 10,000 population). Patients residing in large central metropolitan areas accounted for nearly one-third of hospital stays in 2011. Patients from rural areas accounted for the smallest share of stays (18 percent). The hospitalization rate for patients from rural areas was 28 percent higher than for patients living in medium and small metropolitan areas (1,377 stays versus 1,074 stays per 10,000 population). The hospitalization rate was similar for patients living in the Northeast, Midwest, and South (approximately 1,300 stays per 10,000 population). Patients living in the West had lower hospitalization rates than all other regions, at 1,029 stays per 10,000 population. |
| Table 2. Number of stays and stays per 10,000 population by age, sex, median community-level income, patient residence, and region for all hospital stays, 2011 | ||
| Patient characteristics | Number of stays in thousands | Stays per 10,000 population |
|---|---|---|
| All hospital stays | 38,591 | 1,239 |
| Age, years | ||
| <1 | 4,262 | 10,665 |
| 1-17 | 1,402 | 201 |
| 18-44 | 9,385 | 827 |
| 45-64 | 9,695 | 1,171 |
| 65-84 | 10,533 | 2,954 |
| 85+ | 3,283 | 5,723 |
| Sex | ||
| Male | 16,182 | 1,056 |
| Female | 22,334 | 1,411 |
| Median community-level income for patients' ZIP Code | ||
| Lowest quartile | 11,050 | 1,401 |
| Higher quartiles | 26,759 | 1,155 |
| Patient residence | ||
| Large central metropolitan | 11,866 | 1,288 |
| Large fringe metropolitan (suburbs) | 8,954 | 1,180 |
| Medium and small metropolitan | 9,878 | 1,074 |
| Micropolitan and noncore (rural) | 6,975 | 1,377 |
| Region | ||
| Northeast | 7,528 | 1,354 |
| Midwest | 8,769 | 1,306 |
| South | 14,803 | 1,276 |
| West | 7,491 | 1,029 |
| Source: Agency for Healthcare Research and Quality (AHRQ), Center for Delivery, Organization, and Markets, Healthcare Cost and Utilization Project (HCUP), Nationwide Inpatient Sample (NIS), 2011 | ||
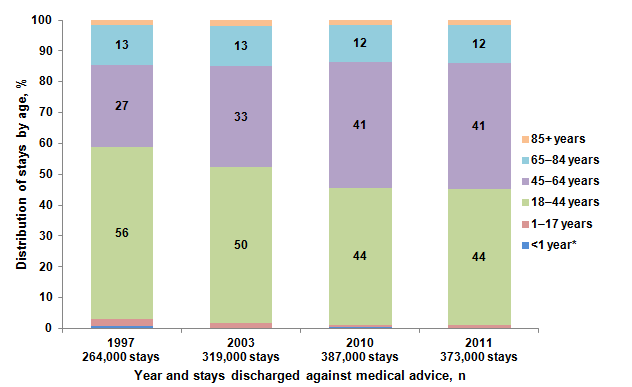
Discharges against medical advice by patient age, 1997-2011 The number of hospital stays discharged against medical advice increased 41 percent between 1997 and 2011 (from 264,000 to 373,000 stays) (Figure 2). Adults aged 18-44 years accounted for 56 percent of stays discharged against medical advice in 1997 and 44 percent in 2011. The share of discharges against medical advice for adults aged 45-64 years increased from 27 percent in 1997 to 41 percent in 2011. Adults aged 65-84 years accounted for 12-13 percent of shares in both years. The youngest and oldest age groups—children aged 17 years and younger and adults aged 85 years and older—accounted for 2 percent or less of stays discharged against medical advice in 1997 and 2011. |
|
Figure 2. Distribution of hospital stays discharged against medical advice by patient age, 1997-2011
* Data for children younger than 1 year were suppressed in 2003. This is a stacked bar chart showing the distribution of stays by age in percent by year and stays discharged against medical advice. 1997 - 264,000 stays: Less than 1 year, 2 percent or less; 1 to 17 years, 2 percent or less; 18 to 44 years, 56%; 45 to 64 years, 27%; 65 to 84 years, 13%; 85 years and older, 2 percent or less. 2003 - 319,000 stays; Data for children younger than 1 year were suppressed in 2003: Less than 1 year, 2 percent or less; 1 to 17 years, 2 percent or less; 18 to 44 years, 50%; 45 to 64 years, 33%; 65 to 84 years, 13%; 85 years and older, 2 percent or less. 2010 - 387,000 stays: Less than 1 year, 2 percent or less; 1 to 17 years, 2 percent or less; 18 to 44 years, 44%; 45 to 64 years, 41%; 65 to 84 years, 12%; 85 years and older, 2 percent or less. 2011 - 373,000 stays: Less than 1 year, 2 percent or less; 1 to 17 years, 2 percent or less; 18 to 44 years, 44%; 45 to 64 years, 41%; 65 to 84 years, 12%; 85 years and older, 2 percent or less. Note: Excludes a small number of stays with missing age. Source: Agency for Healthcare Research and Quality (AHRQ), Center for Delivery, Organization, and Markets, Healthcare Cost and Utilization Project (HCUP), Nationwide Inpatient Sample (NIS), 1997, 2003, 2010, and 2011. |
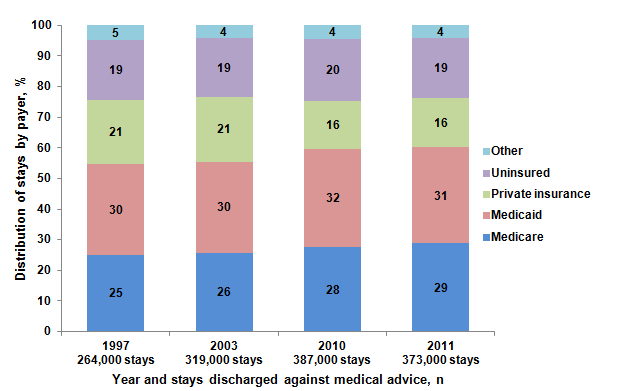
Discharges against medical advice by primary payer, 1997-2011 Figure 3 shows the distribution of hospital stays discharged against medical advice by primary payer between 1997 and 2011. From 1997 to 2011, the proportion of discharges against medical advice increased for stays billed to Medicare, from 25 percent to 29 percent, and decreased for stays billed to private insurance, from 21 percent to 16 percent. The share of discharges against medical advice was stable from 1997 to 2011 for stays billed to Medicaid (30-31 percent), the uninsured (19-20 percent), and other payers (4-5 percent). |
|
Figure 3. Distribution of hospital stays discharged against medical advice by primary payer, 1997-2011
Note: Excludes a small number of stays with missing payer. This is a stacked bar chart showing the distribution of stays by payer in percent by year and stays discharged against medical advice. 1997 - 264,000 stays: Medicare, 25%; Medicaid, 30%; Private Insurance, 21%; Uninsured, 19%; Other, 5%. 2003 - 319,000 stays: Medicare, 26%; Medicaid, 30%; Private Insurance, 21%; Uninsured, 19%; Other, 4%. 2010 - 387,000 stays: Medicare, 28%; Medicaid, 32%; Private Insurance, 16%; Uninsured, 20%; Other, 4%. 2011 - 373,000 stays: Medicare, 29%; Medicaid, 31%; Private Insurance, 16%; Uninsured, 19%; Other, 4%. Note: Excludes a small number of stays with missing payer. Source: Agency for Healthcare Research and Quality (AHRQ), Center for Delivery, Organization, and Markets, Healthcare Cost and Utilization Project (HCUP), Nationwide Inpatient Sample (NIS), 1997, 2003, 2010, and 2011. |
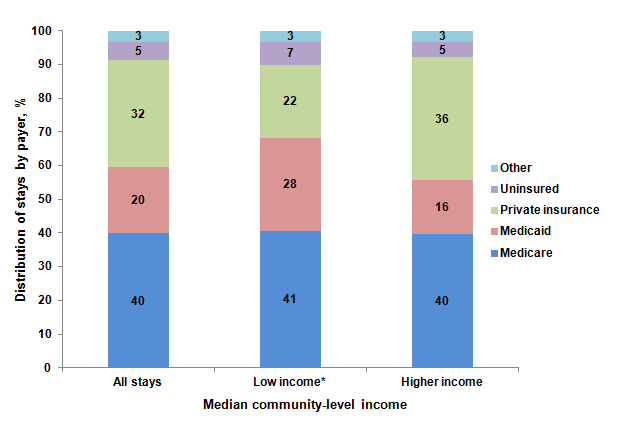
Primary payers by community income level, 2011 Figure 4 shows the distribution of stays by primary payer for patients from all communities (all stays); low-income communities, which were defined as a median household income under $39,000 in 2011; and communities with incomes of $39,000 and higher in 2011. The share of stays was similar for patients across community income levels for Medicare (40-41 percent of stays) and other payers (3 percent of stays). The uninsured accounted for 7 percent of stays for patients from the low-income communities and 5 percent of stays for patients who were from higher income communities. Medicaid, which accounted for 20 percent of all stays, was the primary payer in 28 percent of stays for patients from low-income communities and 16 percent of stays for patients from higher income communities. Private insurance accounted for 22 percent of stays for patients from low-income communities, but it accounted for 32 percent of all stays and 36 percent of stays for patients who were from higher income communities. |
|
Figure 4. Distribution of primary payers for all hospital stays, stays for patients in low-income communities, and stays for patients in all other communities, 2011
* Low-income communities are ZIP Codes with a median household income between $1 and $38,999 in 2011. This is a stacked bar chart showing the distribution of stays by payer in percent by median community-level income. All Stays: Medicare, 40%; Medicaid, 20%; Private Insurance, 32%; Uninsured, 5%; Other, 3%. Low Income (ZIP Codes with a median household income between $1 and $38,999 in 2011): Medicare, 41%; Medicaid, 28%; Private Insurance, 22%; Uninsured, 7%; Other, 3%. Higher Income: Medicare, 40%; Medicaid, 16%; Private Insurance, 36%; Uninsured, 5%; Other, 3%. Note: Excludes a small number of stays with missing payer or income.Source: Agency for Healthcare Research and Quality (AHRQ), Center for Delivery, Organization, and Markets, Healthcare Cost and Utilization Project (HCUP), Nationwide Inpatient Sample (NIS), 2011. |
Data Source
The estimates in this Statistical Brief are based upon data from the Healthcare Cost and Utilization Project (HCUP) 2011 Nationwide Inpatient Sample (NIS). Historical data were drawn from the 1997, 2003, and 2010 NIS. The statistics were generated from HCUPnet, a free, online query system that provides users with immediate access to the largest set of publicly available, all-payer national, regional, and State-level hospital care databases from HCUP.3 Average costs per stays and total aggregate costs were not available in HCUPnet for 1997; these statistics were separately calculated using the HCUP 1997 NIS. Supplemental data sources included population denominator data for use with HCUP databases.4 Many hypothesis tests were conducted for this Statistical Brief. Thus, to decrease the number of false-positive results, we reduced the significance level to .001 for individual tests. Definitions Types of hospitals included in HCUP HCUP is based on data from community hospitals, which are defined as short-term, non-Federal, general, and other hospitals, excluding hospital units of other institutions (e.g., prisons). HCUP data include obstetrics and gynecology, otolaryngology, orthopedic, cancer, pediatric, public, and academic medical hospitals. Excluded are long-term care, rehabilitation, psychiatric, and alcoholism and chemical dependency hospitals. However, if a patient received long-term care, rehabilitation, or treatment for psychiatric or chemical dependency conditions in a community hospital, the discharge record for that stay will be included in the NIS. Unit of analysis The unit of analysis is the hospital discharge (i.e., the hospital stay), not a person or patient. This means that a person who is admitted to the hospital multiple times in one year will be counted each time as a separate "discharge" from the hospital. Costs and charges Total hospital charges were converted to costs using HCUP Cost-to-Charge Ratios based on hospital accounting reports from the Centers for Medicare & Medicaid Services (CMS).5 Costs will reflect the actual expenses incurred in the production of hospital services, such as wages, supplies, and utility costs; charges represent the amount a hospital billed for the case. For each hospital, a hospital-wide cost-to-charge ratio is used. Hospital charges reflect the amount the hospital billed for the entire hospital stay and do not include professional (physician) fees. For the purposes of this Statistical Brief, costs and charges are reported to the nearest hundred. Hospital location The classification of whether a hospital is in a metropolitan area ("urban") or nonmetropolitan area ("rural") is defined from the American Hospital Association (AHA) Annual Survey, using the 1993 U.S. Office of Management and Budget definition. Location of patients' residence Place of residence is based on the urban-rural classification scheme for U.S. counties developed by the National Center for Health Statistics (NCHS):
Median community-level income is the median household income of the patient's ZIP Code of residence. The cut-offs for the quartile designation are determined using ZIP Code demographic data obtained from the Nielsen Company. The income quartile is missing for homeless and foreign patients. In 2011, low-income communities (the lowest quartile) are defined as having a median household income between $1 and $38,999. Payer Payer is the expected primary payer for the hospital stay. To make coding uniform across all HCUP data sources, payer combines detailed categories into general groups:
When more than one payer is listed for a hospital discharge, the first-listed payer is used. Region Region is one of the four regions defined by the U.S. Census Bureau:
Discharge status reflects the disposition of the patient at discharge from the hospital and includes the following six categories: routine (to home); transfer to another short-term hospital; other transfers (including skilled nursing facility, intermediate care, and another type of facility such as a nursing home); home healthcare; against medical advice (AMA); or died in the hospital. About HCUP HCUP is a family of powerful healthcare databases, software tools, and products for advancing research. Sponsored by the Agency for Healthcare Research and Quality (AHRQ), HCUP includes the largest all-payer encounter-level collection of longitudinal healthcare data (inpatient, ambulatory surgery, and emergency department) in the United States, beginning in 1988. HCUP is a Federal-State-Industry Partnership that brings together the data collection efforts of many organizations—such as State data organizations, hospital associations, private data organizations, and the Federal government—to create a national information resource. HCUP would not be possible without the contributions of the following data collection Partners from across the United States: Alaska State Hospital and Nursing Home Association Arizona Department of Health Services Arkansas Department of Health California Office of Statewide Health Planning and Development Colorado Hospital Association Connecticut Hospital Association Florida Agency for Health Care Administration Georgia Hospital Association Hawaii Health Information Corporation Illinois Department of Public Health Indiana Hospital Association Iowa Hospital Association Kansas Hospital Association Kentucky Cabinet for Health and Family Services Louisiana Department of Health and Hospitals Maine Health Data Organization Maryland Health Services Cost Review Commission Massachusetts Center for Health Information and Analysis Michigan Health & Hospital Association Minnesota Hospital Association Mississippi Department of Health Missouri Hospital Industry Data Institute Montana MHA - An Association of Montana Health Care Providers Nebraska Hospital Association Nevada Department of Health and Human Services New Hampshire Department of Health & Human Services New Jersey Department of Health New Mexico Department of Health New York State Department of Health North Carolina Department of Health and Human Services North Dakota (data provided by the Minnesota Hospital Association) Ohio Hospital Association Oklahoma State Department of Health Oregon Association of Hospitals and Health Systems Oregon Health Policy and Research Pennsylvania Health Care Cost Containment Council Rhode Island Department of Health South Carolina Budget & Control Board South Dakota Association of Healthcare Organizations Tennessee Hospital Association Texas Department of State Health Services Utah Department of Health Vermont Association of Hospitals and Health Systems Virginia Health Information Washington State Department of Health West Virginia Health Care Authority Wisconsin Department of Health Services Wyoming Hospital Association About the NIS The HCUP Nationwide Inpatient Sample (NIS) is a nationwide database of hospital inpatient stays. The NIS is nationally representative of all community hospitals (i.e., short-term, non-Federal, nonrehabilitation hospitals). The NIS is a sample of hospitals and includes all patients from each hospital, regardless of payer. It is drawn from a sampling frame that contains hospitals comprising more than 95 percent of all discharges in the United States. The vast size of the NIS allows the study of topics at both the national and regional levels for specific subgroups of patients. In addition, NIS data are standardized across years to facilitate ease of use. About HCUPnet HCUPnet is an online query system that offers instant access to the largest set of all-payer healthcare databases publicly available. HCUPnet has an easy step-by-step query system, allowing for tables and graphs to be generated on national and regional statistics as well as trends for community hospitals in the United States. HCUPnet generates statistics using data from HCUP's Nationwide Inpatient Sample (NIS), the Kids' Inpatient Database (KID), the Nationwide Emergency Department Sample (NEDS), the State Inpatient Databases (SID), and the State Emergency Department Databases (SEDD). For More Information For more information about HCUP, visit http://www.hcup-us.ahrq.gov/. For additional HCUP statistics, visit HCUPnet, our interactive query system, at https://datatools.ahrq.gov/hcupnet. For information on other hospitalizations in the United States, refer to the following HCUP Statistical Briefs located at http://www.hcup-us.ahrq.gov/reports/statbriefs/statbriefs.jsp: .
Introduction to the HCUP Nationwide Inpatient Sample, 2011. Online. June 2013. U.S. Agency for Healthcare Research and Quality. https://www.hcup-us.ahrq.gov/db/nation/nis/NIS_Introduction_2011.pdf. Accessed October 16, 2013. Houchens RL, Elixhauser A. Using the HCUP Nationwide Inpatient Sample to Estimate Trends. (Updated for 1988-2004). HCUP Methods Series Report #2006-05. August 18, 2006. Rockville, MD: U.S. Agency for Healthcare Research and Quality http://www.hcup-us.ahrq.gov/reports/methods/2006_05_NISTrendsReport_1988-2004.pdf. Accessed October 16, 2013. Suggested Citation Pfuntner A (Truven Health Analytics), Wier LM (Truven Health Analytics), Elixhauser A (AHRQ). Overview of Hospital Stays in the United States, 2011. HCUP Statistical Brief #166. November 2013. Agency for Healthcare Research and Quality, Rockville, MD. http://www.hcup-us.ahrq.gov/reports/statbriefs/sb166.pdf. *** AHRQ welcomes questions and comments from readers of this publication who are interested in obtaining more information about access, cost, use, financing, and quality of healthcare in the United States. We also invite you to tell us how you are using this Statistical Brief and other HCUP data and tools, and to share suggestions on how HCUP products might be enhanced to further meet your needs. Please e-mail us at hcup@ahrq.gov or send a letter to the address below:Irene Fraser, Ph.D., Director Center for Delivery, Organization, and Markets Agency for Healthcare Research and Quality 540 Gaither Road Rockville, MD 20850 1 HCUP Facts and Figures. Healthcare Cost and Utilization Project (HCUP). June 2013. Rockville, MD: Agency for Healthcare Research and Quality. http://www.hcup-us.ahrq.gov/reports/factsandfigures.jsp. Accessed November 4, 2013. 2 Pfuntner A, Wier LM, Elixhauser, A. Overview of Hospital Stays in the United States, 2010. HCUP Statistical Brief #144. December 2012. Agency for Healthcare Research and Quality, Rockville, MD. http://www.hcup-us.ahrq.gov/reports/statbriefs/sb144.pdf. Accessed November 4, 2013. 3 Agency for Healthcare Research and Quality. HCUPnet website. https://datatools.ahrq.gov/hcupnet. Accessed November 4, 2013. 4 Barrett M, Lopez-Gonzalez L, Coffey R, Levit K. Population Denominator Data for use with the HCUP Databases (Updated with 2012 Population data). HCUP Methods Series Report #2013-01. March 8, 2013. Rockville, MD: U.S. Agency for Healthcare Research and Quality. http://www.hcup-us.ahrq.gov/reports/methods/2013_01.pdf. Accessed November 4, 2013. 5 HCUP Cost-to-Charge Ratio Files (CCR). Healthcare Cost and Utilization Project (HCUP). 2001-2009. Rockville, MD: U.S. Agency for Healthcare Research and Quality. Updated August 2013. http://www.hcup-us.ahrq.gov/db/state/costtocharge.jsp. Accessed November 4, 2013. |