STATISTICAL BRIEF #156 |
May 2013
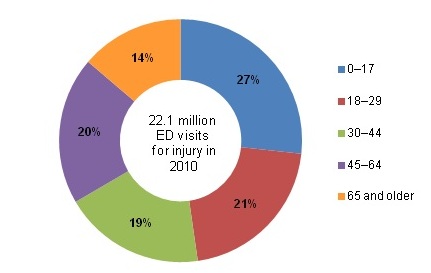
Andrés Villaveces, M.D., M.P.H., Ph.D., Ryan Mutter, Ph.D., Pamela L. Owens, Ph.D., and Marguerite L. Barrett, M.S. Introduction One person dies from an injury every 3 minutes in the United States.1 More Americans aged 1-44 years die from injuries such as motor vehicle crashes, falls, or homicides than from any other cause, including cancer, HIV, or influenza.2 Non-fatal injuries can have physical and financial consequences that impact the lives of individuals and their families. In addition, the treatment of injuries places an enormous burden on hospital emergency departments (EDs) and trauma care systems.3 This Statistical Brief presents data from the Healthcare Cost and Utilization Project (HCUP) Nationwide Emergency Department Sample (NEDS) on the most common causes of injuries that were treated in the ED in 2010. These visits began with treatment in the ED and either resulted in admission to the same hospital or did not result in admission (i.e., the patient was treated, stabilized and released from the ED; transferred to another hospital; or died in the ED). ED visits for injury are described based on the external cause of injury (e.g., falls, transport related, poisoning, burns, drowning, other blunt injuries). The distribution of injuries by severity, percentage of ED visits that result in admission to the same hospital, and total costs for admitted patients are also presented. Findings Injuries treated in the emergency department Of the 129 million ED visits in the United States in 2010, over 22 million (17 percent) were due to injuries. Patients younger than 30 years accounted for 48 percent of all injury-related ED visits, with pediatric patients (younger than 18 years) accounting for over one-quarter of all injury-related ED visits (figure 1). |
|
|
Figure 1. Injury-related emergency department visits by age group
Source: Agency for Healthcare Research and Quality (AHRQ) Center for Delivery, Organization, and Markets, Healthcare Cost and Utilization Project (HCUP), Nationwide Emergency Department Sample (NEDS), 2010 Figure 1 is a pie chart showing injury-related emergency department visits by age group. Ages 0 through 17, 27%, Ages 18 through 29, 21%, Ages 30 through 44, 19%, Ages 45 through 64, 20%, Ages 65 and older, 14%. Source: Agency for Healthcare Research and Quality, Center for Delivery, Organization, and Markets, Healthcare Cost and Utilization Project, Nationwide Emergency Department Sample, 2010.
|
Table 1 presents the distribution of ED visits by cause of injury overall and by age group. The most common cause was falls (35.7 percent), followed by being struck by an object (18.3 percent) and motor vehicle injuries (12.5 percent). Although falls were the most common type of injury that resulted in an ED visit for all age groups, falls were much more common among those aged 65 years and older (71.2 percent) compared to the younger age groups (ages 0—17, 37.3 percent; ages 18—44, 21.9 percent; ages 45—64, 36.7 percent). Children (ages 0—17) had the largest proportion of injuries related to being struck by an object (26.5 percent) compared to the older age groups (ages 18—44, 19.7 percent; ages 45—64, 12.7 percent; ages 65 and older, 6.2 percent).
|
| Table 1. Injury-related emergency department visits by cause (ranked by frequency) and distribution by age group | ||||||
| Cause of Injurya | Total number of injury-related ED visits | Percentage of injury-related ED visits by age group | ||||
|---|---|---|---|---|---|---|
| All ages | Ages 0—17 | Ages 18—44 | Ages 45—64 | Ages 65 and older | ||
| All injuries | 22,069,400 | |||||
| Falls | 7,883,700 | 35.7 | 37.3 | 21.9 | 36.7 | 71.2 |
| Struck by object | 4,033,900 | 18.3 | 26.5 | 19.7 | 12.7 | 6.2 |
| Motor vehicle | 2,765,900 | 12.5 | 6.0 | 18.0 | 14.5 | 6.4 |
| Overexertion | 2,263,600 | 10.3 | 7.8 | 13.6 | 11.0 | 4.2 |
| Cut | 2,216,400 | 10.0 | 7.9 | 12.9 | 10.7 | 5.2 |
| Nature/environment | 1,102,500 | 5.0 | 6.2 | 4.6 | 5.3 | 3.2 |
| Poison | 727,500 | 3.3 | 2.6 | 3.8 | 4.2 | 1.9 |
| Other transport | 686,200 | 3.1 | 4.6 | 3.0 | 2.8 | 1.1 |
| Fire | 390,800 | 1.8 | 1.8 | 2.1 | 1.8 | 0.7 |
| Machinery | 125,400 | 0.6 | 0.1 | 0.7 | 1.0 | 0.5 |
| Firearm | 71,500 | 0.3 | 0.1 | 0.6 | 0.2 | 0.1 |
| Suffocation | 28,300 | 0.1 | 0.2 | 0.1 | 0.1 | 0.2 |
| Drowning | 12,900 | 0.1 | 0.1 | 0.0 | 0.0 | 0.0 |
| aCauses of injuries are ranked by the total number of injury-related ED visits. Because some ED visits involve more than one type of injury (i.e., cause of injury), the sum of ED visits across causes of injury is larger than the total of all injuries. Source: Agency for Healthcare Research and Quality (AHRQ) Center for Delivery, Organization, and Markets, Healthcare Cost and Utilization Project (HCUP), Nationwide Emergency Department Sample (NEDS), 2010. |
||||||
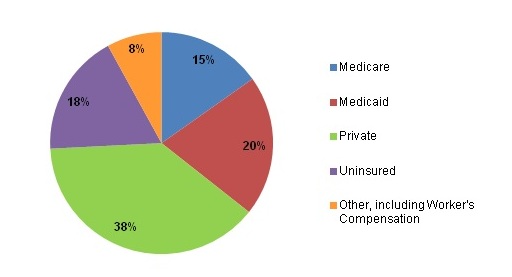
Primary payer and severity of injuries treated in the emergency department Figure 2 presents the distribution of injury-related ED visits by expected primary payer. Injury-related ED visits were covered most frequently by private insurance (38 percent) or Medicaid (20 percent). Uninsured patients represented 18 percent of all injury-related ED visits. |
|
Figure 2. Injury-related emergency department visits by expected primary payer
Source: Agency for Healthcare Research and Quality (AHRQ) Center for Delivery, Organization, and Markets, Healthcare Cost and Utilization Project (HCUP), Nationwide Emergency Department Sample (NEDS), 2010. Figure 2 is a pie chart showing injury-related emergency department visits by expected primary payer. Medicare, 15%, Medicaid, 20%, Private, 38%, Uninsured, 18%, Other, including Worker's Compensation, 8%. Source: Agency for Healthcare Research and Quality, Center for Delivery, Organization, and Markets, Healthcare Cost and Utilization Project, Nationwide Emergency Department Sample, 2010.
|
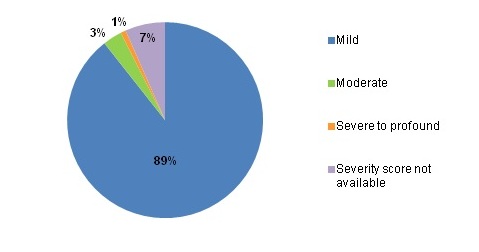
Figure 3 presents the distribution of injury-related ED visits by severity. Eighty-nine percent of the injuries were classified as mild. Almost all mild injuries (96 percent) were treated and released from the ED (data not shown). Severe to profound injuries accounted for only one percent of the injuries.
|
|
Figure 3. Injury-related emergency department visits by severity of injury
Source: Agency for Healthcare Research and Quality (AHRQ) Center for Delivery, Organization, and Markets, Healthcare Cost and Utilization Project (HCUP), Nationwide Emergency Department Sample (NEDS), 2010. Figure 3 is a pie chart showing injury-related emergency department visits by expected primary payer. Mild, 89%, Moderate, 3%, Severe to profound, 1%, Severity score not available, 7%. Source: Agency for Healthcare Research and Quality, Center for Delivery, Organization, and Markets, Healthcare Cost and Utilization Project, Nationwide Emergency Department Sample, 2010.
|
Cost of injuries when patient is admitted to the hospital for treatment Table 2 reports that 6.5 percent of injury-related ED visits resulted in an admission to the hospital. Injuries that most frequently led to admissions were related to firearms (admission rate of 37.9 percent) and poisoning (admission rate of 35.7 percent). One in five injuries due to suffocation (admission rate of 22.8 percent) or drowning (admission rate of 20.3 percent) was admitted. The admission rate for all other types of injuries was less than 10 percent. ED and inpatient costs across all causes of injury in 2010 were $19.4 billion for admitted patients. The cause of injury with the highest associated cost was falls ($9.2 billion), followed by motor vehicle transport injuries ($5.1 billion) and poison-related injuries ($1.8 billion). |
| Table 2. Proportion of injury-related emergency department visits admitted to the same hospital and the total hospital cost for those admissions | ||||
| Cause of Injurya | Total number of injury-related ED visits | Number of injury-related ED visits that resulted in admission to the same hospital | Percentage admitted to the same hospital | Total ED and inpatient cost of ED injury admissions (in millions) |
|---|---|---|---|---|
| All injuries | 22,069,400 | 1,442,900 | 6.5 | $19,410 |
| Falls | 7,883,700 | 720,600 | 9.1 | $9,210 |
| Motor vehicle | 2,765,900 | 218,200 | 7.9 | $5,050 |
| Poison | 727,500 | 260,100 | 35.7 | $1,760 |
| Other transport | 686,200 | 59,000 | 8.6 | $880 |
| Struck by object | 4,033,900 | 64,300 | 1.6 | $720 |
| Firearm | 71,500 | 27,100 | 37.9 | $650 |
| Cut | 2,216,400 | 40,900 | 1.8 | $440 |
| Fire | 390,800 | 16,600 | 4.3 | $340 |
| Nature/environment | 1,102,500 | 23,100 | 2.1 | $240 |
| Overexertion | 2,263,600 | 16,500 | 0.7 | $150 |
| Machinery | 125,400 | 9,700 | 7.7 | $140 |
| Suffocation | 28,300 | 6,400 | 22.8 | $110 |
| Drowning | 12,900 | 2,600 | 20.3 | $40 |
| aCauses of injury are ranked by the total cost of ED injury admissions. Because some ED visits involve more than one type of injury (i.e., cause of injury), the sum of ED visits and costs across causes of injury is larger than the total of all injuries. Source: Agency for Healthcare Research and Quality (AHRQ) Center for Delivery, Organization, and Markets, Healthcare Cost and Utilization Project (HCUP), Nationwide Emergency Department Sample (NEDS), 2010. |
||||
Data Source
The estimates in this Statistical Brief are based upon data from the Healthcare Cost and Utilization Project (HCUP) 2010 Nationwide Emergency Department Sample (NEDS). Definitions Injury Emergency department (ED) visits with injuries are identified by International Classification of Diseases, Ninth Revision, Clinical Modification (ICD-9-CM) diagnosis codes. ICD-9-CM assigns numeric codes to diagnoses. There are approximately 14,000 ICD-9-CM diagnosis codes. Injuries are identified by the first-listed diagnosis using a scheme recommended by the Safe States Alliance.4 The table below lists the diagnosis codes in the range 800—999 used to identify injuries: |
| 800-909.2, 909.4, 909.9 | Fractures; dislocations; sprains and strains; intracranial injury; internal injury of thorax, abdomen, and pelvis; open wound of the head, neck, trunk, upper limb, and lower limb; injury to blood vessels; late effects of injury, poisoning, toxic effects, and other external causes, excluding those of complications of surgical and medical care and drugs, medicinal or biological substances. |
| 910-994.9 | Superficial injury; contusion; crushing injury; effects of foreign body entering through orifice; burns; injury to nerves and spinal cord; traumatic complications and unspecified injuries; poisoning and toxic effects of substances; other and unspecified effects of external causes. |
| 995.5-995.59 | Child maltreatment syndrome. |
| 995.80-995.85 | Adult maltreatment, unspecified; adult physical abuse; adult emotional/ psychological abuse; adult sexual abuse; adult neglect (nutritional); other adult abuse and neglect. |
| Excludes: | |
| 909.3, 909.5 | Late effect of complications of surgical and medical care and late effects of adverse effects of drug, medicinal, or biological substance. |
| 995.0-995.4, 995.6-995.7, 995.86, 995.89 | Other anaphylactic shock; angioneurotic edema; unspecified adverse effect of drug, medicinal and biological substance; allergy, unspecified; shock due to anesthesia; anaphylactic shock due to adverse food reaction; malignant hyperpyrexia or hypothermia due to anesthesia. |
| 996-999 | Complications of surgical and medical care, not elsewhere classified |
Causes of injury The cause of injury is determined by the external cause of injury codes (a subset of the ICD-9-CM diagnosis codes). The codes are consistent with the classification system used by the Centers for Disease Control (CDC) that is documented at http://www.cdc.gov/injury/wisqars/ecode_matrix.html. The NEDS includes 11 data elements that identify the cause of the injury: cutting, drowning, falling, fire, firearm, machinery, motor vehicle, natural/environmental, poisoning, suffocation, and being struck. This Statistical Brief allows a single ED visit to include multiple causes if there were multiple injuries. For example, if an individual was treated in the ED following a motor vehicle accident in which he/she was burned by an engine fire, the ED visit would be counted under motor vehicle injuries and fire injuries. Injury severity The injury severity score is assigned using a publicly available Stata program for Injury Classification (ICDPIC). The program uses ICD-9-CM diagnosis codes to assign a severity score ranging from 1 to 75, with 75 being the most severe. The Injury Severity Score (ISS) is based on an anatomical scoring system that provides an overall score for patients with multiple injuries. Each injury is assigned an Abbreviated Injury Scale (AIS) score, allocated to one of six body regions: head, face, chest, abdomen, extremities (including pelvis), and external. Only the highest AIS score in each body region is used. To produce the ISS score, the score of the three most severely injured body regions is squared and the results are added to produce the ISS score. The ISS correlates linearly with mortality, morbidity, hospital stay, and other measures of severity. Injuries are categorized by severity score as mild (less than 9), moderate (9-15), severe (16-25), and profound (greater than 25). More information on the ISS is available at https://aci.health.nsw.gov.au/get-involved/institute-of-trauma-and-injury-management/data/injury-scoring/injury_severity_score. Types of hospitals included in HCUP HCUP is based on data from community hospitals, which are defined as short-term, non-Federal, general, and other hospitals, excluding hospital units of other institutions (e.g., prisons). HCUP data include obstetrics and gynecology, otolaryngology, orthopedic, cancer, pediatric, public, and academic medical hospitals. Excluded are long-term care, rehabilitation, psychiatric, and alcoholism and chemical dependency hospitals. Community hospitals included in the Nationwide Emergency Department Sample (NEDS) have hospital-based emergency departments with no more than 90 percent of their ED visits resulting in admission. Unit of analysis The unit of analysis is the emergency department (ED) encounter, not a person or patient. This means that a person who is seen in the ED multiple times in one year will be counted each time as a separate "encounter" in the ED. Costs and charges Total hospital charges were converted to costs using HCUP Cost-to-Charge Ratios based on hospital accounting reports from the Centers for Medicare & Medicaid Services (CMS).5 Costs will reflect the actual expenses incurred in the production of hospital services, such as wages, supplies, and utility costs; charges represent the amount a hospital billed for the case. Total costs include costs for both ED and inpatient services and are only reported for ED visits that result in admission. For each hospital, a hospital-wide cost-to-charge ratio is used. Hospital charges reflect the amount the hospital billed for the entire hospital stay and do not include professional (physician) fees. For the purposes of this Statistical Brief, costs are reported in millions. Payer Payer is the expected primary payer for the hospital stay. To make coding uniform across all HCUP data sources, payer combines detailed categories into general groups:
When more than one payer is listed for a hospital discharge, the first-listed payer is used. About HCUP HCUP is a family of powerful healthcare databases, software tools, and products for advancing research. Sponsored by the Agency for Healthcare Research and Quality (AHRQ), HCUP includes the largest all-payer encounter-level collection of longitudinal healthcare data (inpatient, ambulatory surgery, and emergency department) in the United States, beginning in 1988. HCUP is a Federal-State-Industry Partnership that brings together the data collection efforts of many organizations—such as State data organizations, hospital associations, private data organizations, and the Federal government—to create a national information resource. HCUP would not be possible without the contributions of the following data collection Partners from across the United States: Alaska State Hospital and Nursing Home Association Arizona Department of Health Services Arkansas Department of Health California Office of Statewide Health Planning and Development Colorado Hospital Association Connecticut Hospital Association Florida Agency for Health Care Administration Georgia Hospital Association Hawaii Health Information Corporation Illinois Department of Public Health Indiana Hospital Association Iowa Hospital Association Kansas Hospital Association Kentucky Cabinet for Health and Family Services Louisiana Department of Health and Hospitals Maine Health Data Organization Maryland Health Services Cost Review Commission Massachusetts Center for Health Information and Analysis Michigan Health & Hospital Association Minnesota Hospital Association Mississippi Department of Health Missouri Hospital Industry Data Institute Montana MHA - An Association of Montana Health Care Providers Nebraska Hospital Association Nevada Department of Health and Human Services New Hampshire Department of Health & Human Services New Jersey Department of Health New Mexico Department of Health New York State Department of Health North Carolina Department of Health and Human Services North Dakota (data provided by the Minnesota Hospital Association) Ohio Hospital Association Oklahoma State Department of Health Oregon Association of Hospitals and Health Systems Oregon Health Policy and Research Pennsylvania Health Care Cost Containment Council Rhode Island Department of Health South Carolina Budget & Control Board South Dakota Association of Healthcare Organizations Tennessee Hospital Association Texas Department of State Health Services Utah Department of Health Vermont Association of Hospitals and Health Systems Virginia Health Information Washington State Department of Health West Virginia Health Care Authority Wisconsin Department of Health Services Wyoming Hospital Association About the NEDS The HCUP Nationwide Emergency Department Sample (NEDS) is a unique and powerful database that yields national estimates of emergency department (ED) visits. The NEDS was constructed using records from both the HCUP State Emergency Department Databases (SEDD) and the State Inpatient Databases (SID). The SEDD capture information on ED visits that do not result in an admission (i.e., treat-and-release visits and transfers to another hospital); the SID contain information on patients initially seen in the emergency room and then admitted to the same hospital. The NEDS was created to enable analyses of ED utilization patterns and to support public health professionals, administrators, policymakers, and clinicians in their decision making regarding this critical source of care. The NEDS is produced annually beginning in 2006. For More Information For more information about HCUP, visit http://www.hcup-us.ahrq.gov/. For additional HCUP statistics, visit HCUPnet, our interactive query system, at https://datatools.ahrq.gov/hcupnet. For information on other hospitalizations in the United States, download HCUP Facts and Figures: Statistics on Hospital-Based Care in the United States in 2009, located at http://www.hcup-us.ahrq.gov/reports.jsp. For a detailed description of HCUP, more information on the design of the Nationwide Emergency Department Sample (NEDS), and methods to calculate estimates, please refer to the following publications: Introduction to the HCUP Nationwide Emergency Department Sample, 2010. Online. November 2012. U.S. Agency for Healthcare Research and Quality. http://hcup-us.ahrq.gov/db/nation/neds/NEDS2010Introductionv3.pdf. Accessed May 6, 2013. Houchens R, Elixhauser A. Final Report on Calculating Nationwide Inpatient Sample (NIS) Variances, 2001. HCUP Methods Series Report #2003-2. Online. June 2005 (revised June 6, 2005). U.S. Agency for Healthcare Research and Quality. http://www.hcup-us.ahrq.gov/reports/methods/2003_02.pdf. Accessed May 6, 2013. Suggested Citation Villaveces A (RAND), Mutter R (AHRQ), Owens PL (AHRQ), Barrett ML (M. L. Barrett). Causes of Injuries Treated in the Emergency Department, 2010. HCUP Statistical Brief #156. May 2013. Agency for Healthcare Research and Quality, Rockville, MD. http://www.hcup-us.ahrq.gov/reports/statbriefs/sb156.pdf. *** AHRQ welcomes questions and comments from readers of this publication who are interested in obtaining more information about access, cost, use, financing, and quality of healthcare in the United States. We also invite you to tell us how you are using this Statistical Brief and other HCUP data and tools, and to share suggestions on how HCUP products might be enhanced to further meet your needs. Please e-mail us at hcup@ahrq.gov or send a letter to the address below:Irene Fraser, Ph.D., Director Center for Delivery, Organization, and Markets Agency for Healthcare Research and Quality 540 Gaither Road Rockville, MD 20850 1 Centers for Disease Control and Prevention. Injury: The Leading Cause of Death Among Persons 1-44. Injury Prevention and Control. Updated March 14, 2013. https://www.cdc.gov/injury/wisqars/overview/key_data.html. Accessed May 6, 2013. 2 Centers for Disease Control and Prevention. Saving Lives and Protecting People from Violence and Injuries. Injury Center. Updated November 27, 2012. www.cdc.gov/injury/pdfs/som_focusarea/NCIPC_FactSheet_O_v14.pdf. Accessed May 6, 2013. 3 Centers for Disease Control and Prevention. Injury Response. Injury Center. Updated September 8, 2011. Original source is no longer available on the Web; for related information, refer to: National Center for Injury Prevention and Control. CDC Injury Research Agenda, 2009-018. Atlanta, GA: US Department of Health and Human Services, Centers for Disease Control and Prevention; 2009. https://stacks.cdc.gov/view/cdc/21769. Accessed November 8, 2017. 4Injury Surveillance Workgroup. Consensus Recommendations for Using Hospital Discharge Data for Injury Surveillance. Marietta (GA): State and Territorial Injury Prevention Directors Association; 2003. http://www.safestates.org/associations/5805/files/HospitalDischargeData.pdf. 5HCUP Cost-to-Charge Ratio Files (CCR). Healthcare Cost and Utilization Project (HCUP). 2001-2009. U.S. Agency for Healthcare Research and Quality, Rockville, MD. Updated September 2012. http://www.hcup-us.ahrq.gov/db/state/costtocharge.jsp. Accessed May 6, 2013. |