STATISTICAL BRIEF #155 |
May 2013
Dana Kindermann M.D., M.P.H., Ryan Mutter, Ph.D., and Jesse M. Pines, M.D., M.B.A., M.S.C.E. Introduction The Emergency Medicine Treatment and Labor Act (EMTALA), passed by Congress in 1986, mandates that hospitals conduct a medical screening exam for all patients presenting for care in the emergency department (ED) regardless of their citizenship, legal status, or ability to pay.1 Hospitals vary widely in the services they offer to care for patients with acute and chronic medical problems. When a hospital does not have the ability or capacity to handle a patient's condition, the decision often is made to transfer the patient to another acute care hospital. Reasons for transfer are based on the patient's clinical needs and the hospital's available services and resources.2 Patients often are moved to specialty centers or to hospitals capable of providing higher levels of care that are not available in the original hospital.3 Transfer may be based on available specialty coverage; studies have shown increasingly sparse coverage for some specialties.4,5 In most cases, hospitals with specialized capabilities are obligated to accept transfers from hospitals that lack the capability to treat emergency medical conditions. This Statistical Brief presents national estimates from the Healthcare Cost and Utilization Project (HCUP) on ED visits in 2009 and focuses on transfers out of EDs to other acute care hospitals. Patient factors such as age, sex, and primary expected payer, as well as hospital factors such as trauma level, teaching status, and ownership are examined with respect to patient disposition at discharge from the ED. We compare the distribution of ED transfers to other dispositions, including admission to the hospital and treatment and release from the ED. Transferred patients may have more in common with admitted patients than treat-and-release patients because they need a higher level of care prior to discharge. It is important to note that not all transferred patients are admitted after being evaluated in the receiving hospital's ED; however, it was not possible to examine this issue in the current analysis. Several specific diagnostic categories also are explored, particularly with respect to rates of transfer. All differences between estimates noted in the text are statistically significant at the 0.05 level or better. |
|
Findings
General findings In 2009, there were an estimated 128,885,040 ED encounters. Most ED encounters (82.8 percent) resulted in treatment and release (routine discharge), but 15.7 percent were admitted to the same hospital (table 1). Approximately 1.5 percent of ED encounters resulted in transfer to another short-term acute care hospital. Patient factors ED encounters resulting in transfer differed from encounters resulting in admission and treatment and release. In particular, children younger than 1 year had relatively high transfer rates, which may be related to a lack of ED or inpatient providers with experience caring for children with problems that require more complex care. Also, patients aged 65 years and older were transferred at nearly twice the rate of the overall average (2.7 percent compared to 1.5 percent). The disposition of encounters also differed by the patient's primary expected payer. Encounters by patients covered by Medicare were more likely to be transferred (2.5 percent) compared to encounters by patients with other types of insurance. However, encounters by patients without insurance had the lowest likelihood of transfer (0.8 percent) and admission (7.1 percent). Encounters by patients from rural areas had the highest transfer rate (3.0 percent)—three times higher than the transfer rate for patients from large central metropolitan areas. |
| Table 1. Characteristics of emergency department encounters by disposition type, 20091 | |||
| Transferred from ED to another acute care hospital | Admitted to the hospital from the original ED | Treated and released from the ED | |
|---|---|---|---|
| Total number (% of all ED encounters) | 1,877,017 (1.5) | 19,592,546 (15.7) | 103,075,990 (82.8) |
| Patient's sex (%) | |||
| Male | 1.8 | 16.2 | 82.0 |
| Female | 1.3 | 15.4 | 83.3 |
| Patient's age (%) | |||
| <1 | 1.9 | 7.2 | 90.9 |
| 1-17 | 1.3 | 3.4 | 95.3 |
| 18-44 | 1.0 | 8.1 | 90.9 |
| 45-64 | 1.8 | 21.1 | 77.1 |
| 65-84 | 2.7 | 40.2 | 57.1 |
| 85+ | 2.7 | 45.6 | 51.7 |
| Primary insurance (%) | |||
| Medicare | 2.5 | 39.3 | 58.2 |
| Medicaid | 1.1 | 10.0 | 88.9 |
| Private | 1.5 | 11.2 | 87.3 |
| Uninsured | 0.8 | 7.1 | 92.1 |
| Other | 1.6 | 10.3 | 88.1 |
| Patient's residence (%): | |||
| Large central metropolitan | 1.0 | 18.4 | 80.6 |
| Large fringe metropolitan (suburbs) | 1.2 | 17.6 | 81.2 |
| Medium and small metropolitan | 1.2 | 14.4 | 84.4 |
| Micropolitan / noncore (rural) | 3.0 | 12.3 | 84.7 |
| 1Three percent of encounters were excluded from the tables in this study; they included encounters where patients died in the ED, left against medical advice, or were transferred to another nonacute care institution (nursing home, rehabilitation center, or home healthcare). Source: Agency for Healthcare Research and Quality (AHRQ), Center for Delivery, Organization, and Markets, Healthcare Cost and Utilization Project (HCUP), Nationwide Emergency Department Sample (NEDS), 2009. |
|||
Transfer rates varied significantly by condition. Table 2 lists the 25 most common first-listed diagnostic categories by total number of ED encounters and their associated rates of transfer (percentage of ED encounters within the diagnostic category that had a disposition of transfer to another acute care hospital). Only five of these diagnostic categories had transfer rates higher than the overall average transfer rate of 1.5 percent. These conditions— nonspecific chest pain (3.1 percent), other lower respiratory tract disease (2.3 percent), pneumonia (4.1 percent), fever of unknown origin (1.7 percent), and fracture of the upper limb (1.7 percent)—are highlighted in the table.
|
| Table 2. Most common first-listed diagnoses seen in the emergency department, 2009 | ||||
| Rank | Diagnostic category* | Encounters(n) | Encounters (% of n) |
Transfer rate (%) |
|---|---|---|---|---|
| 1 | Upper respiratory infections (other than tonsillitis and bronchitis) | 6,474,077 | 5.0 | 0.1 |
| 2 | Sprains and strains | 6,000,259 | 4.7 | 0.1 |
| 3 | Superficial injury, contusion | 5,854,225 | 4.5 | 0.3 |
| 4 | Abdominal pain | 4,982,788 | 3.9 | 1.2 |
| 5 | Nonspecific chest pain | 4,078,681 | 3.2 | 3.1 |
| 6 | Spondylosis, intervertebral disc disorders, other back problems | 3,473,163 | 2.7 | 0.4 |
| 7 | Skin and subcutaneous tissue infections | 3,215,750 | 2.4 | 0.8 |
| 8 | Open wounds of extremities | 3,132,265 | 2.4 | 0.7 |
| 9 | Other injuries and conditions due to external causes | 2,986,051 | 2.3 | 1.4 |
| 10 | Headache, including migraine | 2,956,124 | 2.3 | 0.4 |
| 11 | Urinary tract infections | 2,955,885 | 2.3 | 0.8 |
| 12 | Open wounds of head, neck, and trunk | 2,514,355 | 2.0 | 1.0 |
| 13 | Other lower respiratory disease** | 2,105,268 | 1.6 | 2.3 |
| 14 | Viral infections | 2,065,792 | 1.6 | 0.2 |
| 15 | Otitis media and related conditions | 2,050,648 | 1.6 | 0.1 |
| 16 | Connective tissue disease other than systemic lupus erythematosus | 2,007,883 | 1.6 | 0.0 |
| 17 | Asthma | 1,970,813 | 1.5 | 1.0 |
| 18 | Chronic obstructive pulmonary disease (COPD) and bronchiectasis | 1,970,786 | 1.5 | 1.5 |
| 19 | Disorders of teeth and jaw | 1,902,822 | 1.5 | 0.2 |
| 20 | Pneumonia | 1,861,301 | 1.4 | 4.1 |
| 21 | Fever of unknown origin | 1,832,415 | 1.4 | 1.7 |
| 22 | Fracture of upper limb | 1,813,213 | 1.4 | 1.7 |
| 23 | Acute bronchitis | 1,689,858 | 1.3 | 0.6 |
| 24 | Complications of pregnancy other than abortion or ectopic pregnancy | 1,686,450 | 1.3 | 0.8 |
| 25 | Nausea and vomiting | 1,666,884 | 1.3 | 0.9 |
| *Using AHRQ's Clinical Classifications Software (CCS). ** The vast majority of these cases involved nonspecific International Classification of Diseases, Ninth Revision, Clinical Modification (ICD-9-CM) codes for shortness of breath, respiratory abnormalities not elsewhere classified, cough, and painful respiration. Source: Agency for Healthcare Research and Quality (AHRQ), Center for Delivery, Organization, and Markets, Healthcare Cost and Utilization Project (HCUP), Nationwide Emergency Department Sample (NEDS), 2009. |
||||
Table 3 lists the 25 first-listed diagnostic categories with the highest transfer rates. All of the diagnostic categories listed in Table 3 had transfer rates that were higher than five percent. Most of the high-transfer conditions listed in Table 3 are time-sensitive, emergent conditions requiring higher levels of care such as stroke, cardiovascular, and neurosurgical emergencies. Mental illness constituted nearly 25 percent of the encounters among the diagnostic categories listed in Table 3. Although neonatal emergencies and delivery complications represented a smaller absolute number of encounters, they had high rates of transfer.
|
| Table 3. First-listed diagnoses with highest transfer rates from the ED | |||
| Rank | Diagnostic category* | Encounters (n) | Transfer rate (%) |
|---|---|---|---|
| 1 | Shock | 3,286 | 21.2 |
| 2 | Intrauterine hypoxia / birth asphyxia | 363 | 20.3 |
| 3 | Live born | 4,158 | 18.6 |
| 4 | Respiratory distress syndrome (of newborn) | 414 | 16.5 |
| 5 | Aortic, peripheral or visceral artery aneurysm | 38,612 | 16.5 |
| 6 | Suicide and intentional self injury | 100,039 | 14.9 |
| 7 | Paralysis | 12,383 | 14.9 |
| 8 | Acute myocardial infarction | 524,111 | 12.4 |
| 9 | Short gestation, low birth weight, and fetal growth retardation | 430 | 12.2 |
| Acute cerebrovascular disease | 579,417 | 12.1 | |
| 11 | Aortic or peripheral arterial embolism or thrombosis | 21,765 | 10.9 |
| 12 | Spinal cord injury | 14,600 | 10.5 |
| 13 | Coma, stupor, and brain damage | 96,910 | 10.0 |
| 14 | Coronary atherosclerosis and other heart disease | 525,783 | 9.7 |
| 15 | Femur neck fracture | 311,779 | 8.4 |
| 16 | Chronic renal failure | 62,188 | 8.3 |
| 17 | Neoplasm of unspecified nature or uncertain behavior | 32,727 | 6.6 |
| 18 | Hematologic conditions other than anemia, diseases of white blood cells, and coagulation and hemorrhagic disorders | 5,000 | 6.4 |
| 19 | Schizophrenia and other psychotic disorders | 588,393 | 6.3 |
| 20 | Poisoning by psychotropic agents | 176,259 | 6.1 |
| 21 | Digestive congenital anomalies | 13,228 | 6.1 |
| 22 | Conduction disorders | 51,530 | 6.0 |
| 23 | Personality disorders | 18,442 | 5.8 |
| 24 | Diseases of white blood cells | 62,016 | 5.5 |
| 25 | Intracranial injury | 674,953 | 5.5 |
| *Using AHRQ's Clinical Classifications Software (CCS). Source: Agency for Healthcare Research and Quality (AHRQ), Center for Delivery, Organization, and Markets, Healthcare Cost and Utilization Project (HCUP), Nationwide Emergency Department Sample (NEDS), 2009. | |||
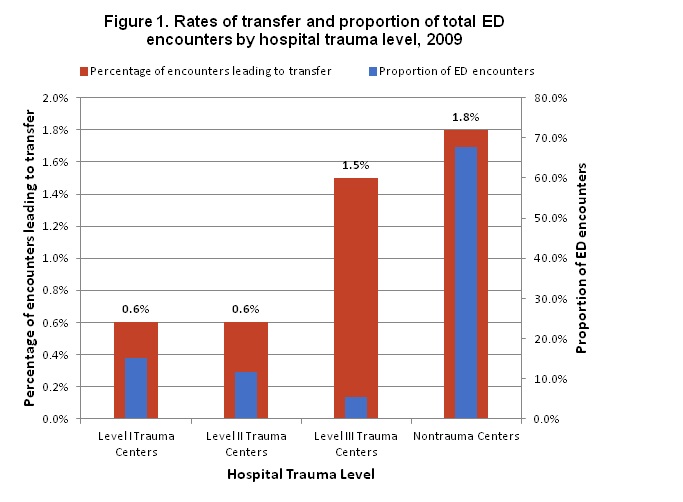
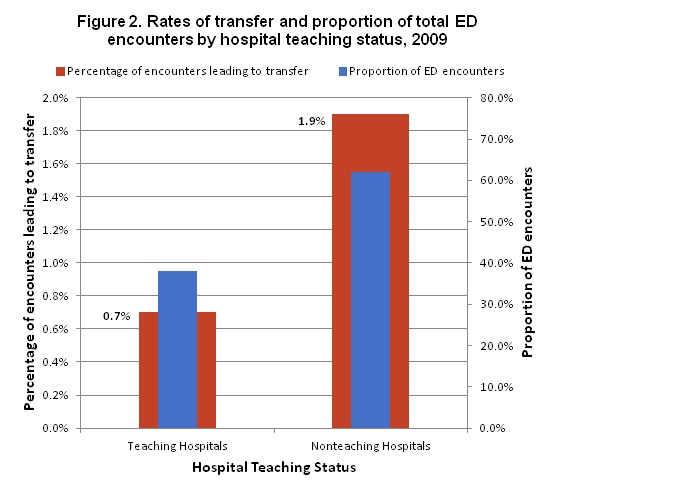
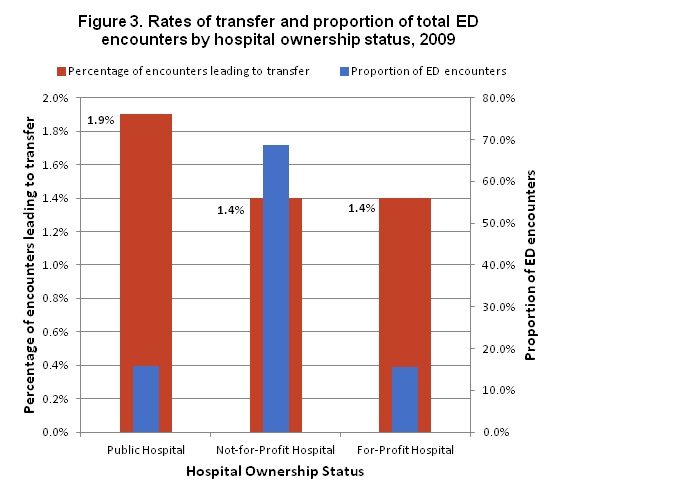
Hospital factors Hospital characteristics also appear to be associated with ED disposition decisions. The overall transfer rate across all hospitals was 1.5 percent, but some hospital categories had disproportionately higher rates of transfer. As can be seen in figures 1-3, nontrauma hospitals transferred 1.8 percent of encounters, nonteaching hospitals transferred 1.9 percent, and public hospitals transferred 1.9 percent. Rates of transfer also were higher in Level III compared to Level I and Level II trauma hospitals; Level I hospitals are capable of providing the highest level of care to trauma patients. This disparity in transfer rates is likely because nontrauma, nonteaching, and public hospitals have a lower concentration of resources including specialists and advanced diagnostic and therapeutic modalities. |
|
Figure 1. Rates of transfer and proportion of total ED encounters by hospital trauma level, 2009.This is a bar chart. The percentage of encounters leading to transfer are: Level 1 trauma centers, 6%; Level 2 trauma centers, 6%; Level 3 trauma centers, 1.5%; Nontrauma centers, 1.8%; The proportion of ED encounters are: Level 1 trauma centers, 15.1%; Level 2 trauma centers, 11.6%; Level 3 trauma enters, 5.5%; Nontrauma centers, 67.8%; Source: Agency for Healthcare Research and Quality, Center for Delivery, Organization, and Markets, Healthcare Cost and Utilization Project, Nationwide Emergency Department Sample, 2009.
|
|
Figure 2. Rates of transfer and proportion of total ED encounters by hospital teaching status, 2009. This is a bar chart. The percentage of encounters leading to transfer are: Teaching hospitals, 7%; Nonteaching hospitals, 1.9%; The proportion of ED encounters are: Teaching hospitals, 38%; Nonteaching hospitals, 62%; Source: Agency for Healthcare Research and Quality, Center for Delivery, Organization, and Markets, Healthcare Cost and Utilization Project, Nationwide Emergency Department Sample, 2009.
|
|
Figure 3. Rates of transfer and proportion of total ED encounters by hospital ownership status, 2009. This is a bar chart. The percentage of encounters leading to transfer are: Public hospital, 1.9%; Not-for-profit hospital, 1.4%; For-profit hospital, 1.4%; The proportion of ED encounters are: Public hospital, 15.7%; Not-for-profit hospital, 68.8%; For-profit hospital, 15.5%; Source: Agency for Healthcare Research and Quality, Center for Delivery, Organization, and Markets, Healthcare Cost and Utilization Project, Nationwide Emergency Department Sample, 2009.
|
Data Source
The estimates in this Statistical Brief are based upon data from the Healthcare Cost and Utilization Project (HCUP) 2009 Nationwide Emergency Department Sample (NEDS). Definitions Diagnoses, ICD-9-CM, and Clinical Classifications Software (CCS) On inpatient records, the principal diagnosis is that condition established after study to be chiefly responsible for the patient's admission to the hospital. On outpatient ED records, the first-listed diagnosis is the "code for the diagnosis, condition, problem or other reason for encounter/visit shown in the medical record to be chiefly responsible for the services provided."6 This analysis uses the principal diagnosis on inpatient records and the first-listed diagnosis on outpatient ED records. ICD-9-CM is the International Classification of Diseases, Ninth Revision, Clinical Modification, which assigns numeric codes to diagnoses. There are approximately 14,000 ICD-9-CM diagnosis codes. CCS categorizes ICD-9-CM diagnoses into a manageable number of clinically meaningful categories.7 This "clinical grouper" makes it easier to quickly understand patterns of diagnoses. CCS categories identified as "Other" typically are not reported; these categories include miscellaneous, otherwise unclassifiable diagnoses that may be difficult to interpret as a group. Types of hospitals included in HCUP HCUP is based on data from community hospitals, defined as short-term, non-Federal, general, and other hospitals, excluding hospital units of other institutions (e.g., prisons). HCUP data include obstetrics and gynecology, otolaryngology, orthopedic, cancer, pediatric, public, and academic medical hospitals. Excluded are long-term care, rehabilitation, psychiatric, and alcoholism and chemical dependency hospitals. Community hospitals included in the NEDS have hospital-based emergency departments and no more than 90 percent of their ED visits resulting in admission. Unit of analysis The unit of analysis is the hospital discharge (i.e., the hospital stay), not a person or patient. This means that a person who is admitted to the hospital multiple times in one year will be counted each time as a separate "discharge" from the hospital. Location of patients' residence Place of residence is based on the urban-rural classification scheme for U.S. counties developed by the National Center for Health Statistics (NCHS):
Payer Payer is the expected primary payer for the hospital stay. To make coding uniform across all HCUP data sources, payer combines detailed categories into more general groups:
About HCUP HCUP is a family of powerful healthcare databases, software tools, and products for advancing research. Sponsored by the Agency for Healthcare Research and Quality (AHRQ), HCUP includes the largest all-payer encounter-level collection of longitudinal healthcare data (inpatient, ambulatory surgery, and emergency department) in the United States, beginning in 1988. HCUP is a Federal-State-Industry Partnership that brings together the data collection efforts of many organizations—such as State data organizations, hospital associations, private data organizations, and the Federal government—to create a national information resource. HCUP would not be possible without the contributions of the following data collection Partners from across the United States: Alaska State Hospital and Nursing Home Association Arizona Department of Health Services Arkansas Department of Health California Office of Statewide Health Planning and Development Colorado Hospital Association Connecticut Hospital Association Florida Agency for Health Care Administration Georgia Hospital Association Hawaii Health Information Corporation Illinois Department of Public Health Indiana Hospital Association Iowa Hospital Association Kansas Hospital Association Kentucky Cabinet for Health and Family Services Louisiana Department of Health and Hospitals Maine Health Data Organization Maryland Health Services Cost Review Commission Massachusetts Center for Health Information and Analysis Michigan Health & Hospital Association Minnesota Hospital Association Mississippi Department of Health Missouri Hospital Industry Data Institute Montana MHA - An Association of Montana Health Care Providers Nebraska Hospital Association Nevada Department of Health and Human Services New Hampshire Department of Health & Human Services New Jersey Department of Health New Mexico Department of Health New York State Department of Health North Carolina Department of Health and Human Services North Dakota (data provided by the Minnesota Hospital Association) Ohio Hospital Association Oklahoma State Department of Health Oregon Association of Hospitals and Health Systems Oregon Health Policy and Research Pennsylvania Health Care Cost Containment Council Rhode Island Department of Health South Carolina Budget & Control Board South Dakota Association of Healthcare Organizations Tennessee Hospital Association Texas Department of State Health Services Utah Department of Health Vermont Association of Hospitals and Health Systems Virginia Health Information Washington State Department of Health West Virginia Health Care Authority Wisconsin Department of Health Services Wyoming Hospital Association About the NEDS The HCUP Nationwide Emergency Department Database (NEDS) is a unique and powerful database that yields national estimates of emergency department (ED) visits. The NEDS was constructed using records from both the HCUP State Emergency Department Databases (SEDD) and the State Inpatient Databases (SID). The SEDD capture information on ED visits that do not result in an admission (i.e., treat-and-release visits and transfers to another hospital); the SID contain information on patients initially seen in the emergency room and then admitted to the same hospital. The NEDS was created to enable analyses of ED utilization patterns and support public health professionals, administrators, policymakers, and clinicians in their decision making regarding this critical source of care. The NEDS is produced annually beginning in 2006. For More Information For more information about HCUP, visit http://www.hcup-us.ahrq.gov/. For additional HCUP statistics, visit HCUPnet, our interactive query system, at https://datatools.ahrq.gov/hcupnet. For information on other hospitalizations in the United States, download HCUP Facts and Figures: Statistics on Hospital-Based Care in the United States in 2009, located at http://www.hcup-us.ahrq.gov/reports.jsp. For a detailed description of HCUP, more information on the design of the NEDS, and methods to calculate estimates, please refer to the following publications: Introduction to the HCUP Nationwide Emergency Department Sample, 2010. Online. November 2012. U.S. Agency for Healthcare Research and Quality. http://hcup-us.ahrq.gov/db/nation/neds/NEDS2010Introductionv3.pdf. Accessed March 13, 2013. Houchens R, Elixhauser A. Final Report on Calculating Nationwide Inpatient Sample (NIS) Variances, 2001. HCUP Methods Series Report #2003-2. Online. June 2005 (revised June 6, 2005). U.S. Agency for Healthcare Research and Quality. http://www.hcup-us.ahrq.gov/reports/methods/2003_02.pdf. Accessed March 13, 2013. Suggested Citation Kindermann D (George Washington University), Mutter R (AHRQ), Pines JM (George Washington University). Emergency Department Transfers to Acute Care Facilities, 2009. HCUP Statistical Brief #155. April 2013. Agency for Healthcare Research and Quality, Rockville, MD. http://www.hcup-us.ahrq.gov/reports/statbriefs/sb155.pdf. *** AHRQ welcomes questions and comments from readers of this publication who are interested in obtaining more information about access, cost, use, financing, and quality of healthcare in the United States. We also invite you to tell us how you are using this Statistical Brief and other HCUP data and tools, and to share suggestions on how HCUP products might be enhanced to further meet your needs. Please e-mail us at hcup@ahrq.gov or send a letter to the address below:Irene Fraser, Ph.D., Director Center for Delivery, Organization, and Markets Agency for Healthcare Research and Quality 540 Gaither Road Rockville, MD 20850 1 Bitterman RA. Consolidated Omnibus Budget Reconciliation Act of 1985 (COBRA). PL 99-272. Title IX, Section 9121, 100 Stat 167 (1986). 2 American College of Chest Physicians. Providing Emergency Care Under Federal Law: EMTALA. Dallas: American College of Emergency Physicians; 2001. 3 One recent study found that only 53% of hospitals admitted pediatric patients, only 25% of EDs had access 24 hours and 7 days a week to a board certified pediatric emergency medicine attending physician, and only 6% had all recommended pediatric emergency supplies. See Middleton KR, Burt CW. Availability of pediatric services and equipment in emergency departments: United States, 2002-2003. Adv Data. 2006 Feb 28;(367):1-16. 4 A survey of neurosurgeons showed decreasing trauma call coverage because of higher medico-legal risk, conflict with elective practice, time requirements, and perceived inadequate compensation. See Cohn SM, Price MA, Stewart RM, et al. A crisis in the delivery of care to patients with brain injuries in South Texas. J Trauma. 2007 Apr; 62(4):962-3. 5 Esposito TJ, Reed RL 2nd, Gamelli RL, et al. Neurosurgical coverage: essential, desired, or irrelevant for good patient care and trauma center status. Ann Surg. 2005 Sep;242(3):364-70; discussion 370-4. 6 Centers for Disease Control and Prevention. ICD-9-CM Official Guidelines for Coding and Reporting. These guidelines were created on 08/05/2010 and are effective as of 10/01/2010. http://www.cdc.gov/nchs/icd/icd9cm_addenda_guidelines.htm#guidelines. Accessed April 20, 2013. 7 HCUP Clinical Classifications Software (CCS). Healthcare Cost and Utilization Project (HCUP). U.S. Agency for Healthcare Research and Quality, Rockville, MD. Updated March 2013. http://www.hcup-us.ahrq.gov/toolssoftware/ccs/ccs.jsp. Accessed April 20, 2013. |