STATISTICAL BRIEF #15
|
|
October 2006
C. Allison Russo, M.P.H., Mirjana Milenkovic, M.A., and Claudia Steiner, M.D., M.P.H.
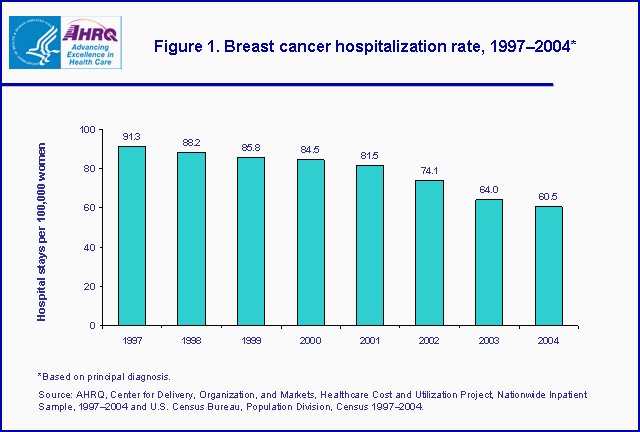
Introduction Breast cancer is second only to lung cancer as the leading cause of cancer-related deaths in women.1 In the United States, more women are diagnosed with breast cancer than any other type of non-skin cancer. Approximately one in eight women will be diag-nosed with invasive breast cancer during her lifetime, and women have a one in 33 chance of death from this disease. Currently, there are slightly over two million women living with breast cancer in the United States.2 This Statistical Brief presents data from the Healthcare Cost and Utilization Project (HCUP) on the treatment of breast cancer in U.S. hospitals during 2004. The utilization and costs of hospitalizations for breast cancer among women are compared with hospital stays for all non-obstetric conditions among women.3 Additionally, age, payer, and regional differences among these hospital stays are evaluated. Finally, commonly performed procedures used to treat breast cancer, and changes in the inpatient use of these proce-dures, are examined. All differences between estimates noted in the text are statistically significant at the 0.05 level or better. Findings In 2004, American women experienced more than 90,000 hospital stays for breast cancera 28 percent decrease from 1997, when there were approximately 125,100 hospital stays for this disease. When adjusted for population changes, the reduction in the hospi-talization rate per 100,000 women was even more significanta 34 percent decrease (figure 1). In 2004, these hospital stays totaled more than $605 million in hospital costs (table 1). General characteristics of hospital stays for breast cancer Table 1 presents utilization and cost information for the treatment of breast cancer in U.S. community hospitals compared with the treatment of all non-obstetrical conditions. The mean length of stay for the treatment of breast cancer was nearly half the average stay for all non-obstetric conditions combined (2.7 days versus 4.9 days). With an average age of 61 years, women hospitalized for breast cancer were nearly nine years older than those hospitalized for all non-obstetric conditions. Although the hospital stays for breast cancer were much less likely to originate in the emergency department (5.6 percent versus 48.0 percent), they were just as likely to result in death (about 2.2 percent). The average cost for breast cancer hospitalizations was $6,900–about 12 percent less than the mean cost for all non-obstetrical hospital stays. However, because the average hospital stay for breast cancer was more than two days shorter, these stays resulted in a mean hospital cost per day that was $1,000 higher than the mean cost per day for all non-obstetric stays ($2,600 versus $1,600). |
|
Differences in hospital stays for breast cancer, by age and payer
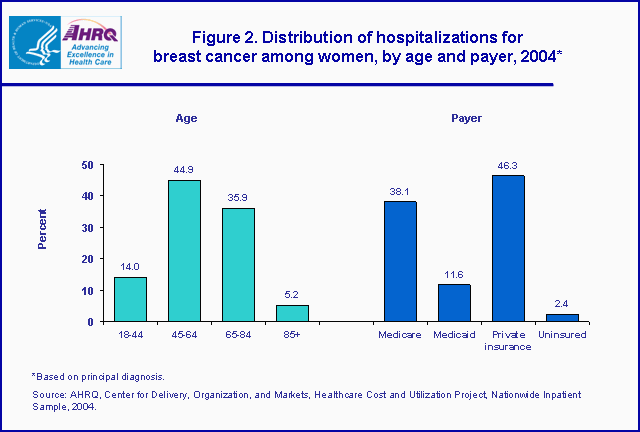
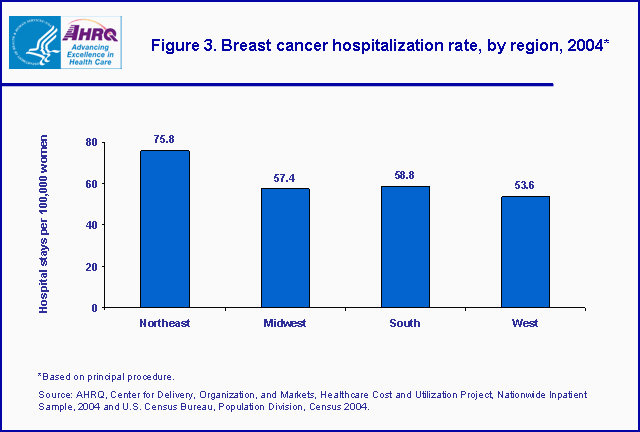
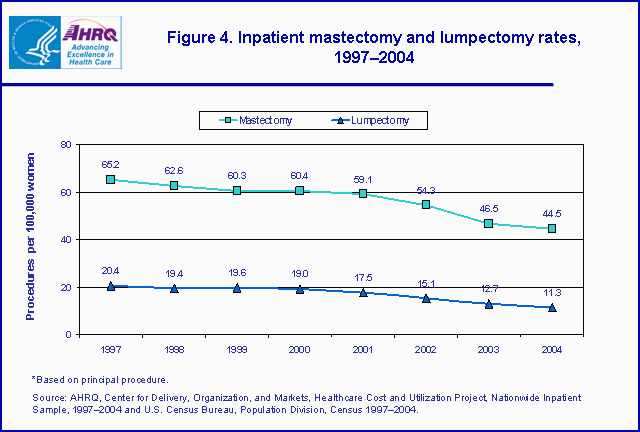
The majority of women hospitalized for breast cancer were between 45 and 64 years of age, followed closely by women ages 65 to 84 (figure 2). Together, these groups comprised 81 percent of admissions for breast cancer in 2004. In contrast, younger women (ages 18 to 44) and the very elderly (ages 85 and older) accounted for less than 20 percent of breast cancer hospitalizations. Figure 2 also illustrates the payer distribution for breast cancer hospitalizations. Private insurance was billed for more breast cancer hospital stays than any other payer group (46.3 percent), followed closely by Medicare (38.1 percent). This finding coincides with the age distribution, reflecting the most common sources of payment for women ages 45 to 64 and those ages 65 to 84. Medicaid, which covers a large number of women of childbearing age, was billed for 11.6 percent of hospital stays for breast cancer, while uninsured women accounted for 2.4 percent of breast cancer hospitalizations. Differences in hospital stays for breast cancer, by region When adjusted for the female population in each region, breast cancer hospitalizations were most likely to occur in the Northeast, at a rate of 75.8 admissions per 100,000 women (figure 3). The breast cancer hospitalization rates in the South and Midwest were about the same–58.8 and 57.4 hospital stays per 100,000 women, respectively. The lowest rate of hospitalization for breast cancer was in the West, where 53.6 hospitalizations per 100,000 women occurred in 2004. Procedures commonly associated with hospital stays for breast cancer Table 2 lists the procedures commonly associated with hospital stays for breast cancer. The two most frequent principal procedures were mastectomies and lumpectomies, representing more than 75,000 procedures combined. A mastectomy is the surgical removal of the entire breast and some of the lymph nodes under the arm, and is generally performed on women facing more advanced cases of breast cancer. If a cancer is diagnosed early, surgeons attempt to preserve most of the breast tissue by performing a lumpectomy, where only the tumor and some surrounding tissue are removed. Both of these surgeries are generally followed by radiation and chemotherapy; however, in the case of lumpectomies, where a tumor is removed in an early stage, chemotherapy may not always be necessary. In 2004, mastectomies accounted for 69.8 percent of the principal procedures performed during hospital stays for breast cancer, while lumpectomies were performed in 13.8 percent of these stays. As the hospitalization rate for breast cancer decreased by 34 percent between 1997 and 2004, the use of these two procedures during inpatient hospitalizations also declined. When adjusted for the changes in the female population, the rate of mastectomies performed during an inpatient hospital stay decreased by 32 percent, and the inpatient lumpectomy rate declined by 45 percent (figure 4). The reduction in the number of mastectomies and lumpectomies performed in the inpatient hospital setting can be attributed in part to the increasing use of outpatient facilities for all breast cancer surgeries and the shift toward breast-conserving surgeries, such as lumpectomies. The majority of lumpectomies and an increasing number of mastectomies are now performed in an outpatient setting, primarily because of advances in the early diagnosis of breast cancer and new surgical technologies.4 Data Source The estimates in this Statistical Brief are based on data from the HCUP 2004 Nationwide Inpatient Sample (NIS). Historical data were drawn from the 1997, 1998, 1999, 2000, 2001, 2002, and 2003 NIS. Supplemental sources included data on age group population estimates from Table 2: Annual Estimates of the Population by Selected Age Groups and Sex for the United States: April 1, 2000 to July 1, 2005 (NST-EST2005-02) and the archives from the Population Division, U.S. Census Bureau (http://www.census.gov/popest/). Definitions Types of hospitals included in HCUP HCUP is based on data from community hospitals, defined as short-term, non-Federal, general and other hospitals, excluding hospital units of other institutions (e.g., prisons). HCUP data include OB-GYN, ENT, orthopedic, cancer, pediatric, public, and academic medical hospitals. They exclude long-term care, rehabilitation, psychiatric, and alcoholism and chemical dependency hospitals, but these types of discharges are included if they are from community hospitals. Unit of analysis The unit of analysis is the hospital discharge (i.e., the hospital stay), not a person or patient. This means that a person who is admitted to the hospital multiple times in one year will be counted each time as a separate "discharge" from the hospital. Region Region is one of the four regions defined by the U.S. Census Bureau: – Northeast: Maine, New Hampshire, Vermont, Massachusetts, Rhode Island, Connecticut, New York, New Jersey, and Pennsylvania – Midwest: Ohio, Indiana, Illinois, Michigan, Wisconsin, Minnesota, Iowa, Missouri, North Dakota, South Dakota, Nebraska, and Kansas – South: Delaware, Maryland, District of Columbia, Virginia, West Virginia, North Carolina, South Carolina, Georgia, Florida, Kentucky, Tennessee, Alabama, Mississippi, Arkansas, Louisiana, Oklahoma, and Texas – West: Montana, Idaho, Wyoming, Colorado, New Mexico, Arizona, Utah, Nevada, Washington, Oregon, California, Alaska, and Hawaii Costs and charges Total hospital charges were converted to costs using cost-to-charge ratios based on hospital accounting reports from the Centers for Medicare and Medicaid Services (CMS).5 Costs will tend to reflect the actual costs of production, while charges represent what the hospital billed for the case. For each hospital, a hospital-wide cost-to-charge ratio is used because detailed charges are not available across all HCUP States. Hospital charges reflect the amount the hospital charged for the entire hospital stay and does not include professional (physician) fees. For the purposes of this Statistical Brief, costs are reported to the nearest hundreds. Payer Up to two payers can be coded for a hospital stay in HCUP data. When this occurs, the following hierarchy is used: – If either payer is listed as Medicaid, the payer is "Medicaid." – For non-Medicaid stays, if either payer is listed as Medicare, the payer is "Medicare." – For stays that are neither Medicaid nor Medicare, if either payer is listed as private insurance, the payer is "private insurance." – For stays that are not Medicaid, Medicare or private insurance, if either payer is some other third-party payer, the payer is "other," which consists of Worker’s Compensation, TRICARE/CHAMPUS, CHAMPVA, Title V, and other government programs. – For stays that have no third-party payer and the payer is listed as "self-pay" or "no charge," the payer is "uninsured." Principal diagnosis, ICD-9-CM, and Clinical Classifications Software (CCS) The principal diagnosis is that condition established after study to be chiefly responsible for the patient’s admission to the hospital. ICD-9-CM is the International Classification of Diseases, Ninth Revision, Clinical Modification, which assigns numeric codes to diagnoses. There are about 12,000 ICD-9-CM diagnosis codes. CCS categorizes ICD-9-CM diagnoses into 260 clinically meaningful categories.6 This "clinical grouper" makes it easier to quickly understand patterns of diagnoses and procedures. The ICD-9-CM diagnosis codes included in the CCS category 24 (Cancer of breast) are – 174.0 Malignant neoplasm of female breast (nipple and areola) – 174.1 Malignant neoplasm of female breast (central portion) – 174.2 Malignant neoplasm of female breast (upper-inner quadrant) – 174.3 Malignant neoplasm of female breast (lower-inner quadrant) – 174.4 Malignant neoplasm of female breast (upper-outer quadrant) – 174.5 Malignant neoplasm of female breast (lower-outer quadrant) – 174.6 Malignant neoplasm of female breast (axillary tail) – 174.8 Malignant neoplasm of female breast (other specified sites of female breast) – 174.9 Malignant neoplasm of female breast (breast, female, unspecified) – 175.0 Malignant neoplasm of male breast (nipple and areola) – 175.9 Malignant neoplasm of male breast (other and unspecified sites of male breast) – 233.0 Carcinoma in situ of breast – V10.3 Personal history of malignant neoplasm, breast Principal procedure, ICD-9-CM, and Clinical Classifications Software (CCS) The principal procedure is the procedure that was performed for definitive treatment rather than one performed for diagnostic or exploratory purposes (i.e., the procedure that was necessary to take care of a complication). If two procedures appear to meet this definition, the procedure most related to the principal diagnosis was selected as the principal procedure. CCS categorizes ICD-9-CM procedure codes into clinically meaningful categories. This "clinical grouper" makes it easier to quickly understand patterns of procedure use. The ICD-9-CM procedure codes included in the CCS procedure category 166 (Lumpectomy, quadrantectomy of breast) are – 85.20 Excision or destruction of breast tissue, not otherwise specified – 85.21 Local excision of lesion of breast – 85.22 Resection of quadrant of breast – 85.23 Excision of nipple The ICD-9-CM procedure codes included in the CCS procedure category 167 (Mastectomy) are – 85.41 Unilateral simple mastectomy – 85.42 Bilateral simple mastectomy – 85.43 Unilateral extended simple mastectomy – 85.44 Bilateral extended simple mastectomy – 85.45 Unilateral radical mastectomy – 85.46 Bilateral radical mastectomy – 85.47 Unilateral extended radical mastectomy – 85.48 Bilateral extended radical mastectomy Emergency admission source Emergency admission indicates the patient was admitted to the hospital through the emergency department. About the NIS The HCUP Nationwide Inpatient Sample (NIS) is a nationwide database of hospital inpatient stays. The NIS is nationally representative of all community hospitals (i.e., short-term, non-Federal, non-rehabilitation hospitals). The NIS is a sample of hospitals and includes all patients from each hospital, regardless of payer. It is drawn from a sampling frame that contains hospitals comprising about 90 percent of all discharges in the United States. The vast size of the NIS allows the study of topics at both the national and regional levels for specific subgroups of patients. In addition, NIS data are standardized across years to facilitate ease of use. About HCUP HCUP is a family of powerful healthcare databases, software tools, and products for advancing research. Sponsored by the Agency for Healthcare Research and Quality (AHRQ), HCUP includes the largest all-payer encounter-level collection of longitudinal healthcare data (inpatient, ambulatory surgery, and emergency department) in the United States, beginning in 1988. HCUP is a Federal-State-Industry Partnership that brings together the data collection efforts of many organizations–such as State data organizations, hospital associations, private data organizations, and the Federal government–to create a national information resource. For more information about HCUP, visit http://www.hcup-us.ahrq.gov/. HCUP would not be possible without the contributions of the following data collection Partners from across the United States: Arizona Department of Health Services Arkansas Department of Health & Human Services California Office of Statewide Health Planning & Development Colorado Health & Hospital Association Connecticut Integrated Health Information (Chime, Inc.) Florida Agency for Health Care Administration Georgia GHA: An Association of Hospitals & Health Systems Hawaii Health Information Corporation Illinois Health Care Cost Containment Council and Department of Public Health Indiana Hospital&Health Association Iowa Hospital Association Kansas Hospital Association Kentucky Cabinet for Health and Family Services Maryland Health Services Cost Review Commission Massachusetts Division of Health Care Finance and Policy Michigan Health & Hospital Association Minnesota Hospital Association Missouri Hospital Industry Data Institute Nebraska Hospital Association Nevada Division of Health Care Financing and Policy, Department of Human Resources New Hampshire Department of Health & Human Services New Jersey Department of Health and Senior Services New York State Department of Health North Carolina Department of Health and Human Services Ohio Hospital Association Oregon Office for Oregon Health Policy and Research and Oregon Association of Hospitals and Health Systems Rhode Island Department of Health South Carolina State Budget and Control Board South Dakota Association of Healthcare Organizations Tennessee Hospital Association Texas Department of State Health Services Utah Department of Health Vermont Association of Hospitals and Health Systems Virginia Health Information Washington State Department of Health West Virginia Health Care Authority Wisconsin Department of Health and Family Services For additional HCUP statistics, visit HCUPnet, our interactive query system at https://datatools.ahrq.gov/hcupnet. References For a detailed description of HCUP and more information on the design of the NIS and methods to calculate estimates, please refer to the following publications: Steiner, C., Elixhauser, A., Schnaier, J. The Healthcare Cost and Utilization Project: An Overview. Effective Clinical Practice 5(3):143–51, 2002. Design of the HCUP Nationwide Inpatient Sample, 2004. Online. August 8, 2006. U.S. Agency for Healthcare Research and Quality. http://www.hcup-us.ahrq.gov/db/nation/nis/reports/NIS_2004_Design_Report.pdf Houchens, R., Elixhauser, A. Final Report on Calculating Nationwide Inpatient Sample (NIS) Variances, 2001. HCUP Methods Series Report #2003-2. Online. June 2005 (revised June 6, 2005). U.S. Agency for Healthcare Research and Quality. http://www.hcup-us.ahrq.gov/reports/methods/2003_02.pdf Houchens, R., Elixhauser, A. Using the HCUP Nationwide Inpatient Sample to Estimate Trends. (Updated for 1988–2004). HCUP Methods Series Report #2006-05 Online. August 18, 2006. U.S. Agency for Healthcare Research and Quality. http://www.hcup-us.ahrq.gov/reports/methods/2006_05_NISTrendsReport_1988-2004.pdf Suggested Citation Russo, C.A., Milenkovic, M., and Steiner, C. Hospital Stays for Breast Cancer, 2004. HCUP Statistical Brief #15. October 2006. Agency for Healthcare Research and Quality, Rockville, MD. http://www.hcup-us.ahrq.gov/reports/statbriefs/sb15.pdf. *** AHRQ welcomes questions and comments from readers of this publication who are interested in obtaining more information about access, cost, use, financing, and quality of healthcare in the United States. We also invite you to tell us how you are using this Statistical Brief and other HCUP data and tools, and to share suggestions on how HCUP products might be enhanced to further meet your needs. Please e-mail us at hcup@ahrq.gov or send a letter to the address below:Irene Fraser, Ph.D., Director Center for Delivery, Organization, and Markets Agency for Healthcare Research and Quality 540 Gaither Road Rockville, MD 20850 1National Cancer Institute. A Snapshot of Breast Cancer. August 2005. Web link has been changed. Information updated November 2014:http://www.cancer.gov/research/progress/snapshots/breast (accessed September 24, 2015) 2Ries LAG, Harkins D, Krapcho M, Mariotto A, Miller BA, Feuer EJ, Clegg L, Eisner MP, Horner MJ, Howlader N, Hayat M, Hankey BF, Edwards BK (eds). SEER Cancer Statistics Review, 1975–2003, National Cancer Institute. Bethesda, MD. http://seer.cancer.gov/csr/1975_2003/ (Accessed September 13, 2006) 3Each year, a small number of hospital stays for breast cancer (less than 700) occur among men. These hospitalizations represent less than 1 percent of the total number of stays for breast cancer. Consequently, this Statistical Brief focuses only on the hospital treatment of breast cancer among women. 4Russo, C.A., VanLandeghem, K., Davis, P.H., Elixhauser, A. Hospital and Ambulatory Surgery Care for Women’s Cancers. HCUP Highlight #2. Rockville, MD: Department of Health and Human Services, Agency for Healthcare Research and Quality. September 2006. AHRQ Pub. No. 06-0038. 5HCUP Cost-to-Charge Ratio Files (CCR). Healthcare Cost and Utilization Project (HCUP). 2001�2003. U.S. Agency for Healthcare Research and Quality, Rockville, MD. http://www.hcup-us.ahrq.gov/db/state/costtocharge.jsp. 6HCUP CCS. Healthcare Cost and Utilization Project (HCUP). August 2006. U.S. Agency for Healthcare Research and Quality, Rockville, MD. http://www.hcup-us.ahrq.gov/toolssoftware/ccs/ccs.jsp. |
| Table 1. Hospital stays for breast cancer among women compared to hospital stays for all non-obstetrical (OB) conditions among women, 2004* | ||||||||
| Hospital stays for breast cancer* | All non-OB hospital stays | |||||||
| Total number of hospitalizations | 90,200 | 17,994,300 | ||||||
| Mean length of stay, days | 2.7 | 4.9 | ||||||
| Mean age, years | 61.0 | 52.1 | ||||||
| Mean cost per hospitalization | $6,900 | $7,800 | ||||||
| Mean hospital cost per day | $2,600 | $1,600 | ||||||
| Aggregate costs for U.S. | $605 million | $137 billion | ||||||
| Percentage admitted through the emergency department | 5.6% | 48.0% | ||||||
| Percentage died in hospital | 2.2% | 2.3% | ||||||
| *Based on principal diagnosis. Source: AHRQ, Center for Delivery, Organization, and Markets, Healthcare Cost and Utilization Project, Nationwide Inpatient Sample, 2004. | ||||||||
| Table 2. Procedures commonly associated with hospital stays for breast cancer, 2004* | |||
| Principal procedure | Number of hospital stays with this procedure | Percentage of hospital stays with this procedure | |
| Mastectomy | 63,000 | 69.8% | |
| Lumpectomy, quadrantectomy of breast | 12,400 | 13.8% | |
| Other OR therapeutic procedures on skin and breast | 3,900 | 4.3% | |
| Breast biopsy and other diagnostic procedures on breast | 1,600 | 1.8% | |
| Other therapeutic procedures, hemic and lymphatic system | 1,000 | 1.1% | |
| *Based on principal diagnosis. Source: AHRQ, Center for Delivery, Organization, and Markets, Healthcare Cost and Utilization Project, Nationwide Inpatient Sample, 2004. | |||
|
| Internet Citation: Statistical Brief #15. Healthcare Cost and Utilization Project (HCUP). October 2006. Agency for Healthcare Research and Quality, Rockville, MD. hcup-us.ahrq.gov/reports/statbriefs/sb15.jsp. |
| Are you having problems viewing or printing pages on this website? |
| If you have comments, suggestions, and/or questions, please contact hcup@ahrq.gov. |
| If you are experiencing issues related to Section 508 accessibility of information on this website, please contact hcup@ahrq.gov. |
| Privacy Notice, Viewers & Players |
| Last modified 10/30/06 |