STATISTICAL BRIEF #146 |
January 2013
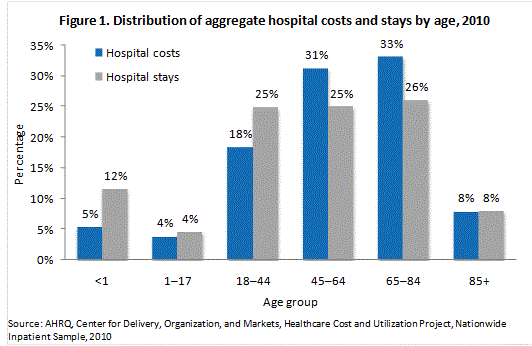
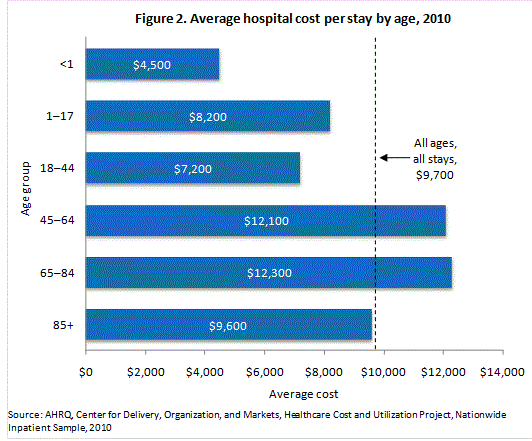
Anne Pfuntner, Lauren M. Wier, M.P.H., and Claudia Steiner, M.D., M.P.H. Introduction Inpatient hospital services account for a small share of healthcare utilization (7 percent) but constitute the largest share of total healthcare spending in the United States (29 percent in 2009).1 As healthcare costs continue to rise and the population ages, policymakers are increasingly concerned about the growing burden of hospital-based medical care expenses on the government, insurers, patients, and employers. This Statistical Brief presents data from the Healthcare Cost and Utilization Project (HCUP) on costs of hospital stays in the United States in 2010. Both aggregate hospital costs and the average costs per hospital stay are presented, by age and primary payer. The most costly inpatient conditions are identified, and the cost difference and components of growth in hospital costs are provided for these conditions between 1997 and 2010. All differences between estimates noted in the text are statistically significant at the .001 level or better. Findings Hospital costs by age, 2010 In 2010, the average cost per hospital stay was $9,700 and the aggregate cost for all hospital stays totaled $375.9 billion. Figures 1 and 2 show the distribution of aggregate hospital costs and stays by age and the average hospital cost per stay by age, respectively. Adults ages 45-64 and 65-84 had the highest average cost per stay ($12,100 and $12,300, respectively). These 2 age groups accounted for nearly two-thirds of aggregate hospital costs and about half of hospital stays. Adults age 85 and older accounted for 8 percent of aggregate costs and hospital stays, and had an average hospital cost that was similar to the overall average cost per stay. Infants (children younger than 1 year) accounted for 5 percent of aggregate costs and 12 percent of hospitalizations. Infants also had the lowest average cost per stay ($4,500), which was less than half the overall average cost per stay. |
|
|
Figure 1. Distribution of aggregate hospital costs and stays by age, 2010. Column bar chart; Age less than one year, Hospital costs, 5%; Hospital stays, 12%, Ages 1 through 17, Hospital costs, 4%; Hospital stays, 4%, Ages 18 through 44, Hospital costs, 18%; Hospital stays, 25%, Ages 45 through 64, Hospital costs, 31%; Hospital stays, 25%, Ages 65 through 84, Hospital costs, 33%; Hospital stays, 26%, Age 85 and older, Hospital costs, 8%; Hospital stays, 8%. Source: AHRQ, Center for Delivery, Organization, and Markets, Healthcare Cost and Utilization Project, Nationwide Inpatient Sample, 2010.
|
|
Figure 2. Average hospital cost per stay by age, 2010. Bar chart; Average cost for all ages, all stays, $9,700, Average cost per stay for age less than one year old, $4,500, Average cost per stay for ages 1 through 17, $8,200, Average cost per stay for ages 18 through 44, $7,200, Average cost per stay for ages 45 through 64, $12,100, Average cost per stay for ages 65 through 84, $12,300, Average cost per stay for age 85 and older, $9,600. Source: AHRQ, Center for Delivery, Organization, and Markets, Healthcare Cost and Utilization Project, Nationwide Inpatient Sample, 2010.
|
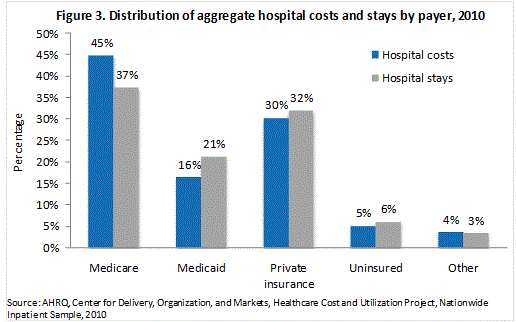
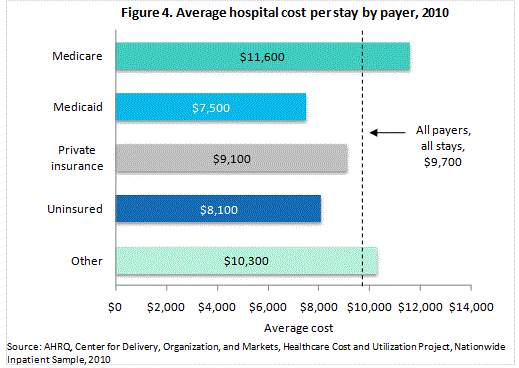
Hospital costs by expected primary payer, 2010 The distribution of aggregate hospital costs and stays by payer and the average hospital cost per stay by payer are shown in figures 3 and 4, respectively. Medicare and Medicaid accounted for 61 percent of aggregate hospital costs in 2010. Medicare was responsible for 45 percent of all costs and 37 percent of stays. Medicare also had the highest average cost per stay ($11,600). Medicaid accounted for 16 percent of aggregate hospital costs and 21 percent of hospital stays. The average cost per stay billed to Medicaid ($7,500) was lower than the overall average cost per stay ($9,700). Private insurance accounted for nearly one-third of aggregate costs and hospital stays, and the average cost per stay was similar to that for all stays. |
|
Figure 3. Distribution of aggregate hospital costs and stays by payer, 2010. Column bar chart; Medicare, Hospital costs, 45%; Hospital stays, 37%, Medicaid, Hospital costs, 16%; Hospital stays, 21%, Private insurance, Hospital costs, 30%; Hospital stays, 32%, Uninsured, Hospital costs, 5%; Hospital stays, 6%, Other, Hospital costs, 4%; Hospital stays, 3%. Source: AHRQ, Center for Delivery, Organization, and Markets, Healthcare Cost and Utilization Project, Nationwide Inpatient Sample, 2010.
|
|
Figure 4. Average hospital cost per stay by payer, 2010. Bar chart; Average cost per stay for all payers, all stays, $9,700, Average cost per stay with Medicare, $11,600, Average cost per stay with Medicaid, $7,500, Average cost per stay with private insurance, $9,100, Average cost per stay while uninsured, $8,100, Average cost per stay with other, $10,300. Source: AHRQ, Center for Delivery, Organization, and Markets, Healthcare Cost and Utilization Project, Nationwide Inpatient Sample, 2010.
|
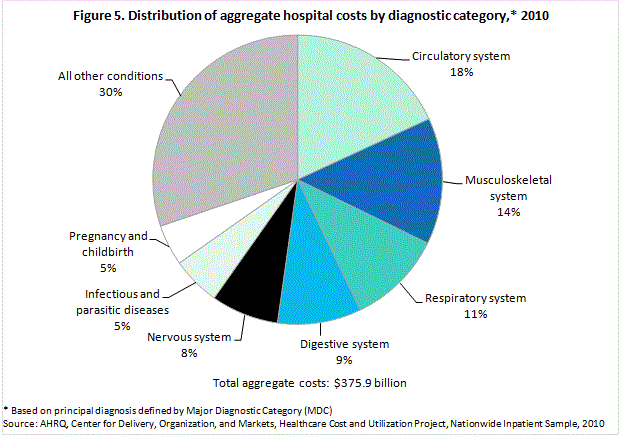
Hospital costs by diagnostic category, 2010 In 2010, 70 percent of aggregate hospital costs were attributable to 7 Major Diagnostic Categories (figure 5). Circulatory conditions accounted for the largest share—nearly one-fifth—of hospital costs. Other diagnostic categories that accounted for high shares of aggregate hospital costs included musculoskeletal conditions (14 percent), respiratory conditions (11 percent), digestive conditions (9 percent), and nervous system conditions (8 percent). Infectious and parasitic diseases and pregnancy and childbirth each accounted for 5 percent of hospital costs. |
|
Figure 5. Distribution of aggregate hospital costs by diagnostic category,* 2010. Pie chart; Total aggregate costs: $375.9 billion. Circulatory system, 18%, Musculoskeletal system, 14%, Respiratory system, 11%, Digestive system, 9%, Nervous system, 8%, Infectious and parasitic diseases, 5%, Pregnancy and childbirth, 5%, All other conditions, 30%. * Based on principal diagnosis defined by Major Diagnostic Category (MDC). Source: AHRQ, Center for Delivery, Organization, and Markets, Healthcare Cost and Utilization Project, Nationwide Inpatient Sample, 2010.
|
Hospital costs by diagnosis, 1997-2010 Aggregate inflation-adjusted hospital costs across all conditions increased 62 percent from $232.3 billion in 1997 to $375.9 billion in 2010. Table 1 shows the 20 principal diagnoses with the highest aggregate hospital costs in 2010. Of the 20 most costly conditions, septicemia experienced the fastest average annual percentage change in aggregate hospital costs since 1997 (11.2 percent annually). Septicemia ranked ninth in aggregate costs in 1997 and ranked first in aggregate costs in 2010. Other conditions with high aggregate cost increases (greater than 5 percent annually) were osteoarthritis; complications of devices, implants, and grafts; disc disorders and other back problems; respiratory failure; cardiac dysrhythmias; complications of surgical or medical care; and intracranial injury. The most costly type of conditions overall involved the circulatory system, with 5 of the 20 most costly conditions—acute myocardial infarction, coronary atherosclerosis, congestive heart failure, acute cerebrovascular disease, and cardiac dysrhythmias. These 5 conditions accounted for 13 percent of aggregate hospital costs in 2010. The cost per stay for 5 principal diagnoses was approximately double the average cost per stay in 2010 ($9,700): septicemia ($18,400), complication of device ($17,600), acute myocardial infarction ($18,200), respiratory failure ($22,300), and intracranial injury ($18,000). Conversely, the cost per stay for 3 principal diagnoses was substantially lower than the average cost per stay in 2010: liveborn (newborn infants) ($3,200 per stay), chronic obstructive pulmonary disease ($7,400 per stay), and mood disorders ($4,800 per stay). These 3 conditions were among the highest in aggregate hospital costs in 2010 because of their high frequency of hospitalization. |
| Table 1. Aggregate costs for hospital stays by principal diagnosis, 1997 and 2010 | |||||
| Principal CCS diagnosis | Aggregate inflation-adjusted hospital costs in billions (2010 dollars) | Mean cost per stay, inflation-adjusted (2010 dollars) | Average annual percentage change in aggregate costs | ||
|---|---|---|---|---|---|
| 1997 | 2010 | 1997 | 2010 | 1997-2010 | |
| All diagnoses | $232.3 | $375.9 | $6,700 | $9,700 | 3.8% |
| Septicemia (except in labor) | $4.3 | $17.1 | $10,400 | $18,400 | 11.2% |
| Osteoarthritis | $5.0 | $14.7 | $11,900 | $15,100 | 8.7% |
| Liveborn | $8.4 | $12.2 | $2,200 | $3,200 | 2.9% |
| Complication of device; implant or graft | $5.9 | $12.0 | $11,900 | $17,600 | 5.6% |
| Acute myocardial infarction | $9.7 | $11.0 | $13,200 | $18,200 | 0.9% |
| Spondylosis; intervertebral disc disorders; other back problems | $3.6 | $10.9 | $6,800 | $16,400 | 8.9% |
| Coronary atherosclerosis and other heart disease | $15.5 | $10.6 | $11,000 | $16,500 | -2.9% |
| Pneumonia (except that caused by tuberculosis or sexually transmitted disease) | $9.4 | $10.2 | $7,700 | $9,300 | 0.6% |
| Congestive heart failure; nonhypertensive | $7.1 | $10.1 | $7,100 | $10,500 | 2.8% |
| Acute cerebrovascular disease | $5.7 | $8.5 | $9,300 | $14,500 | 3.1% |
| Respiratory failure; insufficiency; arrest (adult) | $3.5 | $8.1 | $17,600 | $22,300 | 6.6% |
| Cardiac dysrhythmias | $3.8 | $7.3 | $6,600 | $9,500 | 5.2% |
| Complications of surgical procedures or medical care | $3.1 | $6.5 | $8,700 | $12,500 | 5.9% |
| Chronic obstructive pulmonary disease and bronchiectasis | $3.5 | $5.2 | $6,400 | $7,400 | 3.1% |
| Rehabilitation care; fitting of prostheses; and adjustment of devices | $4.0 | $5.1 | $10,100 | $12,500 | 2.0% |
| Biliary tract disease | $3.5 | $5.0 | $7,700 | $10,600 | 2.7% |
| Diabetes mellitus with complications | $2.9 | $4.9 | $7,100 | $9,000 | 4.1% |
| Fracture of neck of femur (hip) | $3.4 | $4.6 | $10,200 | $15,100 | 2.4% |
| Intracranial injury | $2.1 | $4.4 | $13,600 | $18,000 | 5.8% |
| Mood disorders | $3.3 | $4.3 | $5,100 | $4,800 | 2.0% |
| CCS: Clinical Classifications Software Source: AHRQ, Center for Delivery, Organization, and Markets, Healthcare Cost and Utilization Project, Nationwide Inpatient Sample, 1997 and 2010 |
|||||
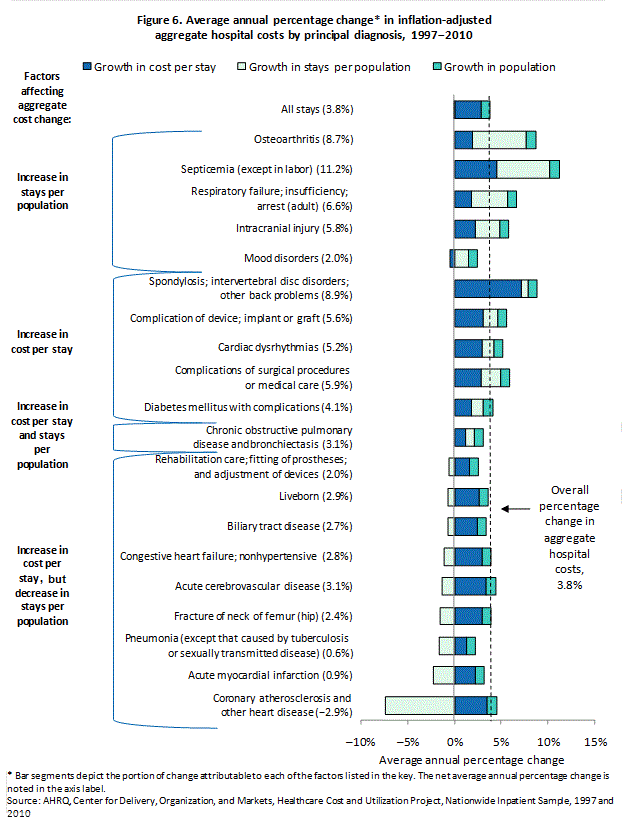
Cost factors accounting for change in hospital costs by diagnosis, 1997-2010 Figure 6 shows the average annual percentage change in aggregate hospital costs between 1997 and 2010 for the 20 principal diagnoses with the highest aggregate costs in 2010. Aggregate inflation-adjusted costs for hospital stays grew 3.8 percent annually between 1997 and 2010. Across all conditions, intensity of services provided during the hospital stay (cost per stay) increased by an average of 2.9 percent annually, population grew 1.0 percent annually, and the number of stays per population remained stable. The number of stays per population was the most important factor in cost growth for 5 of the 20 most costly conditions, including osteoarthritis and septicemia. Higher intensity of services accounted for a large proportion of growth in hospital costs for another 5 conditions, including spondylosis and complication of device. Both intensity of services and stays per population had similar contributions to cost growth for one condition, chronic obstructive pulmonary disease. Finally, for the remaining 9 most costly conditions, including coronary atherosclerosis and acute myocardial infarction, cost growth in service intensity was offset by a decrease in stays per population. Overall population growth contributed a small amount to cost growth for all conditions. |
|
Figure 6. Average annual percentage change* in inflation-adjusted aggregate hospital costs by principal diagnosis, 1997-2010. Stacked bar chart; Factors affecting aggregate cost change:
All stays, 3.8%, growth in cost per stay, 2.9%, growth in stays per population, -0.1%, growth in population, 1.0. Increase in stays per population: Osteoarthritis, 8.7%, growth in cost per stay, 1.9%, growth in stays per population, 5.8%, growth in population, 1.0%, Septicemia (except in labor), 11.2%, growth in cost per stay, 4.6%, growth in stays per population, 5.6%, growth in population, 1.0%, Respiratory failure; insufficiency; arrest (adult), 6.6%, growth in cost per stay, 1.9%, growth in stays per population,3.8%, growth in population, 1.0%, Intracranial injury, 5.8%, growth in cost per stay, 2.2%, growth in stays per population, 2.6%, growth in population, 1.0%, Mood disorders, 2.0%, growth in cost per stay, -0.5%, growth in stays per population, 1.5%, growth in population, 0.9%. Increase in cost per stay: Spondylosis; intervertebral disc disorders; other back problems, 8.9%, growth in cost per stay, 7.1%, growth in stays per population, 0.8%, growth in population, 1.0%, Complication of device; implant or graft, 5.6%, growth in cost per stay, 3.0%, growth in stays per population, 1.6%, growth in population, 1.0%, Cardiac dysrhythmias 5.2%, growth in cost per stay, 3.0%, growth in stays per population, 1.3%, growth in population, 1.0%, Complications of surgical procedures or medical care 5.9%; growth in cost per stay, 2.8%, growth in stays per population, 2.1%, growth in population, 1.0%, Diabetes mellitus with complications 4.1%; growth in cost per stay, 1.8%, growth in stays per population, 1.3% , growth in population, 1.0%. Increase in cost per stay and stays per population: Chronic obstructive pulmonary disease and bronchiectasis, 3.1%, growth in cost per stay, 1.2%, growth in stays per population, 0.9%, growth in population, 1.0%. Increase in cost per stay, but decrease in stays per population: Rehabilitation care; fitting of prostheses; and adjustment of devices, 2.0%, growth in cost per stay, 1.6%, growth in stays per population, -0.6%, growth in population, 1.0%, Liveborn, 2.9%, growth in cost per stay, 2.7%, growth in stays per population, -0.7%, growth in population, 1.0%, Biliary tract disease, 2.7%, growth in cost per stay, 2.4%, growth in stays per population, -0.7%, growth in population, 1.0%, Congestive heart failure; nonhypertensive, 2.8%, growth in cost per stay, 3.0%, growth in stays per population, -1.1%, growth in population, 1.0%, Acute cerebrovascular disease, 3.1%, growth in cost per stay, 3.4%, growth in stays per population, -1.3%, growth in population, 1.0%, Fracture of neck of femur (hip), 2.4%, growth in cost per stay, 3.0%, growth in stays per population, -1.6%, growth in population, 1.0%, Pneumonia (except that caused by tuberculosis or sexually transmitted disease), 0.6%, growth in cost per stay, 1.3%, growth in stays per population, -1.6%, growth in population, 0.9%, Acute myocardial infarction, 0.9%, growth in cost per stay, 2.3%, growth in stays per population, -2.2%, growth in population, 0.9%, Coronary atherosclerosis and other heart disease, -2.9%, growth in cost per stay, 3.5%, growth in stays per population, -7.4%, growth in population, 1.1%,.*Bar segments depict the portion of change attributable to each of the factors listed in the key. The net average annual percentage change is noted in the axis label. Source: AHRQ, Center for Delivery, Organization, and Markets, Healthcare Cost and Utilization Project, Nationwide Inpatient Sample, 1997 and 2010.
|
Data Source
The estimates in this Statistical Brief are based upon data from the HCUP 2010 NIS. Historical data were drawn from the 1997 NIS and the 2003 NIS. Supplemental sources included data on national population estimates from "Intercensal Estimates of the Resident Population by Single Year of Age, Sex, Race, and Hispanic Origin for the United States: April 1, 2000 to July 1, 2010," Population Division, U.S. Census Bureau, Release date: September 2011. (https://www.census.gov/data/datasets/time-series/demo/popest/intercensal-2000-2010-national.html). Supplemental sources also included data on national population estimates from "Intercensal Estimates of the United States Resident Population by Age and Sex, 1990-2000: Selected Months," Population Division, U.S. Census Bureau, Release date: August 2004. (https://www.census.gov/data/datasets/time-series/demo/popest/intercensal-1990-2000-national.html). Many hypothesis tests were conducted for this Statistical Brief. Thus, to decrease the number of false-positive results, we reduced the significance level to .001 for individual tests. Definitions Average Annual Percentage Change Average annual percentage change is calculated using the following formula: |
|
Average annual percentage change equals open parenthesis, open parenthesis, end value divided by beginning value, close parenthesis, to the power of 1 divided by change in years, minus 1, close parenthesis, multiplied by 100.
In this Statistical Brief, 1997 and 2010 were the base years used to calculate the average annual percentage change in aggregate hospital costs, cost per stay, population, and stays per 10,000 population. Average annual percentage change was calculated over 13 years:
Average annual percentage change equals open parenthesis, open parenthesis, 2010 value divided by 1997 value, close parenthesis, to the power of 1 divided by 13, minus 1, close parenthesis, multiplied by 100.
Diagnoses, ICD-9-CM Clinical Classifications Software (CCS), Diagnosis-Related Groups (DRGs), and Major Diagnostic Categories (MDCs) The principal diagnosis is that condition established after study to be chiefly responsible for the patient's admission to the hospital. Secondary diagnoses are concomitant conditions that coexist at the time of admission or that develop during the stay. All-listed diagnoses include the principal diagnosis plus these additional secondary conditions. ICD-9-CM is the International Classification of Diseases, Ninth Revision, Clinical Modification, which assigns numeric codes to diagnoses. There are about 14,000 ICD-9-CM diagnosis codes. CCS categorizes ICD-9-CM diagnoses into a manageable number of clinically meaningful categories.2 This "clinical grouper" makes it easier to quickly understand patterns of diagnoses. CCS categories identified as "Other" are typically not reported; these categories include miscellaneous, otherwise unclassifiable diagnoses that may be difficult to interpret as a group. DRGs comprise a patient classification system that categorizes patients into groups that are clinically coherent and homogeneous with respect to resource use. DRGs group patients according to diagnosis, type of treatment (procedures), age, and other relevant criteria. MDCs are broad groups of DRGs that relate to an organ or a system and not to an etiology (for example, MDC 06, Diseases and Disorders of the Digestive System). Each hospital stay has one DRG and one MDC assigned to it. Types of hospitals included in HCUP HCUP is based on data from community hospitals, defined as short-term, non-Federal, general, and other hospitals, excluding hospital units of other institutions (e.g., prisons). HCUP data include obstetrics and gynecology, otolaryngology, orthopedic, cancer, pediatric, public, and academic medical hospitals. Excluded are long-term care, rehabilitation, psychiatric, and alcoholism and chemical dependency hospitals. However, if a patient received long-term care, rehabilitation, or treatment for psychiatric or chemical dependency conditions in a community hospital, the discharge record for that stay will be included in the NIS. Unit of analysis The unit of analysis is the hospital discharge (i.e., the hospital stay), not a person or patient. This means that a person who is admitted to the hospital multiple times in one year will be counted each time as a separate "discharge" from the hospital. Costs and charges Total hospital charges were converted to costs using HCUP Cost-to-Charge Ratios based on hospital accounting reports from the Centers for Medicare & Medicaid Services (CMS).3 The 2010 costs reported here were developed using interim cost-to-charge ratios because the 2010 CMS hospital accounting reports were not available when this analysis occurred. Therefore, the costs reported here are preliminary estimates for 2010. The most up-to-date cost information is available on HCUPnet, the online query system that provides free access to information from HCUP.4 Costs will reflect the actual expenses incurred in the production of hospital services, such as wages, supplies, and utility costs; charges represent the amount a hospital billed for the case. For each hospital, a hospital-wide cost-to-charge ratio is used. Hospital charges reflect the amount the hospital billed for the entire hospital stay and do not include professional (physician) fees. For the purposes of this Statistical Brief, costs are reported to the nearest hundred. Payer Payer is the expected primary payer for the hospital stay. To make coding uniform across all HCUP data sources, payer combines detailed categories into more general groups:
About HCUP HCUP is a family of powerful healthcare databases, software tools, and products for advancing research. Sponsored by the Agency for Healthcare Research and Quality (AHRQ), HCUP includes the largest all-payer encounter-level collection of longitudinal healthcare data (inpatient, ambulatory surgery, and emergency department) in the United States, beginning in 1988. HCUP is a Federal-State-Industry Partnership that brings together the data collection efforts of many organizations—such as State data organizations, hospital associations, private data organizations, and the Federal government—to create a national information resource. HCUP would not be possible without the contributions of the following data collection Partners from across the United States: Alaska State Hospital and Nursing Home Association Arizona Department of Health Services Arkansas Department of Health California Office of Statewide Health Planning and Development Colorado Hospital Association Connecticut Hospital Association Florida Agency for Health Care Administration Georgia Hospital Association Hawaii Health Information Corporation Illinois Department of Public Health Indiana Hospital Association Iowa Hospital Association Kansas Hospital Association Kentucky Cabinet for Health and Family Services Louisiana Department of Health and Hospitals Maine Health Data Organization Maryland Health Services Cost Review Commission Massachusetts Center for Health Information and Analysis Michigan Health & Hospital Association Minnesota Hospital Association Mississippi Department of Health Missouri Hospital Industry Data Institute Montana MHA - An Association of Montana Health Care Providers Nebraska Hospital Association Nevada Department of Health and Human Services New Hampshire Department of Health & Human Services New Jersey Department of Health New Mexico Department of Health New York State Department of Health North Carolina Department of Health and Human Services Ohio Hospital Association Oklahoma State Department of Health Oregon Association of Hospitals and Health Systems Oregon Health Policy and Research Pennsylvania Health Care Cost Containment Council Rhode Island Department of Health South Carolina Budget & Control Board South Dakota Association of Healthcare Organizations Tennessee Hospital Association Texas Department of State Health Services Utah Department of Health Vermont Association of Hospitals and Health Systems Virginia Health Information Washington State Department of Health West Virginia Health Care Authority Wisconsin Department of Health Services Wyoming Hospital Association About the NIS The HCUP Nationwide Inpatient Sample (NIS) is a nationwide database of hospital inpatient stays. The NIS is nationally representative of all community hospitals (i.e., short-term, non-Federal, nonrehabilitation hospitals). The NIS is a sample of hospitals and includes all patients from each hospital, regardless of payer. It is drawn from a sampling frame that contains hospitals comprising more than 95 percent of all discharges in the United States. The vast size of the NIS allows the study of topics at both the national and regional levels for specific subgroups of patients. In addition, NIS data are standardized across years to facilitate ease of use. About HCUPnet HCUPnet is an online query system that offers instant access to the largest set of all-payer healthcare databases publicly available. HCUPnet has an easy step-by-step query system, allowing for tables and graphs to be generated on national and regional statistics, as well as trends for community hospitals in the United States. HCUPnet generates statistics using data from HCUP's Nationwide Inpatient Sample (NIS), the Kids' Inpatient Database (KID), the Nationwide Emergency Department Sample (NEDS), the State Inpatient Databases (SID), and the State Emergency Department Databases (SEDD). For More Information For more information about HCUP, visit http://www.hcup-us.ahrq.gov/. For additional HCUP statistics, visit HCUPnet, our interactive query system, at https://datatools.ahrq.gov/hcupnet. For information on other hospitalizations in the United States, download HCUP Facts and Figures: Statistics on Hospital-Based Care in the United States in 2009, located at http://www.hcup-us.ahrq.gov/reports.jsp. For a detailed description of HCUP, more information on the design of the NIS, and methods to calculate estimates, please refer to the following publications: Introduction to the HCUP Nationwide Inpatient Sample, 2010. Online. May 2012. U.S. Agency for Healthcare Research and Quality. Available at http://www.hcup-us.ahrq.gov/db/nation/nis/NISIntroduction2010.pdf. (Accessed August 22, 2012). Houchens R, Elixhauser A. Final Report on Calculating Nationwide Inpatient Sample (NIS) Variances, 2001. HCUP Methods Series Report #2003-2. Online. June 2005 (revised June 6, 2005). U.S. Agency for Healthcare Research and Quality. Available at http://www.hcup-us.ahrq.gov/reports/2003_02.pdf. (Accessed August 22, 2012). Houchens RL, Elixhauser A. Using the HCUP Nationwide Inpatient Sample to Estimate Trends. (Updated for 1988-2004). HCUP Methods Series Report #2006-05. Online. August 18, 2006. U.S. Agency for Healthcare Research and Quality. Available at https://www.hcup-us.ahrq.gov/reports/methods/2006_05_NISTrendsReport_1988-2004A.pdf. (Accessed August 22, 2012). Suggested Citation Pfuntner, A (Truven Health Analytics), Wier, LM (Truven Health Analytics), Steiner, C (AHRQ). Costs for Hospital Stays in the United States, 2010. HCUP Statistical Brief #146. January 2013. Agency for Healthcare Research and Quality, Rockville, MD. Available at http://www.hcup-us.ahrq.gov/reports/statbriefs/sb146.pdf. Acknowledgments The authors would like to acknowledge the contributions of Eva Witt of Truven Health Analytics. *** AHRQ welcomes questions and comments from readers of this publication who are interested in obtaining more information about access, cost, use, financing, and quality of healthcare in the United States. We also invite you to tell us how you are using this Statistical Brief and other HCUP data and tools, and to share suggestions on how HCUP products might be enhanced to further meet your needs. Please e-mail us at hcup@ahrq.gov or send a letter to the address below:Irene Fraser, Ph.D., Director Center for Delivery, Organization, and Markets Agency for Healthcare Research and Quality 540 Gaither Road Rockville, MD 20850 1 Kashihara, D. and Carper, K. National Health Care Expenses in the U.S. Civilian Noninstitutionalized Population, 2009. MEPS Statistical Brief #355. January 2012. Agency for Healthcare Research and Quality, Rockville, MD. http://www.meps.ahrq.gov/mepsweb/data_files/publications/st355/stat355.pdf. 2 HCUP Clinical Classifications Software (CCS). Healthcare Cost and Utilization Project (HCUP). U.S. Agency for Healthcare Research and Quality, Rockville, MD. Available at http://www.hcup-us.ahrq.gov/toolssoftware/ccs/ccs.jsp. Updated March 2012. (Accessed August 22, 2012). 3 HCUP Cost-to-Charge Ratio Files (CCR). Healthcare Cost and Utilization Project (HCUP). 2001-2009. U.S. Agency for Healthcare Research and Quality, Rockville, MD. Available at http://www.hcup-us.ahrq.gov/db/state/costtocharge.jsp. Updated August 2011. (Accessed August 22, 2012). 4 https://datatools.ahrq.gov/hcupnet |
| Internet Citation: Statistical Brief #146. Healthcare Cost and Utilization Project (HCUP). March 2013. Agency for Healthcare Research and Quality, Rockville, MD. hcup-us.ahrq.gov/reports/statbriefs/sb146.jsp. |
| Are you having problems viewing or printing pages on this website? |
| If you have comments, suggestions, and/or questions, please contact hcup@ahrq.gov. |
| If you are experiencing issues related to Section 508 accessibility of information on this website, please contact hcup@ahrq.gov. |
| Privacy Notice, Viewers & Players |
| Last modified 3/22/13 |