STATISTICAL BRIEF #145 |
December 2012
Anne Elixhauser, Ph.D., Claudia Steiner, M.D., M.P.H., Carolyn Gould, M.D., M.S.C.R. Introduction Clostridium difficile is a common cause of healthcare associated infectious colitis1 with symptoms ranging from mild diarrhea to pseudomembranous colitis and toxic megacolon.22 Clostridium difficile infections (CDI) often occur as a complication of antibiotic therapy3 with certain populations, such as the elderly, at highest risk.4 Previous reports in this series described steady increases during the past decade; however, the number of CDI hospital stays leveled off during 2008-2010.5, 6, 7 The problem of readmissions to the hospital is receiving increased attention9,10,11 although information on hospital readmissions following CDI is limited. One report examined CDI readmissions for a single county in California8 and tracked readmissions up to 12 weeks after discharge for CDI. This Statistical Brief presents data from the Healthcare Cost and Utilization Project (HCUP) on 30-day and 90-day CDI readmissions in U.S. hospitals during 2009. CDI index stays are defined as hospitalizations with any CDI diagnosis (principal or secondary) during January to November (for 30-day readmissions) or January to September (for 90-day readmissions). CDI hospital stays reported here include any discharge that is coded with a diagnosis of CDI, regardless of where the condition originated (in the hospital or in the community). Readmissions are tracked across the same or different hospitals within the 30-day or 90-day period within the same state. Readmission rates are examined for all patients and by age group, sex, and payer. In addition, principal diagnoses during readmissions are listed. Readmissions are also examined for the subgroup of patients discharged to long term care and nursing homes. Differences highlighted in the text are at least 10 percent between comparisons. Findings Among patients with a principal or secondary diagnosis of CDI during hospitalization, 4.8 percent were readmitted within 30 days with CDI as a principal diagnosis, 12.8 percent were readmitted with CDI as a principal or secondary diagnosis, and 29.1 percent were readmitted for any cause (table 1). Ninety-day readmission rates were higher—6.8 percent were readmitted with CDI as a principal diagnosis, 17.2 percent were readmitted with any-listed CDI, and 44.8 percent were readmitted for any cause. Costs per stay were 35-55 percent lower than the index hospital stays for all types of readmissions. |
|
| Table 1. Readmissions following hospital stays associated with CDI and cost per stay, 2009 | ||
| N (Percentage readmitted) |
Cost per stay | |
|---|---|---|
| Number of index stays with CDI (January to November) | 280,700 | $26,900 |
| Percentage readmitted within 30 days | ||
| With CDI as the principal diagnosis | 4.8% | $11,800 |
| With CDI in any diagnosis field* | 12.8% | $17,700 |
| With any diagnosis** | 29.1% | $16,200 |
| Number of index stays with CDI (January to September) | 233,800 | $26,800 |
| Percentage readmitted within 90 days | ||
| With CDI as the principal diagnosis | 6.8% | $11,500 |
| With CDI in any diagnosis field* | 17.2% | $17,700 |
| With any diagnosis** | 44.8% | $15,800 |
| Source: Weighted national estimates from a readmissions analysis file derived from the Healthcare Cost and Utilization Project (HCUP) State Inpatient Databases (SID), 2009, Agency for Healthcare Research and Quality (AHRQ) *CDI is the principal diagnosis or a secondary diagnosis in the readmission, i.e., all-listed CDI ** All-cause readmissions |
||
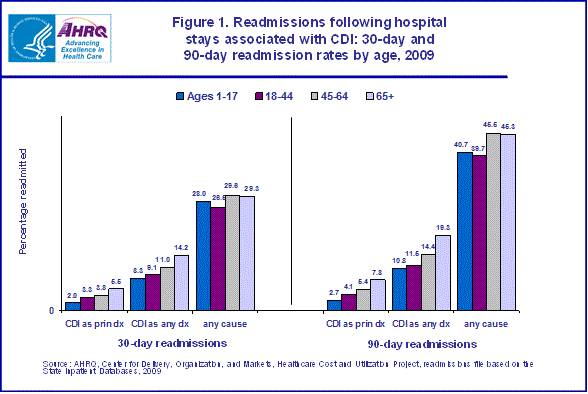
Readmissions by age following hospital stays with CDI Figure 1 illustrates readmission rates by age group. Thirty-day readmissions with CDI as a principal diagnosis ranged from 2.0 percent for the youngest age group to 5.5 percent for patients 65 and older. Thirty-day readmission rates for any-listed CDI ranged from 8.3 percent for pediatric cases to 14.2 percent for patients 65 and older. All-cause 30-day readmissions showed less variation across age groups, ranging from 26.5 percent to 29.6 percent. Ninety-day readmissions were uniformly higher than 30-day readmissions across all age groups, with 40 percent or more in all age groups readmitted for any cause. While both 30-day and 90-day readmission rates with a diagnosis of CDI were highest for patients older than 65 years, all-cause readmissions were similar for patients ages 45-64 and 65 plus. |
|
Figure 1. Readmissions following hospital stays associated with CDI: 30-day and 90-day readmission rates by age, 2009. Column bar chart; percentage readmissions for 30-day readmissions, CDI as prin dx, ages 1-17, 2.0%; ages 18-44, 3.3%; ages 45-64, 3.8%; age 65 and older, 5.5%. Column bar chart; percentage readmissions for 30-day readmissions, CDI as any dx, ages 1-17, 8.3%; ages 18-44, 9.1%; ages 45-64, 11.0%; age 65 and older, 14.2%. Column bar chart; percentage readmissions for 30-day readmissions, any cause, ages 1-17, 28.0%; ages 18-44, 26.5%; ages 45-64, 29.6%; age 65 and older, 29.3%. Column bar chart; percentage readmissions for 90-day readmissions, CDI as prin dx, ages 1-17, 2.7%; ages 18-44, 4.1%; ages 45-64, 5.4%; age 65 and older, 7.8%. Column bar chart; percentage readmissions for 90-day readmissions, CDI as any dx,, ages 1-17, 10.8%; ages 18-44, 11.5%; ages 45-64, 14.4%; age 65 and older, 19.3%. Column bar chart; percentage readmissions for 90-day readmissions, any cause, ages 1-17, 40.7%; ages 18-44, 39.7%; ages 45-64, 45.5%; age 65 and older, 45.3%. Source: AHRQ, Center for Delivery, Organization and Markets, Healthcare Cost and Utilization Project, readmissions file based on the State Inpatient Databases, 2009.
|
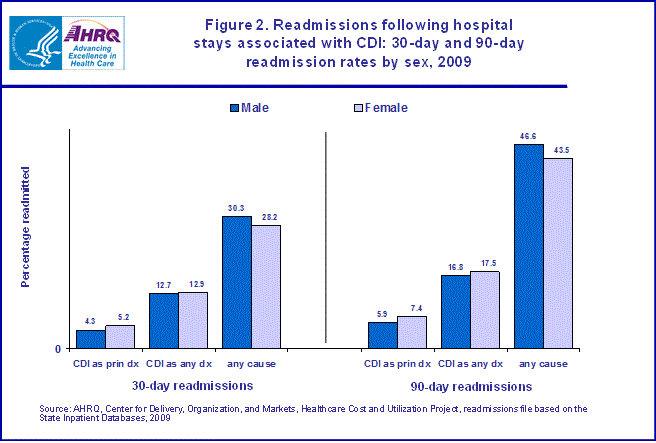
Readmissions by sex following hospital stays with CDI Figure 2 illustrates that readmission rates for males and females were comparable for most types of readmissions (less than 7 percent differences between males and females for both 30- and 90-day all-cause readmissions for all-listed CDI and all-cause readmissions). For readmissions with CDI as the principal diagnoses, rates were 20-25 percent higher for females. |
|
Figure 2. Readmissions following hospital stays associated with CDI: 30-day and 90-day readmission rates by sex, 2009. Column bar chart; percentage readmitted for 30-day readmissions, CDI as prin dx, male, 4.3%, female, 5.2%; as CDI as any dx, male, 12.7%, female, 12.9%; any cause, male, 30.3%, female, 28.2%. Column bar chart; percentage readmitted for 90-day readmissions, CDI as prin dx, male, 5.9%, female, 7.4%; as CDI as any dx, male, 16.8%, female, 17.5%; any cause, male, 46.6%, female, 43.5%. Source: AHRQ, Center for Delivery, Organization and Markets, Healthcare Cost and Utilization Project, readmissions file based on the State Inpatient Databases, 2009.
|
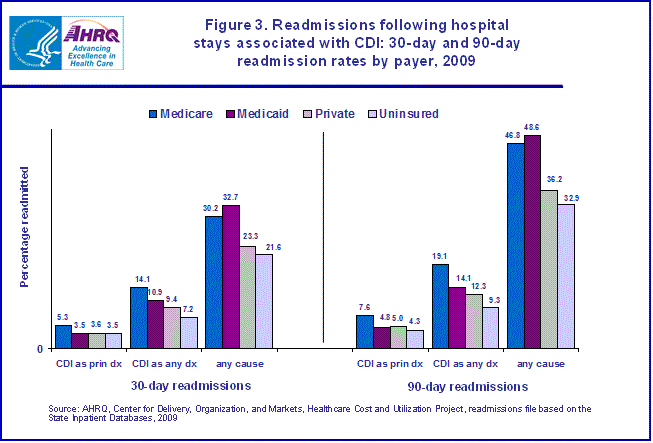
Readmissions by primary expected payer following hospital stays with CDI Figure 3 illustrates readmission rates by payer and shows that the 30-day readmission rate with CDI as the principal diagnosis was about 50 percent higher for patients covered by Medicare (5.3 percent) than for all other payers (3.5-3.6 percent). The 30-day readmission rate with CDI as any-listed diagnosis was lowest for uninsured patients (7.2 percent) and nearly twice as high for Medicare-covered patients (14.1 percent). Nearly 11 percent of Medicaid-covered patients and 9.4 percent of privately insured patients were readmitted with CDI within 30 days. Ninety-day readmission rates with CDI as a principal diagnosis and any-listed CDI showed a similar pattern. However, all-cause readmission rates were two to three times higher than readmissions with CDI at both 30 and 90 days. Within 30 days following discharge with CDI, 32.7 of Medicaid-covered patients were readmitted to the hospital for any cause and within 90 days, 48.6 percent of patients covered by Medicaid were readmitted for any cause. These readmission rates were similar to those for Medicare. All-cause readmission rates for Medicare- and Medicaid-covered patients were 30-50 percent higher than for privately insured and uninsured patients at both 30 and 90 days. |
|
Figure 3. Readmissions following hospital stays associated with CDI: 30-day and 90-day readmission rates by payer, 2009. Column bar chart; percentage readmissions for 30-day readmissions, CDI as prin dx, Medicare, 5.3%; Medicaid, 3.5%; Private, 3.6%; Uninsured, 3.5%. Column bar chart; percentage readmissions for 30-day readmissions, CDI as any dx, Medicare, 14.1%; Medicaid, 10.9%; Private, 9.4%; Uninsured, 7.2%. Column bar chart; percentage readmissions for 30-day readmissions, any cause, Medicare, 30.2%; Medicaid, 32.7%; Private, 23.3%; Uninsured, 21.6%. Column bar chart; percentage readmissions for 90-day readmissions, CDI as prin dx, Medicare, 7.6%; Medicaid, 4.8%; Private, 5.0%; Uninsured, 4.3%. Column bar chart; percentage readmissions for 90-day readmissions, CDI as any dx, Medicare, 19.1%; Medicaid, 14.1%; Private, 12.3%; Uninsured, 9.3%. Column bar chart; percentage readmissions for 90-day readmissions, any cause, Medicare, 46.8%; Medicaid, 48.6%; Private, 36.2%; Uninsured, 32.9%. Source: AHRQ, Center for Delivery, Organization and Markets, Healthcare Cost and Utilization Project, readmissions file based on the State Inpatient Databases, 2009.
|
Readmissions among patients discharged to long term care following hospital stays associated with CDI Table 2 provides information on readmissions for the subset of patients discharged to long term care (LTC) after an index stay that involved CDI. Overall, 41.5 percent of index stays were discharged to long term care. For most types of readmissions, readmission rates for patients discharged to LTC were somewhat higher than for patients overall. For example, 14.0 percent of patients discharged to LTC were readmitted within 30 days with any-listed diagnosis of CDI, compared to 12.8 percent overall (see Table 1). However, readmission rates among patients discharged to LTC were lower for CDI as the principal diagnosis (e.g., 3.8 percent of LTC patients were readmitted for CDI as the principal diagnosis, compared to 4.8 percent overall [see Table 1]). Most striking was the all-cause readmission rate for long term care patients-nearly half (49.0 percent) were readmitted within 90 days. |
| Table 2. Readmissions following index hospital stays associated with CDI for patients discharged to long term care (LTC) after their index stay, 2009 | |
| N (Percentage readmitted) | |
|---|---|
| Number of index stays with CDI discharged to LTC (January to November) | 116,600 |
| Percentage of CDI index stays discharged to LTC | 41.5% |
| Readmitted within 30 days | |
| With CDI as the principal diagnosis | 3.8% |
| With CDI in any diagnosis field | 14.0% |
| With any diagnosis | 31.5% |
| Number of index stays with CDI discharged to LTC (January to September) | 97,200 |
| Percentage of CDI index stays discharged to LTC | 41.6% |
| Readmitted within 90 days | |
| With CDI as the principal diagnosis | 5.9% |
| With CDI in any diagnosis field | 19.7% |
| With any diagnosis | 49.0% |
| Source: Weighted national estimates from a readmissions analysis file derived from the Healthcare Cost and Utilization Project (HCUP) State Inpatient Databases (SID), 2009, Agency for Healthcare Research and Quality (AHRQ) | |
Reasons for readmissions
Table 3 provides information on the principal diagnoses for readmissions following an index stay that involved CDI. Among patients with a diagnosis of CDI on readmission, over a third of readmitted patients have a diagnosis of CDI as the principal diagnosis for both 30-day and 90-day readmissions. Other infection-related diagnoses predominate—septicemia, pneumonia, and UTI. Other conditions reflect serious complications or comorbidities—CHF, complication of medical care, respiratory failure, aspiration pneumonitis, and renal failure. A similar pattern was seen for patients discharged to long term care following their index stay (data not shown). |
| Table 3. Top 10 principal diagnoses for readmissions following a CDI index stay, 2009 | ||||
| Principal diagnosis* | 30-day readmissions | 90-day readmissions | ||
|---|---|---|---|---|
| Readmission with CDI as any diagnosis | All-cause readmission following a stay with CDI | Readmission with CDI as any diagnosis | All-cause readmission following a stay with CDI | |
| Percentage of total | Percentage of total | |||
| Clostridium difficile (ICD-9 code 008.45) | 37.6 | 16.5 | 39.3 | 15.1 |
| Septicemia (except in labor) | 13.7 | 12.1 | 13.9 | 11.8 |
| Congestive heart failure | 4.0 | 4.9 | 3.6 | 5.0 |
| Complication of device, implant or graft | 3.4 | 4.2 | 3.2 | 4.2 |
| Pneumonia | 2.8 | 3.6 | 2.7 | 3.9 |
| Urinary tract infections | 2.0 | 3.1 | 2.1 | 3.3 |
| Respiratory failure; insufficiency; arrest | 1.7 | 2.2 | 1.5 | 2.0 |
| Aspiration pneumonitis; food/vomitus | 1.7 | -- | 1.7 | -- |
| Complications of surgical procedures or medical care | 1.6 | 2.6 | 1.6 | 2.6 |
| Acute and unspecified renal failure | 1.6 | 2.3 | 1.7 | 2.2 |
| Fluid and electrolyte disorders | -- | 2.6 | -- | 2.4 |
| Percentage of all readmissions attributable to the top 10 principal diagnoses | 70.1 | 54.1 | 71.3 | 52.5 |
| Source: Weighted national estimates from a readmissions analysis file derived from the Healthcare Cost and Utilization Project (HCUP) State Inpatient Databases (SID), 2009, Agency for Healthcare Research and Quality (AHRQ) * Except for Clostridium difficile, all diagnoses are categorized using the Clinical Classification Software (CCS) |
||||
Data Source
The estimates in this Statistical Brief are based upon a readmission analysis file that was created using the HCUP State Inpatient Databases (SID) from 16 States (AR, CA, FL, GA, HI, LA, MA, MO, NE, NH, NM, NY, SC, TN, UT, and WA) with reliable, verified synthetic patient identifiers that can be used to track a person across hospitals within a State. These 16 States were geographically dispersed and account for 43 percent of the total U.S. resident population and 42 percent of the total U.S. hospitalizations. The study population in this readmission analysis file included discharges from community, non-rehabilitation, non-specialty hospitals. Weights for national estimates were developed using post-stratification on hospital characteristics (Census region, urban-rural location, teaching capabilities, bed size, and control/ownership) and patient age groups. The readmission analysis file included 12.7 million unweighted discharges. Definitions Diagnoses, ICD-9-CM, and Clinical Classifications Software (CCS) The principal diagnosis is that condition established after study to be chiefly responsible for the patient's admission to the hospital. Secondary diagnoses are concomitant conditions that coexist at the time of admission or that develop during the stay. For this study, all-listed diagnoses were used (principal and secondary diagnoses). ICD-9-CM is the International Classification of Diseases, Ninth Revision, Clinical Modification, which assigns numeric codes to diagnoses. There are about 14,000 ICD-9-CM diagnosis codes. CCS categorizes ICD-9-CM diagnoses into a manageable number of clinically meaningful categories12 This "clinical grouper" makes it easier to quickly understand patterns of diagnoses. CCS categories identified as "Other" are typically not reported; these categories include miscellaneous, otherwise unclassifiable diagnoses that may be difficult to interpret as a group. Case definition The ICD-9-CM codes defining Clostridium difficile infections (CDI) include the following diagnosis code: 008.45. Readmission The 30-day (90-day) readmission rate is defined as the number of admissions for which there was at least one subsequent hospital admission within 30 (90) days divided by the total number of admissions between January and November 2009 (January and September 2009). That is, when a patient is discharged from the hospital, they are followed for 30 (90) days in the data. If any readmission to the same or different hospital occurs during this time period, the admission is counted as having a readmission. No more than one readmission is counted within the 30 (90) day period since the outcome measure assessed here is "percentage of admissions who are readmitted." If a patient was transferred to a different hospital on the same day or was transferred within the same hospital, the two events were combined as a single stay and the second event was not counted as a readmission. That is, transfers were not considered a readmission. In the case of admissions for which there was more than one readmission in the 30 (90) day period, the data presented in this Statistical Brief reflect the characteristics of the first readmission. Every qualifying hospital stay with the specified procedure is counted as a separate index (starting point) admission. Thus a single patient can be counted multiple times during the course of the January to November (January to September) observation period. In addition, index admissions do not require a prior "clean period" with no hospitalizations; that is, a hospital stay may be both a readmission for a prior stay and the index admission for a subsequent readmission. Admissions were disqualified from the analysis as index admissions if they could not be followed for 30 (90) days for one of the following reasons: (1) admissions in which the patient died in the hospital, (2) admissions missing information on length of stay, and (3) admissions discharged in December (September to December) of 2009. Costs and charges Total hospital charges were converted to costs using HCUP Cost-to-Charge Ratios based on hospital accounting reports from the Centers for Medicare & Medicaid Services (CMS).13 Costs will reflect the actual expenses incurred in the production of hospital services, such as wages, supplies, and utility costs; charges represent the amount a hospital billed for the case. For each hospital, a hospital-wide cost-to-charge ratio is used. Hospital charges reflect the amount the hospital billed for the entire hospital stay and do not include professional (physician) fees. For the purposes of this Statistical Brief, costs are reported to the nearest hundred. Mean cost per day is calculated as the mean cost per stay divided by the mean length of stay. Payer Payer is the expected primary payer for the hospital stay. To make coding uniform across all HCUP data sources, payer combines detailed categories into more general groups:
Discharge status Discharge status indicates the disposition of the patient at discharge from the hospital and includes the following six categories: routine (to home); transfer to another short-term hospital; other transfers (including skilled nursing facility, intermediate care, and another type of facility such as a nursing home); home healthcare; against medical advice (AMA); or died in the hospital. About HCUP HCUP is a family of powerful healthcare databases, software tools, and products for advancing research. Sponsored by the Agency for Healthcare Research and Quality (AHRQ), HCUP includes the largest all-payer encounter-level collection of longitudinal healthcare data (inpatient, ambulatory surgery, and emergency department) in the United States, beginning in 1988. HCUP is a Federal-State-Industry Partnership that brings together the data collection efforts of many organizations—such as State data organizations, hospital associations, private data organizations, and the Federal government—to create a national information resource. HCUP would not be possible without the contributions of the following data collection Partners from across the United States: Alaska State Hospital and Nursing Home Association Arizona Department of Health Services Arkansas Department of Health California Office of Statewide Health Planning and Development Colorado Hospital Association Connecticut Hospital Association Florida Agency for Health Care Administration Georgia Hospital Association Hawaii Health Information Corporation Illinois Department of Public Health Indiana Hospital Association Iowa Hospital Association Kansas Hospital Association Kentucky Cabinet for Health and Family Services Louisiana Department of Health and Hospitals Maine Health Data Organization Maryland Health Services Cost Review Commission Massachusetts Center for Health Information and Analysis Michigan Health & Hospital Association Minnesota Hospital Association Mississippi Department of Health Missouri Hospital Industry Data Institute Montana MHA - An Association of Montana Health Care Providers Nebraska Hospital Association Nevada Department of Health and Human Services New Hampshire Department of Health & Human Services New Jersey Department of Health New Mexico Department of Health New York State Department of Health North Carolina Department of Health and Human Services Ohio Hospital Association Oklahoma State Department of Health Oregon Association of Hospitals and Health Systems Oregon Health Policy and Research Pennsylvania Health Care Cost Containment Council Rhode Island Department of Health South Carolina Budget & Control Board South Dakota Association of Healthcare Organizations Tennessee Hospital Association Texas Department of State Health Services Utah Department of Health Vermont Association of Hospitals and Health Systems Virginia Health Information Washington State Department of Health West Virginia Health Care Authority Wisconsin Department of Health Services Wyoming Hospital Association About the SID The HCUP State Inpatient Databases (SID) are hospital inpatient databases from data organizations participating in HCUP. The SID contains the universe of the inpatient discharge abstracts in the participating HCUP States, translated into a uniform format to facilitate multistate comparisons and analyses. Together, the SID encompasses 95 percent of all U.S. community hospital discharges in 2009. The SID can be used to investigate questions unique to one State; to compare data from two or more States; to conduct market area variation analyses; and to identify State-specific trends in inpatient care utilization, access, charges, and outcomes. For More Information For more information about HCUP, visit http://www.hcup-us.ahrq.gov/. For additional HCUP statistics, visit HCUPnet, our interactive query system, at https://datatools.ahrq.gov/hcupnet. For information on other hospitalizations in the United States, download HCUP Facts and Figures: Statistics on Hospital-Based Care in the United States in 2009, located at http://www.hcup-us.ahrq.gov/reports.jsp. Suggested Citation Elixhauser A (AHRQ), Steiner C (AHRQ), Gould C (CDC). Readmissions following Hospitalizations with Clostridium difficile Infections, 2009. HCUP Statistical Brief #145. December 2012. Agency for Healthcare Research and Quality, Rockville, MD. Available at http://www.hcup-us.ahrq.gov/reports/statbriefs/sb145.pdf. *** AHRQ welcomes questions and comments from readers of this publication who are interested in obtaining more information about access, cost, use, financing, and quality of healthcare in the United States. We also invite you to tell us how you are using this Statistical Brief and other HCUP data and tools, and to share suggestions on how HCUP products might be enhanced to further meet your needs. Please e-mail us at hcup@ahrq.gov or send a letter to the address below:Irene Fraser, Ph.D., Director Center for Delivery, Organization, and Markets Agency for Healthcare Research and Quality 540 Gaither Road Rockville, MD 20850 1Bartlett, J. G. "Antibiotic-associated Diarrhea." New England Journal of Medicine. 2002; 346(5): 334-349. 2 Cohen, S. H., Gerding, D. N., Johnson, S., Kelly, C.P., et al. "Clinical Practice Guidelines for Clostridium difficile Infection in Adults: 2010 Update by the Society for Healthcare Epidemiology of America (SHEA) and the Infectious Diseases Society of America (IDSA)." Infection Control and Hospital Epidemiology. 2010; 31(5): 431-455. 3 Blondeau, J. M. "What Have We Learned about Antimicrobial Use and The Risks for Clostridium difficile-Associated Diarrhoea?" Journal of Antimicrobial Chemotherapy. 2009; 63(2): 230-237. 4 McDonald, L. C., Owings, M., Jernigan, D. B. "Clostridium difficile Infection in Patients Discharged from U.S. Short-Stay Hospitals, 1996-2003." Emerging Infectious Diseases. 2006; 12(3): 409-415. 5 Elixhauser, A., Jhung, M. A. Clostridium Difficile-Associated Disease in U.S. Hospitals, 1993-2005. HCUP Statistical Brief #50. April 2008. Agency for Healthcare Research and Quality, Rockville MD. Available at http://www.hcup-us.ahrq.gov/reports/statbriefs/sb50.pdf. (Accessed November 30, 2012) 6 Lucado, J., Gould, C., and Elixhauser, A. Clostridium difficile Infections (CDI) in Hospital Stays, 2009. HCUP Statistical Brief #124. January 2012. Agency for Healthcare Research and Quality, Rockville, MD. Available at http://www.hcup-us.ahrq.gov/reports/statbriefs/sb124.pdf. (Accessed November 30, 2012) 7The most recently available data for 2010 shows no significant difference between the number of CDI hospital stays for 2008-2010 (Available at https://datatools.ahrq.gov/hcupnet). (Accessed November 30, 2012) 8Murphy, C.R., Avery, T.R., Dubberke, E.R., Huang, S.S. Frequent hospital readmissions for Clostridium difficile infection and the impact on estimates of hospital-associated C. difficile burden. Infection Control and Hospital Epidemiology. 2012 Jan;33(1):20-8. Epub 2011 Nov 11. 9Jencks SF, Williams MV, Coleman EA. "Rehospitalizations among Patients in the Medicare Fee-for-Service Program," N Engl J Med 2009;360:1418-28. See http://www.nejm.org/doi/full/10.1056/NEJMsa0803563 10Amy Boutwell and Steve Jencks, "It's Not Six of One, Half-Dozen of the Other: A Comparative Analysis of Three Rehospitalization Measurement Systems for Massachusetts," 2011 AcademyHealth Annual Research Meeting and National Quality Forum accessed May 2012 at www.qualityforum.org 113M Health Information Systems, "Potentially Preventable Readmissions Classification System, Methodology Overview," 2008, Document number GRP-139 05/08. 12HCUP Clinical Classifications Software (CCS). Healthcare Cost and Utilization Project (HCUP). U.S. Agency for Healthcare Research and Quality, Rockville, MD. Available at http://www.hcup-us.ahrq.gov/toolssoftware/ccs/ccs.jsp. Updated March 2012. (Accessed November 30, 2012). 13HCUP Cost-to-Charge Ratio Files (CCR). Healthcare Cost and Utilization Project (HCUP). 2001-2009. U.S. Agency for Healthcare Research and Quality, Rockville, MD. Available at http://www.hcup-us.ahrq.gov/db/state/costtocharge.jsp. Updated August 2011. (Accessed November 30, 2012). |
| Internet Citation: Statistical Brief #145. Healthcare Cost and Utilization Project (HCUP). May 2016. Agency for Healthcare Research and Quality, Rockville, MD. hcup-us.ahrq.gov/reports/statbriefs/sb145.jsp. |
| Are you having problems viewing or printing pages on this website? |
| If you have comments, suggestions, and/or questions, please contact hcup@ahrq.gov. |
| If you are experiencing issues related to Section 508 accessibility of information on this website, please contact hcup@ahrq.gov. |
| Privacy Notice, Viewers & Players |
| Last modified 5/12/16 |