STATISTICAL BRIEF #117
|
|
June 2011
Elizabeth Stranges, M.S., Katharine Levit, Carol Stocks, R.N., M.H.S.A., Pat Santora, Ph.D.
Introduction In 2005, more than half of hospital spending for mental health (MH) treatment and more than three-quarters for substance abuse (SA) treatment took place in inpatient or outpatient departments of community hospitals1, most often in specialty units. While treatment for MH and SA conditions may also occur in specialized psychiatric or chemical dependency hospitals, trends in spending indicate that inpatient treatment is increasingly taking place in community hospitals.2 In 2008, the MHSA conditions most frequently treated in community hospitals were mood disorders (depression and bipolar disorder), schizophrenia and other psychotic disorders, alcohol-related disorders and drug-related disorders.3 Treatment for alcohol- and drug-related disorders was often for substance withdrawal. In this Statistical Brief, we present descriptive data from the Healthcare Cost and Utilization Project (HCUP) Nationwide Inpatient Sample (NIS) on the characteristics of nationwide community hospitalizations for MHSA conditions, and examine how these compare to all other stays, that is, non-MHSA stays. We also use the HCUP State Inpatient Databases (SID) to explore differences in cost per stay, change in cost per stay, length of stay, and change in length of stay among 39 states. All differences between nationwide estimates provided in the text are statistically significant at the 0.05 level or better. Findings In 2008, MH or SA disorders were the principal reason for 1.8 million inpatient community hospital stays, accounting for 4.5 percent of stays in the U.S. (table 1). Altogether, these MHSA hospital stays cost $9.7 billion ($7.7 billion for MH; $2.1 billion for SA),4 accounting for 2.7 percent of all inpatient community hospital costs. |
|
| Table 1. Characteristics of hospital stays for mental health, substance abuse and non-mental health/substance abuse diagnoses, 2008 | |||
| MH stays‡ | SA stays‡ | Non-MHSA stays | |
|---|---|---|---|
| Number of stays | 1,345,700 | 446,800 | 38,092,600 |
| Stays per 1,000 population | 4.4 | 1.5 | 125.3 |
| Hospital stay characteristics: | |||
| Average length of stay* | 8.0 | 4.8 | 4.5 |
| Aggregate cost (billions) | $7.7 | $2.1 | $355.0 |
| Average cost per stay* | $5,700 | $4,600 | $9,300 |
| Average cost per day | $710 | $970 | $2,080 |
| Patient characteristics: | |||
| Sex (percentage distribution)* | |||
| Female | 53% | 33% | 59% |
| Male | 47% | 67% | 41% |
| Age (percentage distribution)* | |||
| <1 | 0% | 0% | 13% |
| 1-17 | 10% | 1% | 4% |
| 18-44 | 50% | 51% | 24% |
| 45-64 | 31% | 40% | 23% |
| 65-84 | 8% | 6% | 28% |
| 85+ | 1% | 1% | 8% |
| Payer (percentage distribution)* | |||
| Medicare1 | 29% | 16% | 38% |
| Medicaid | 28% | 26% | 18% |
| Private insurance | 30% | 30% | 36% |
| Uninsured | 9% | 21% | 5% |
| Other | 4% | 6% | 3% |
| ‡Stays are defined on the basis of the principal diagnosis. *Differences between MH and SA stays, MH and non-MHSA stays, and SA and non-MHSA stays were statistically significant at p<0.05. 1 Medicare covers hospital care for those 65 and older as well as patients with certain disabilities and end stage renal disease. Source: AHRQ, Center for Delivery, Organization, and Markets, Healthcare Cost and Utilization Project, Nationwide Inpatient Sample, 2008 | |||
The average length of a MH stay (8.0 days) was 3.5 days longer than a non-MHSA stay (4.5 days) and 3.2 days longer than a SA stay (4.8 days). On average, both MH and SA hospitalizations were less expensive than non-MHSA stays ($5,700 per MH stay; $4,600 per SA stay; $9,300 per non-MHSA stay). Hospital costs for MH and SA stays generally were lower than other medical or surgical conditions because high-technology equipment and procedures are not typically employed in treating MHSA disorders. While SA stays typically cost less than MH stays, the mean cost per day for SA stays was higher than MH stays ($970 per day for SA; $710 per day for MH). Non-MHSA stays cost an average of $2,080 per day.
Hospital stays for MH conditions were more evenly distributed between males and females than were non-MHSA stays (MH stays were 53 percent female; non-MHSA stays were 59 percent female). In contrast, a larger share of SA stays (67 percent) was for males. Hospital stays for MH and SA conditions were more frequently for younger patients than were stays for all other non-MHSA conditions. Patients 18-44 years of age accounted for about half of all MH and SA stays, but just one quarter of all other non-MHSA stays. Only 7-9 percent of MHSA stays were for patients 65 and older, compared to 36 percent of non-MHSA stays. MH and SA stays were more frequently covered by Medicaid (28 percent for MH; 26 percent for SA) or were uninsured (9 percent for MH; 21 percent for SA) than were non-MHSA stays. In comparison, non-MHSA stays were most often paid for by Medicare (38 percent) and private insurance (36 percent); Medicaid accounted for 18 percent and the uninsured for just 5 percent of these stays. While these nationwide statistics show important differences in inpatient stays between MHSA and non-MHSA patients, examining statistics by state also reveals significant differences among states for MHSA stays. Variations across states for MH and SA hospital stays, 2008 Across the 39 states examined, average costs per stay for MH and SA conditions varied substantially by state (figure 1). |
|
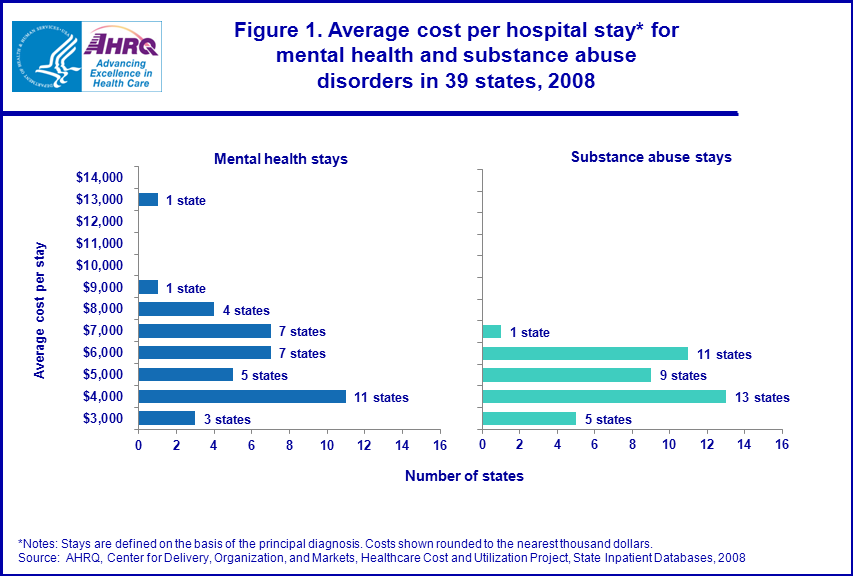
Figure 1. Average cost per hospital stay* for mental health and substance abuse
disorders in 39 states, 2008. Bar chart; average cost per stay; range of costs on Y axis is between $3,000 and $14,000 for both mental health and substance abuse stays; for mental health stays only, one state is in $13,000 range; one state is in $9,000 range; four states are in $8,000; seven states are in $7,000 range; seven states are in $6,000 range; five states are in $5,000 range; eleven states are in $4,000 ranges; three states in $3,000 range.
For substance abuse stays only, one state is in the $7,000 range; eleven states are in the $6,000 range; nine states are in the $5,000 range; thirteen states are in the $4,000 range, five states are in the $3,000 range. *Notes: Stays are defined on the basis of the principal diagnosis. Costs shown rounded to the nearest thousand dollars.Source: AHRQ, Center for Delivery, Organization, and Markets, Healthcare Cost and Utilization Project, State Inpatient Databases, 2008.
|
The average cost of a MH stay ranged from a low of $2,900 to a high of $13,300; the average cost of a SA stay ranged from $2,900 to $6,600. In most states, the average cost per MH and SA stay was close to the nationwide average ($5,700 for MH stays and $4,600 for SA stays). Average costs can vary due to the different mix of patient demographics and diagnoses, presence of alternative inpatient stay facilities (psychiatric and substance abuse hospitals), availability of community-based outpatient and residential treatment options, Medicaid reimbursement and coverage policies, and expenses faced by hospitals (such as wages, benefits and utilities) in each state.
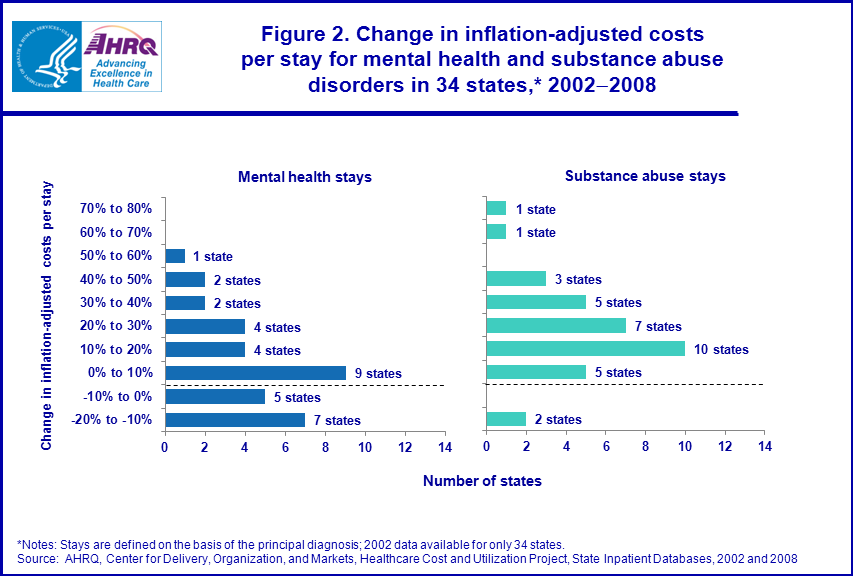
Figure 2 shows the change in inflation-adjusted state-level costs per stay for MH and SA conditions between 2002 and 2008. During this period, 7 out of 34 states saw a decline in the average inflation-adjusted cost of a MH stay of at least 10 percent while 13 of 34 states saw an increase of at least 10 percent. At the same time, the average inflation-adjusted cost of a SA stay decreased by at least 10 percent in 2 of 34 states and increased at least 10 percent in 27 of 34 states (by as much as 74 percent). |
|
Figure 2. Change in inflation-adjusted costs per stay for mental health and substance abuse disorders in 34 states,* 2002-2008. Bar chart; change in inflation-adjusted costs per stay; Y axis range is from -20% to 80% in ranges of 10% for ten increments. For mental health stays only; One state is in the 50 to 60 percent range; two states are in the 40 to 50 percent range; two states are in the 30 to 40 percent range; four states are in the 20 to 30 percent range; four states are in the 10 to 20 percent range; nine states are in the 0 to 10 percent range; five states are in the -10 to 0 percent range; seven states are in the -20 to -10 percent range. For substance abuse stays only; One state is in the 70 to 80 percent range; one state is in the 60 to 70 percent range; three states are in the 40 to 50 percent range; five states are in the 30 to 40 percent range; seven states are in the 20 to 30 percent range; ten states are in the 10 to 20 percent range; five states are in the 0 to 10 percent range; two states are in the -20 to -10 percent range. *Notes: Stays are defined on the basis of the principal diagnosis; 2002 data available for only 34 states.
Source: AHRQ, Center for Delivery, Organization, and Markets, Healthcare Cost and Utilization Project, State Inpatient Databases, 2002 and 2008.
|
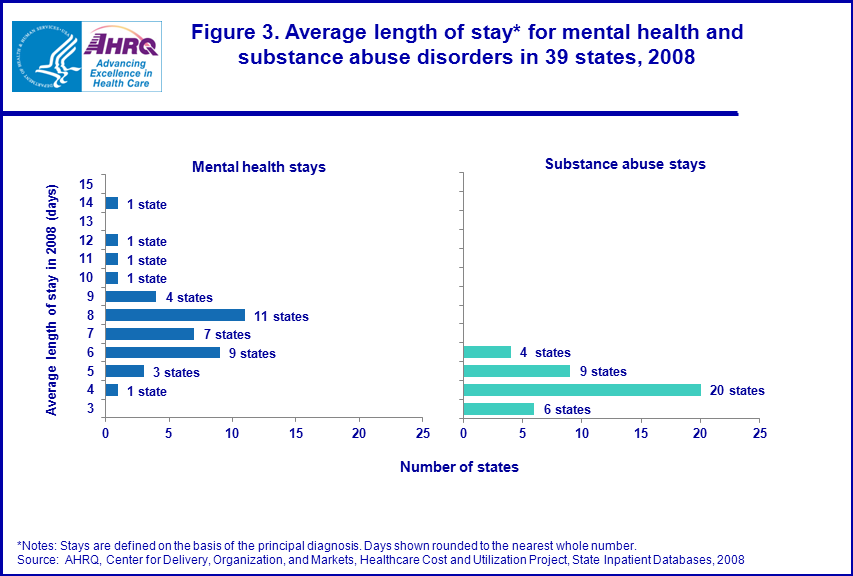
Figure 3 shows that the state-level average length of a MH stay ranged from 4.0 to 14.0 days (in contrast to a national average of 8.0 days). The range in the length of SA stays was narrower: from 3.2 to 6.2 days across the states examined here (in contrast to the national average of 4.8 days). Variations in the average length of stay can reflect state-level differences in case-mix, treatment practices, presence of alternative inpatient stay facilities (psychiatric and substance abuse hospitals), and availability of community-based outpatient and residential treatment options that may reduce the need for inpatient hospitalization.
|
|
Figure 3. Average length of stay* for mental health and substance abuse disorders in 39 states, 2008. Bar chart, average length of stay in 2008 (days); Y axis range for mental health stays and substance abuse stays is 3 to 15 days; for mental health stays only, one state, fourteen days; one state, twelve days; one state, eleven days; one state, ten days; four states, nine days; eleven states, eight days; seven states, seven days; nine states, six days; three states, five days; one state, four days. For substance abuse stays only, four states, six days; nine states, five days; twenty states, four days; six states, three days. *Notes: Stays are defined on the basis of the principal diagnosis. Days shown rounded to the nearest whole number. Source: AHRQ, Center for Delivery, Organization, and Markets, Healthcare Cost and Utilization Project, State Inpatient Databases, 2008.
|
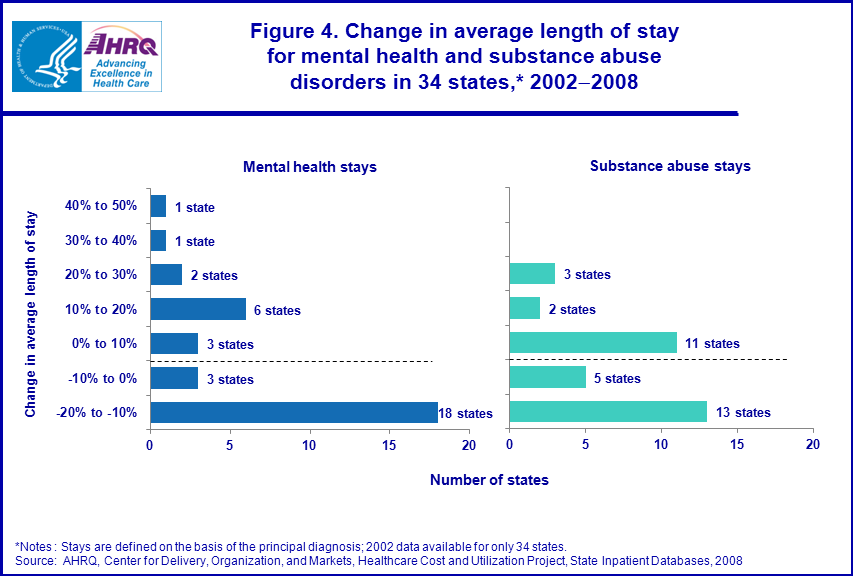
Figure 4 shows the change in the average length of stay for MH and SA conditions between 2002 and 2008. During this period, 18 of 34 states saw a decline in the average length of a MH stay of at least 10 percent while 10 of 34 states saw an increase of at least 10 percent. At the same time, the average length of a SA stay decreased by at least 10 percent in 13 of 34 states and increased by at least 10 percent in 5 states.
|
|
Figure 4. Change in average length of stay for mental health and substance abuse
disorders in 34 states,* 2002-2008. Bar chart; change in average length of stay; Y axis range is from -20% to 50% in ranges of 10% for seven increments. For mental health stays only; One state is in the 40 to 50 percent range; one state is in the 30 to 40 percent range; two states are in the 20 to 30 percent range; six states are in the 10 to 20 percent range; three states are in the 0 to 10 percent range; three states are in the -10 to 0 percent range; eighteen states are in the -20 to -10 percent range. For substance abuse stays only; three states are in the 20 to 30 percent range; two states are in the 10 to 20 percent range; eleven states are in the 0 to 10 percent range; five states are in the -10 to 0 percent range; thirteen states are in the -20 to -10 percent range. *Notes : Stays are defined on the basis of the principal diagnosis; 2002 data available for only 34 states. Source: AHRQ, Center for Delivery, Organization, and Markets, Healthcare Cost and Utilization Project, State Inpatient Databases, 2008.
|
|
Data Source
The estimates in this Statistical Brief are based upon data from the HCUP NIS for 2002 and 2008 and the HCUP SID for 2002 and 2008. Definitions Diagnoses The ICD-9-CM codes defining MH and SA stays are as follows: |
| Table 1. Characteristics of hospital stays for mental health, substance abuse and non-mental health/substance abuse diagnoses, 2008 | ||
| ICD-9 Code | ICD-9 Disease Category | Included in MH/SA |
|---|---|---|
| 290.xx-319.xx | MENTAL DISORDERS | |
| 290.xx-299.xx | Psychoses | |
| 291.xx | Alcohol-induced mental disorders | SA |
| 292.xx | Drug-induced disorders | SA |
| 295.xx | Schizophrenic disorders | MH |
| 296.xx | Episodic mood disorders | MH |
| 297.xx | Delusional disorders | MH |
| 298.xx | Other nonorganic psychoses | MH |
| 299.xx | Pervasive developmental disorders | MH |
| 300.xx-316.xx | Neurotic disorders, personality disorders, and other nonpsychotic mental disorders | |
| 300.xx | Anxiety, dissociative and somatoform disorders | MH |
| 301.xx | Personality disorders | MH |
| 302.xx | Sexual and sex identity disorders | MH |
| 303.xx | Alcohol dependence syndrome | SA |
| 304.xx | Drug dependence | SA |
| 305.2x-305.9x | Nondependent abuse of drugs—except tobacco abuse disorder | SA |
| 306.xx | Physiological malfunction arising from mental factors | MH |
| 307.xx | Special symptoms and syndromes, not elsewhere classified | MH |
| 308.xx | Acute reaction to stress | MH |
| 309.xx | Adjustment reaction | MH |
| 310.xx | Specific nonpsychotic mental disorders due to brain damage | MH |
| 311.xx | Depressive disorder, not elsewhere classified | MH |
| 312.xx | Disturbance of conduct, not elsewhere classified | MH |
| 313.xx | Disturbance of emotions to childhood and adolescence | MH |
| 314.xx | Hyperkinetic syndrome of childhood | MH |
| 648.3x | Complications mainly related to pregnancy—drug dependence | SA |
| 648.4x | Complications mainly related to pregnancy—mental disorders | MH |
|
Types of hospitals included in HCUP
HCUP is based on data from community hospitals, defined as short-term, non-Federal, general and other hospitals, excluding hospital units of other institutions (e.g., prisons). HCUP includes data from OB-GYN, ENT, orthopedic, cancer, pediatric, public, and academic medical hospitals. Excluded are long-term care, rehabilitation, psychiatric, and alcoholism and chemical dependency hospitals. However, if a patient received long-term care, rehabilitation, or treatment for psychiatric or chemical dependency conditions in a community hospital, the discharge record for that stay will be included in the NIS. Unit of analysis The unit of analysis is the hospital discharge (i.e., the hospital stay), not a person or patient. This means that a person who is admitted to the hospital multiple times in one year will be counted each time as a separate "discharge" from the hospital. Costs and charges Total hospital charges were converted to costs using HCUP cost-to-charge ratios based on hospital accounting reports from the Centers for Medicare and Medicaid Services (CMS).5 Costs will reflect the actual expenses incurred in the production of hospital services, such as wages, supplies and utility costs, while charges represent the amount a hospital billed for the case. For each hospital, a hospital-wide cost-to-charge ratio is used. Hospital charges reflect the amount the hospital billed for the entire hospital stay and does not include professional (physician) fees. For the purposes of this Statistical Brief, costs are reported to the nearest hundred. About HCUP HCUP is a family of powerful healthcare databases, software tools, and products for advancing research. Sponsored by the Agency for Healthcare Research and Quality (AHRQ), HCUP includes the largest all-payer encounter-level collection of longitudinal healthcare data (inpatient, ambulatory surgery, and emergency department) in the United States, beginning in 1988. HCUP is a Federal-State-Industry Partnership that brings together the data collection efforts of many organizations-such as State data organizations, hospital associations, private data organizations, and the Federal government-to create a national information resource. HCUP would not be possible without the contributions of the following data collection Partners from across the United States: Arizona Department of Health Services Arkansas Department of Health California Office of Statewide Health Planning and Development Colorado Hospital Association Connecticut Hospital Association Florida Agency for Health Care Administration Georgia Hospital Association Hawaii Health Information Corporation Illinois Department of Public Health Indiana Hospital Association Iowa Hospital Association Kansas Hospital Association Kentucky Cabinet for Health and Family Services Louisiana Department of Health and Hospitals Maine Health Data Organization Maryland Health Services Cost Review Commission Massachusetts Division of Health Care Finance and Policy Michigan Health & Hospital Association Minnesota Hospital Association Missouri Hospital Industry Data Institute Montana MHA — An Association of Montana Health Care Providers Nebraska Hospital Association Nevada Department of Health and Human Services New Hampshire Department of Health & Human Services New Jersey Department of Health and Senior Services New Mexico Health Policy Commission New York State Department of Health North Carolina Department of Health and Human Services Ohio Hospital Association Oklahoma State Department of Health Oregon Association of Hospitals and Health Systems Pennsylvania Health Care Cost Containment Council Rhode Island Department of Health South Carolina State Budget & Control Board South Dakota Association of Healthcare Organizations Tennessee Hospital Association Texas Department of State Health Services Utah Department of Health Vermont Association of Hospitals and Health Systems Virginia Health Information Washington State Department of Health West Virginia Health Care Authority Wisconsin Department of Health Services Wyoming Hospital Association About the NIS The HCUP Nationwide Inpatient Sample (NIS) is a nationwide database of hospital inpatient stays. The NIS is nationally representative of all community hospitals (i.e., short-term, non-Federal, non-rehabilitation hospitals). The NIS is a sample of hospitals and includes all patients from each hospital, regardless of payer. It is drawn from a sampling frame that contains hospitals comprising about 95 percent of all discharges in the United States. The vast size of the NIS allows the study of topics at both the national and regional levels for specific subgroups of patients. In addition, NIS data are standardized across years to facilitate ease of use. About the SID The HCUP State Inpatient Databases (SID) are hospital inpatient databases from data organizations participating in HCUP. The SID contain the universe of the inpatient discharge abstracts in the participating HCUP states, translated into a uniform format to facilitate multistate comparisons and analyses. Together, the SID encompasses 95 percent of all U.S. community hospital discharges in 2009. The SID can be used to investigate questions unique to one state; to compare data from two or more states; to conduct market area variation analyses; and to identify state-specific trends in inpatient care utilization, access, charges, and outcomes. For More Information For more information about HCUP, visit http://www.hcup-us.ahrq.gov. For additional HCUP statistics, visit HCUPnet, our interactive query system, at www.hcup.ahrq.gov. For information on other hospitalizations in the U.S., download HCUP Facts and Figures: Statistics on Hospital-based Care in the United States in 2008, located at http://www.hcup-us.ahrq.gov/reports.jsp. For a detailed description of HCUP, more information on the design of the NIS, and methods to calculate estimates, please refer to the following publications: Introduction to the HCUP Nationwide Inpatient Sample, 2008. Online. May 2010. U.S. Agency for Healthcare Research and Quality. http://hcup-us.ahrq.gov/db/nation/nis/NIS_2008_INTRODUCTION.pdf Introduction to the HCUP State Inpatient Databases. Online. June 2010. Agency for Healthcare Research and Quality. http://hcup-us.ahrq.gov/db/state/siddist/Introduction_to_SID.pdf Houchens RL, Elixhauser A. Using the HCUP Nationwide Inpatient Sample to Estimate Trends. (Updated for 1988-2004). HCUP Methods Series Report #2006-05 Online. August 18, 2006. U.S. Agency for Healthcare Research and Quality. http://www.hcup-us.ahrq.gov/reports/2006_05_NISTrendsReport_1988-2004.pdf Suggested Citation Stranges, E. (Thomson Reuters), Levit, K. (Thomson Reuters), Stocks, C. (Agency for Healthcare Research and Quality) and Santora, P. (Substance Abuse and Mental Health Services Administration). State Variation in Inpatient Hospitalizations for Mental Health and Substance Abuse Conditions, 2002-2008. HCUP Statistical Brief #117. June 2011. Agency for Healthcare Research and Quality, Rockville, MD. http://www.hcup-us.ahrq.gov/reports/statbriefs/sb117.pdf Acknowledgments The authors would like to acknowledge Anne Pfuntner and Nils Nordstrand for their assistance on this Brief. *** AHRQ welcomes questions and comments from readers of this publication who are interested in obtaining more information about access, cost, use, financing, and quality of healthcare in the United States. We also invite you to tell us how you are using this Statistical Brief and other HCUP data and tools, and to share suggestions on how HCUP products might be enhanced to further meet your needs. Please e-mail us at hcup@ahrq.gov or send a letter to the address below:Irene Fraser, Ph.D., Director Center for Delivery, Organization, and Markets Agency for Healthcare Research and Quality 540 Gaither Road Rockville, MD 20850 1 Community hospitals are defined as short-term, acute care general and specialty hospitals including academic medical centers but excluding federal hospitals and hospital units of other institutions such as prisons. 2 Substance Abuse and Mental Health Services Administration. National Expenditures for Mental Health Services and Substance Abuse Treatment, 1986-2005. DHHS Publication No. (SMA) 10-4612. Rockville, MD: Center for Mental Health Services and Center for Substance Abuse Treatment, Substance Abuse and Mental Health Services Administration, 2010. 3 Wier L.M., Levit K., Stranges E., Ryan K., Pfuntner A., Vandivort R., Santora P., Owens P., Stocks C., Elixhauser A. HCUP Facts and Figures: Statistics on Hospital-Based Care in the United States, 2008. Rockville, MD: Agency for Healthcare Research and Quality, 2010 (http://www.hcup-us.ahrq.gov/reports.jsp). 4 Difference due to rounding. 5 HCUP Cost-to-Charge Ratio Files (CCR). Healthcare Cost and Utilization Project (HCUP). 2001–2008. U.S. Agency for Healthcare Research and Quality, Rockville, MD. www.hcup-us.ahrq.gov/db/state/costtocharge.jsp. |