STATISTICAL BRIEF #108
|
|
April 2011
Elizabeth Stranges, MS, Niranjana Kowlessar, PhD, P. Hannah Davis, MS
Introduction In 2008, an estimated 15.4 percent of the U.S. population was uninsured.1 When there is no insurance coverage, hospitals bill patients directly. The resulting burden of payment for uninsured individuals and their families can be substantial, particularly during an economic downturn. Likewise, when these bills remain unpaid, the cost of uncompensated care represents a financial burden to hospitals and, ultimately, contributes to increases in healthcare costs to society overall. This Statistical Brief presents data from the Healthcare Cost and Utilization Project (HCUP) Nationwide Inpatient Sample (NIS) on uninsured hospital stays in 2008. In the NIS, uninsured hospitalizations include those for which the patient was billed directly as well as those for which the hospital did not charge the patient or insurer (referred to as "no charge"). Note that although all such stays are uninsured, not all of them are uncompensated, as patients charged directly by the hospital may pay the bill in part or total. In this Statistical Brief, characteristics of uninsured hospitalizations, such as utilization, cost, patient populations, and geographic locations are compared with the characteristics of insured hospital stays, that is, stays covered by Medicare, Medicaid, private health insurance and government programs such as Workers’ Compensation, TRICARE/CHAMPUS, CHAMPVA, and Title V. Changes in utilization by diagnosis and by procedure are compared in five year increments from 1998. All differences between estimates noted in the text are statistically significant at the 0.05 level or better. Findings In 2008, the uninsured accounted for 2.1 million inpatient hospitalizations, or 5.3 percent of all U.S. community hospital stays (table 1). Altogether, uninsured hospitalizations accounted for 4.3 percent of the aggregate costs of inpatient hospital care. Between 1998 and 2008, growth in the number of uninsured hospitalizations (20.8 percent) outpaced growth in insured hospitalizations (14.0 percent). As shown in table 1, uninsured hospitalizations were typically shorter in length and cost less than insured stays (3.8 days versus 4.7 days; average cost per stay of $7,300 versus $9,200). However, when patients age 65 or older were excluded from both groups, characteristics of uninsured and insured stays became less divergent. Because most patients age 65 and older are covered by Medicare, uninsured stays are predominantly for patients younger than 65. Even with the exclusion of older patients, uninsured stays remained shorter (3.7 days versus 4.1 days) and cost less (average cost per stay of $7,100 versus $8,100) than insured stays. |
|
Uninsured hospitalizations more frequently resulted in discharge against medical advice than did insured stays (3.4 percent versus 0.8 percent), and less frequently resulted in release to another institution or short term hospital (5.3 percent versus 15.3 percent) or a discharge to home healthcare (2.7 percent versus 10.3 percent).
Overall, hospitalized uninsured patients had fewer recorded chronic conditions than insured hospital patients (2.5 versus 3.5 chronic conditions per patient), a smaller portion were on mechanical ventilation (0.1 percent of uninsured, 0.2 percent of insured), and cases were not as severely ill (17.6 percent of uninsured cases had highest severity of illness, 26.8 percent of insured cases had highest severity of illness). When patients age 65 or older were excluded from each group, the percent of patients on mechanical ventilation (0.1 percent of uninsured, 0.3 percent of insured) was the only severity of illness measure for which there was a difference between the uninsured and insured patients. Table 2 shows that uninsured hospital patients were more likely to be male, more likely to be younger, and more likely to reside in poorer communities than were insured patients. More than half of uninsured hospitalizations were for men (51.9 percent); in contrast, men accounted for just 40.9 percent of insured hospitalizations. The mean age of uninsured hospital patients was 36.2 years, 13 years younger than the mean age of insured hospital patients (49.2 years). Focusing just on the non-elderly hospitalized population, nearly half of all uninsured patients (49.0 percent) were ages 18-44. More than one-third (36.2%) of uninsured stays were for patients residing in the poorest communities (lowest median income ZIP Codes), compared to 27.7% of insured stays. |
| Table 1. Characteristics of uninsured and insured hospital stays, 2008 | ||
| Uninsured stays | Insured stays | |
|---|---|---|
| Stays for all patients | ||
| align="left">Number of hospital stays (percentage of all stays) |
2,126,300 5.3% |
37,758,800 94.7% |
| Growth in number of stays, 1998–2008 (percentage growth) |
20.8% | 14.0% |
| Mean length of stay, days‡ | 3.8 | 4.7 |
| Hospital costs | ||
| Mean cost per stay, dollars‡ | $7,300 | $9,200 |
| Aggregate costs, billion dollars (percentage of all costs) |
$15.5 4.3% |
$348.6 95.7% |
| Discharge status‡ | ||
| Released to another institution or short term hospital | 5.3% | 15.3% |
| Left against medical advice | 3.4% | 0.8% |
| Discharged to home healthcare | 2.7% | 10.3% |
| Died in the hospital | 1.4% | 2.1% |
| Routine | 87.2% | 71.5% |
| Severity of illness measures | ||
| Patients with at least one therapeutic procedure | 19.4% | 22.0% |
| Patients on mechanical ventilation‡ | 0.1% | 0.2% |
| Number of chronic conditions (mean)‡ | 2.5 | 3.5 |
| Cases with highest severity of illness‡ | 17.6% | 26.8% |
| Stays for non-elderly patients* | ||
| Number of hospital stays | 2,040,400 | 23,838,700 |
| Mean length of stay, days, for non-elderly patients‡ | 3.7 | 4.1 |
| Hospital costs for non-elderly patients | ||
| Mean cost per stay, dollars‡ | $7,100 | $8,100 |
| Severity of illness measures for non-elderly patients | ||
| Patients with at least one therapeutic procedure | 19.1% | 20.8% |
| Patients on mechanical ventilation‡ | 0.1% | 0.3% |
| Number of chronic conditions (mean) | 2.4 | 2.4 |
| Cases with highest severity of illness | 16.8% | 17/% |
| ‡ Differences between uninsured stays and insured stays were statistically significant at p<0.05. *Statistics are presented for the non-elderly population because the majority of elderly patients (age 65+) qualify for Medicare coverage. Source: AHRQ, Center for Delivery, Organization, and Markets, Healthcare Cost and Utilization Project, Nationwide Inpatient Sample, 2008 | ||
| Table 2. Characteristics of patients with uninsured hospital stays and with insured hospital stays, 2008 | ||
| Uninsured stays | Insured stays | |
|---|---|---|
| Number of hospital stays | ||
| Number of hospital stays (percentage of all stays) |
2,126,300 | 37,758,800 |
| Sex‡ | ||
| Male | 51.9% | 40.9% |
| Female | 48.1% | 59.1% |
| Age characteristics | ||
| Mean patient age‡ | 36.2 | 49.2 |
| Age distribution‡ | ||
| <1 years | 12.4% | 12.4% |
| 1-17 years | 2.5% | 3.6% |
| 18-44 years | 47.1% | 23.9% |
| 45–64 years | 34.1% | 23.3% |
| 65+ years | 3.9% | 36.8% |
| Age distribution for non-elderly patients‡* | ||
| <1 years | 12.9% | 19.7% |
| 1-17 years | 2.6% | 5.6% |
| 18-44 years | 49.0% | 37.9% |
| 45.64 years | 35.5% | 36.8% |
| Median community-level income‡* | ||
| First quartile | 36.2% | 27.7% |
| Second quartile | 28.9% | 27.4% |
| Third quartile | 21.0% | 23.0% |
| Fourth quartile (wealthiest communities) | 13.9% | 21.9% |
| ‡ Differences between uninsured stays and insured stays were statistically significant at p<0.05. *Age distribution is presented for the non-elderly population because the majority of elderly patients (age 65+) qualify for Medicare coverage Source: AHRQ, Center for Delivery, Organization, and Markets, Healthcare Cost and Utilization Project, Nationwide Inpatient Sample, 2008 | ||
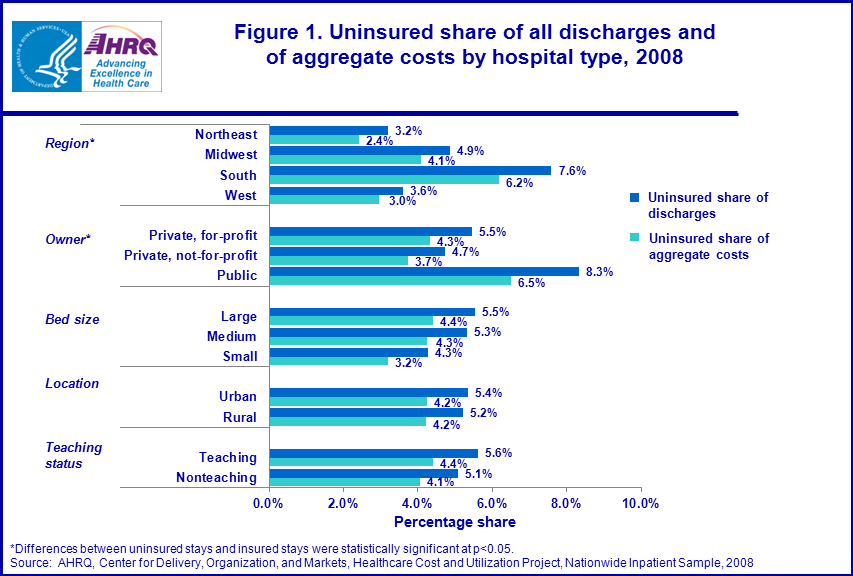
Uninsured hospitalizations and costs by hospital type, 2008
As shown in figure 1, the South had the largest percent of uninsured hospitalizations (7.6 percent), followed by the Midwest, where 4.9 percent of stays were uninsured. The uninsured made up smaller portions of all hospital stays in the West (3.6 percent) and the Northeast (3.2 percent). The share of costs attributable to uninsured stays followed similar regional patterns, with uninsured stays responsible for 6.2 percent of inpatient hospital costs in the South, 4.1 percent in the Midwest, 3.0 percent in the West, and 2.4 percent in the Northeast. |
|
Figure 1. Uninsured share of all discharges and of aggregate costs by hospital type, 2008. Bar chart, in percentages, by region, owner, bed size, location, and teaching status; Text following the asterisk reads as follows: "Differences between uninsured stays and insured stays were statistically significant at p<0.05." Region*; uninsured share of discharges; Northeast, 3.2%; Midwest, 4.9%; South, 7.6%; West, 3.6%. Region*; uninsured share of aggregate costs; Northeast, 2.4%; Midwest, 4.1%; South, 6.2%; West, 3.0%. Owner*; uninsured share of discharges; Private, for profit; 5.5%; Private, not-for-profit; 4.7%; Public; 8.3%. Owner *; uninsured share of aggregate costs; Private, for profit; 4.3%; Private, not-for-profit; 3.7%; Public; 6.5%. Bed size; uninsured share of discharges; large; 5.5%; medium; 5.3%; small; 4.3%. Bed size; uninsured share of aggregate costs; large; 4.4%; medium; 4.3%; small; 3.2%. Location; uninsured share of discharges; urban; 5.4%; rural; 5.2%. Location; uninsured share of aggregate costs; large; 5.2%; medium; 4.2%. Teaching status; uninsured share of discharges; teaching; 5.6%; nonteaching; 5.1%. Teaching status; uninsured share of aggregate costs; teaching; 4.4%; nonteaching; 4.1%. Source: AHRQ, Center for Delivery, Organization, and Markets, Healthcare Costs and Utilization Project, Nationwide Inpatient Sample, 2008
|
Across all publicly owned hospitals, uninsured hospital stays accounted for 8.3 percent of total stays—the largest share of uninsured hospitalizations for any ownership type. In private, for-profit hospitals, 5.5 percent of all stays were uninsured, and in private, not-for-profit hospitals, 4.7 percent of all stays were uninsured. Aggregate costs followed a similar pattern: uninsured stays accounted for 6.5 percent of public hospital costs, 4.3 percent of private, for-profit hospital costs, and 3.7 percent of private, not-for-profit hospital costs.
The share of uninsured discharges and the share of costs did not vary much among hospitals of different bed sizes, different locations (urban/rural) or different teaching statuses. Most common principal diagnoses associated with uninsured hospitalizations, 1998-2008 Table 3 shows the top reasons for uninsured hospital stays in 1998, 2003 and 2008, and growth in uninsured stays for these conditions. The number of uninsured hospital stays held steady during the first six-year period (-0.2 percent growth between 1998 and 2003), but grew appreciably during the latter year period (21.0 percent growth between 2003 and 2008). In 2008, newborns accounted for 11 percent of uninsured hospital stays. Three of the top ten reasons for uninsured stays were related to mental illness or substance use (mood disorders, alcohol-related disorders, and substance use disorders); and two of the top ten reasons were related to the cardiovascular system (nonspecific chest pain and acute myocardial infarction). |
| Table 3. Top 10 reasons for hospital stays among the uninsured, 1998, 2003, and 2008 | |||||
| Principal diagnosis | 1998 | 2003 | 2008 | Growth 1998-2003 | Growth 2003-2008 |
|---|---|---|---|---|---|
| All hospital stays | 34,874,000 | 38,220,700 | 39,885,100 | 9.6% | 4.4% |
| All uninsured hospital stays (percentage of stays) |
1,759,800 5.0% |
1,757,100 4.6% |
2,126,300 5.3% |
-0.2% | 21.0% |
| Liveborn | 201,900 11.5% |
191,900 109% |
240,400 11.3% |
-5.0% | 25.3% |
| Mood disorders | 64,600 3.7% |
69,110 3.9% |
79,300 3.7% |
7.0% | 14.7% |
| Nonspecific chest pain | 45,200 2.6% |
66,600 3.6% |
68,100 3.2% |
38.5% | 8.8% |
| Skin infections | 31,000 1.8% |
43,000 2.4% |
66,600 3.1% |
38.7% | 54.9% |
| Alcohol-related disorders | 35,100 3.1% |
45,000 2.6% |
66,700 2.9% |
-18.3% | 34.9% |
| Diabetes mellitus with complications | 33,400 1.9% |
37,100 2.1% |
51,900 2.4% |
11.1% | 39.9% |
| Pneumonia | 53,400 3.0% |
44,100 2.5% |
47,200 2.2% |
-17.4% | 7.0% |
| Substance-related disorders | 45,200 2.6% |
43,800 2.5% |
42,500 2.0% |
-3.1% | -3.0% |
| Biliary tract disease | 25,500 1.4% |
29,400 1.7% |
42,000 2.0% |
15.3% | 42.9% |
| Acute myocardial infarction | 29,800 1.7% |
33,800 1.9% |
40,400 1.9% |
13.4% | 19.5% |
| Source: AHRQ, Center for Delivery, Organization, and Markets, Healthcare Cost and Utilization Project, Nationwide Inpatient Sample, 1998, 2003 and 2008 | |||||
Despite no change in the overall number of uninsured stays from 1998 to 2003, stays for nonspecific chest pain and skin infections grew by 38.5 percent and 38.7 percent respectively. From 2003 to 2008, stays for skin infections grew by 54.9 percent, stays for biliary tract disease grew by 42.9 percent, and stays for diabetes mellitus with complications grew by 39.9 percent, outpacing overall increases in uninsured stays.
Most common principal procedures associated with uninsured hospitalizations, 1998-2008 Table 4 shows the top ten procedures for uninsured hospital stays in 1998, 2003, and 2008. Alcohol and drug rehabilitation/detoxification was the most frequent principal procedure among uninsured stays. Other common principal procedures performed during uninsured hospital stays included respiratory intubation and mechanical ventilation, childbirth-related procedures (cesarean section, circumcision, and repair of current obstretric laceration), and heart procedures (diagnostic cardiac catheterization and percutaneous coronary angioplasty (PTCA)). |
| Table 4. Top 10 principal procedures for hospital stays among the uninsured, 1998, 2003, and 2008 | |||||
| Principal diagnosis | 1998 | 2003 | 2008 | Growth 1998-2003 | Growth 2003-2008 |
|---|---|---|---|---|---|
| All hospital stays | 34,874,000 | 38,220,700 | 39,885,100 | 9.6% | 4.4% |
| All uninsured hospital stays (percentage of stays) |
1,759,800 5.0% |
1,757,100 4.6% |
2,126,300 5.3% |
-0.2% | 21.0% |
| Alcohol and drug rehabilitation/detoxification | 73,900 4.2% |
62,200 3.5% |
69,000 3.2% |
-15.8% | 10.9% |
| Respiratory intubation and mechanical ventilation | 28,500 1.6% |
31,300 1.8% |
45,800 2.2% |
9.8% | 46.3% |
| Upper gastrointestinal endoscopy, biopsy | 29,400 1.7% |
32,900 1.9% |
43,400 2.0% |
11.9% | 31.9% |
| Cesarean section | 23,300 1.3% |
31,200 1.8% |
42,100 2.0% |
33.9% | 34.9% |
| Circumcision | 42,400 2.4% |
37,600 2.1% |
41,800 2.0% |
-9.2% | 11.2% |
| Cholecystectomy and common duct exploration | 21,700 1.2% |
25,500 1.5% |
37,200 1.7% |
17.5% | 45.9% |
| Diagnostic cardiac catheterization, coronary arteriography | 26,000 1.5% |
25,500 1.5% |
36,600 1.7% |
25.0% | 12.6% |
| Percutaneous coronary angioplasty (PTCA) | 15,200 0.9% |
23,000 1.3% |
36,200 1.7% |
51.3% | 57.4% |
| Appendectomy | 28,600 1.6% |
32,100 1.8% |
35,100 1.7% |
12.2% | 9.3% |
| Repair of current obstetric laceration | 25,000 1.4% |
19,900 1.1% |
27,700 1.3% |
-20.4% | 39.2% |
| Source: AHRQ, Center for Delivery, Organization, and Markets, Healthcare Cost and Utilization Project, Nationwide Inpatient Sample, 1998, 2003 and 2008 | |||||
Between both 1998 and 2003, and 2003 and 2008, growth in the number of uninsured stays with a percutaneous coronary angioplasty (PTCA) procedure grew rapidly (51.3 percent and 57.4 percent growth in each period respectively). Cesarean section was the next procedure for which there was rapid growth during both periods (33.9 percent and 34.9 percent growth in each period respectively). A few procedures grew more rapidly during the latter period (2003-2008) than the earlier period: respiratory intubation and mechanical ventilation (46.3 percent growth between 2003 and 2008), cholecystectomy and common duct exploration (45.9 percent growth between 2003 and 2008), and repair of current obstetric laceration (39.2 percent growth between 2003 and 2008).
While alcohol and drug rehabilitation/detoxification remained the top procedure for uninsured hospital stays in the time-period spanning 1998 to 2008, use of this procedure grew at a slower rate than most other frequent procedures. Data Source The estimates in this Statistical Brief are based upon data from the 2008 HCUP Nationwide Inpatient Sample. Historical data were drawn from the 1998 and 2003 NIS. Definitions Diagnoses, ICD-9-CM, and Clinical Classifications Software (CCS) The principal diagnosis is that condition established after study to be chiefly responsible for the patient’s admission to the hospital. Secondary diagnoses are concomitant conditions that coexist at the time of admission or that develop during the stay. ICD-9-CM is the International Classification of Diseases, Ninth Revision, Clinical Modification, which assigns numeric codes to diagnoses. There are about 13,600 ICD-9-CM diagnosis codes. CCS categorizes ICD-9-CM diagnoses into a manageable number of clinically meaningful categories. This "clinical grouper" makes it easier to quickly understand patterns of diagnoses and procedures. Types of hospitals included in HCUP HCUP is based on data from community hospitals, defined as short-term, non-Federal, general and other hospitals, excluding hospital units of other institutions (e.g., prisons). HCUP includes data from OB-GYN, ENT, orthopedic, cancer, pediatric, public, and academic medical hospitals. Excluded are long-term care, rehabilitation, psychiatric, and alcoholism and chemical dependency hospitals. However, if a patient received long-term care, rehabilitation, or treatment for psychiatric or chemical dependency conditions in a community hospital, the discharge record for that stay will be included in the NIS. Unit of analysis The unit of analysis is the hospital discharge (i.e., the hospital stay), not a person or patient. This means that a person who is admitted to the hospital multiple times in one year will be counted each time as a separate "discharge" from the hospital. Costs and charges Total hospital charges were converted to costs using HCUP cost-to-charge ratios based on hospital accounting reports from the Centers for Medicare and Medicaid Services (CMS).2 Costs will reflect the actual expenses incurred in the production of hospital services, such as wages, supplies and utility costs, while charges represent the amount a hospital billed for the case. For each hospital, a hospital-wide cost-to-charge ratio is used. Hospital charges reflect the amount the hospital billed for the entire hospital stay and do not include professional (physician) fees. For the purposes of this Statistical Brief, costs are reported to the nearest hundreds. Hospital location The classification of whether a hospital is in a metropolitan area ("urban") or non-metropolitan area ("rural"), is defined from the American Hospital Association (AHA) Annual Survey using the 1993 U.S. Office of Management and Budget definition. Median community-level income Median community-level income is the median household income of the patient’s ZIP Code of residence. The cut-offs for the quartile designation are determined using ZIP Code demographic data obtained from Claritas. The income quartile is missing for homeless and foreign patients. Payer Payer is the expected primary payer for the hospital stay. To make coding uniform across all HCUP data sources, payer combines detailed categories into more general groups:
Region Region is one of the four regions defined by the U.S. Census Bureau:
Discharge status indicates the disposition of the patient at discharge from the hospital, and includes the following six categories: routine (to home), transfer to another short-term hospital, other transfers (including skilled nursing facility, intermediate care, and another type of facility such as a nursing home), home healthcare, against medical advice (AMA), or died in the hospital. Patient complexity Cases with the highest severity of illness are discharges with a score of 3 or 4 on the APR-DRG severity of illness scale. The four severity of illness subclasses are numbered sequentially from 1 to 4 indicating minor, moderate, major, or extreme severity of illness. The determination of severity of illness is disease-specific. Thus, the significance attributed to complicating or comorbid conditions is dependent on the underlying problem. For example, certain types of infections are considered a more significant problem in a patient who is immunosuppressed than in a patient with a fractured arm. In APR-DRGs, high severity of illness is primarily determined by the interaction of multiple diseases. Patients with multiple comorbid conditions involving multiple organ systems represent difficult-to-treat patients who tend to have poor outcomes. The assignment of a patient to a severity of illness subclass takes into consideration not only the level of the secondary diagnoses but also the interaction among secondary diagnoses, age, principal diagnosis, and the presence of certain OR procedures and non-OR procedures. Percentage with at least one major therapeutic procedure: All procedures were determined to be major (i.e., requiring an operating room) or minor and therapeutic or diagnostic based on the Procedure Classes which can be found at: http://www.hcup-us.ahrq.gov/toolssoftware/procedure/procedure.jsp. Percentage on mechanical ventilation was calculated as the percentage of patients in the hospital who have ICD-9-CM procedure codes 96.70–96.72 Mean number of chronic conditions per patient: All diagnoses on all records were determined to be either chronic or non-chronic. The definition of chronic conditions was based on the Chronic Condition Indicator which can be found at: http://www.hcup-us.ahrq.gov/toolssoftware/chronic/chronic.jsp. About HCUP ——HCUP is a family of powerful healthcare databases, software tools, and products for advancing research. Sponsored by the Agency for Healthcare Research and Quality (AHRQ), HCUP includes the largest all-payer encounter-level collection of longitudinal healthcare data (inpatient, ambulatory surgery, and emergency department) in the United States, beginning in 1988. HCUP is a Federal-State-Industry Partnership that brings together the data collection efforts of many organizations—such as State data organizations, hospital associations, private data organizations, and the Federal government—to create a national information resource. HCUP would not be possible without the contributions of the following data collection Partners from across the United States: Arizona Department of Health Services Arkansas Department of Health California Office of Statewide Health Planning and Development Colorado Hospital Association Connecticut Hospital Association Florida Agency for Health Care Administration Georgia Hospital Association Hawaii Health Information Corporation Illinois Department of Public Health Indiana Hospital Association Iowa Hospital Association Kansas Hospital Association Kentucky Cabinet for Health and Family Services Louisiana Department of Health and Hospitals Maine Health Data Organization Maryland Health Services Cost Review Commission Massachusetts Division of Health Care Finance and Policy Michigan Health & Hospital Association Minnesota Hospital Association Missouri Hospital Industry Data Institute Montana MHA — An Association of Montana Health Care Providers Nebraska Hospital Association Nevada Department of Health and Human Services New Hampshire Department of Health & Human Services New Jersey Department of Health and Senior Services New Mexico Health Policy Commission New York State Department of Health North Carolina Department of Health and Human Services Ohio Hospital Association Oklahoma State Department of Health Oregon Association of Hospitals and Health Systems Pennsylvania Health Care Cost Containment Council Rhode Island Department of Health South Carolina State Budget & Control Board South Dakota Association of Healthcare Organizations Tennessee Hospital Association Texas Department of State Health Services Utah Department of Health Vermont Association of Hospitals and Health Systems Virginia Health Information Washington State Department of Health West Virginia Health Care Authority Wisconsin Department of Health Services Wyoming Hospital Association About the NIS The HCUP Nationwide Inpatient Sample (NIS) is a nationwide database of hospital inpatient stays. The NIS is nationally representative of all community hospitals (i.e., short-term, non-Federal, non-rehabilitation hospitals). The NIS is a sample of hospitals and includes all patients from each hospital, regardless of payer. It is drawn from a sampling frame that contains hospitals comprising about 95 percent of all discharges in the United States. The vast size of the NIS allows the study of topics at both the national and regional levels for specific subgroups of patients. In addition, NIS data are standardized across years to facilitate ease of use. For More Information For more information about HCUP, visit http://www.hcup-us.ahrq.gov. For additional HCUP statistics, visit HCUPnet, our interactive query system, at www.hcup.ahrq.gov. For information on other hospitalizations in the U.S., download HCUP Facts and Figures: Statistics on Hospital-based Care in the United States in 2008, located at http://www.hcup-us.ahrq.gov/reports.jsp. For a detailed description of HCUP, more information on the design of the NIS, and methods to calculate estimates, please refer to the following publications: Steiner, C., Elixhauser, A., Schnaier, J. The Healthcare Cost and Utilization Project: An Overview. Effective Clinical Practice 5(3):143–51, 2002. Introduction to the HCUP Nationwide Inpatient Sample, 2008. Online. May 2010. U.S. Agency for Healthcare Research and Quality. http://hcup-us.ahrq.gov/db/nation/nis/NIS_2008_INTRODUCTION.pdf. Houchens, R., Elixhauser, A. Final Report on Calculating Nationwide Inpatient Sample (NIS) Variances, 2001. HCUP Methods Series Report #2003-2. Online. June 2005 (revised June 6, 2005). U.S. Agency for Healthcare Research and Quality. http://www.hcup-us.ahrq.gov/reports/methods/2003_02.pdf. Houchens R.L., Elixhauser A. Using the HCUP Nationwide Inpatient Sample to Estimate Trends. (Updated for 1988-2004). HCUP Methods Series Report #2006-05 Online. August 18, 2006. U.S. Agency for Healthcare Research and Quality. http://www.hcup-us.ahrq.gov/reports/methods/2006_05_NISTrendsReport_1988-2004.pdf Suggested Citation Stranges, E. (Thomson Reuters), Kowlessar, N. (Thomson Reuters) and Davis, P.H. (Agency for Healthcare Research and Quality). Uninsured Hospitalizations, 2008. HCUP Statistical Brief #108. April 2011. Agency for Healthcare Research and Quality, Rockville, MD. http://www.hcup-us.ahrq.gov/reports/statbriefs/sb108.pdf. Acknowledgments The authors would like to acknowledge Jayna Dickens for her assistance on this Brief. *** AHRQ welcomes questions and comments from readers of this publication who are interested in obtaining more information about access, cost, use, financing, and quality of healthcare in the United States. We also invite you to tell us how you are using this Statistical Brief and other HCUP data and tools, and to share suggestions on how HCUP products might be enhanced to further meet your needs. Please e-mail us at hcup@ahrq.gov or send a letter to the address below:Irene Fraser, Ph.D., Director Center for Delivery, Organization, and Markets Agency for Healthcare Research and Quality 540 Gaither Road Rockville, MD 20850 1 Chu, M.C. and Rhoades, J.A. The Uninsured in America, 1996-2009: Estimates for the U.S. Civilian Noninstitutionalized Population under Age 65. Statistical Brief #290. August 2010. Agency for Healthcare Research and Quality, Rockville, MD. http://www.meps.ahrq.gov/mepsweb/data_files/publications/st290/stat290.pdf (March 7, 2011). 2 HCUP Cost-to-Charge Ratio Files (CCR). Healthcare Cost and Utilization Project (HCUP). 2001–2008. U.S. Agency for Healthcare Research and Quality, Rockville, MD. www.hcup-us.ahrq.gov/db/state/costtocharge.jsp. |
| Internet Citation: Statistical Brief #108. Healthcare Cost and Utilization Project (HCUP). April 2011. Agency for Healthcare Research and Quality, Rockville, MD. hcup-us.ahrq.gov/reports/statbriefs/sb108.jsp. |
| Are you having problems viewing or printing pages on this website? |
| If you have comments, suggestions, and/or questions, please contact hcup@ahrq.gov. |
| If you are experiencing issues related to Section 508 accessibility of information on this website, please contact hcup@ahrq.gov. |
| Privacy Notice, Viewers & Players |
| Last modified 4/1/11 |