STATISTICAL BRIEF #102
|
|
December 2010
Lauren M. Wier, M.P.H., Eva Witt, B.A., Jackie Burgess, M.B.A, and Anne Elixhauser, Ph.D.
Introduction Diabetes is a growing public health concern in the United States. Poorly controlled diabetes can cause severe complications including blindness, kidney damage, cardiovascular disease, and lower-limb amputations. Pre-existing diabetes (type 1 and type 2) and gestational diabetes (defined as glucose intolerance with onset or first recognition during pregnancy among women without diabetes) are associated with increased risk of serious health complications for both the mother and infant.1 For instance, a maternal diagnosis of gestational diabetes is associated with high rates of complicated births and intensive care utilization, as well as hypoglycemia, jaundice, and macrosomia (large body size) in newborns.2 Pre-existing diabetes in pregnancy is further associated with preterm (early) birth and higher risk of miscarriage.3 This Statistical Brief presents data from the Healthcare Cost and Utilization Project (HCUP) on hospitalizations related to diabetes in pregnancy in 2008. Specifically, utilization, cost of hospital care, and patient characteristics of maternal hospitalizations with pre-existing diabetes complicating pregnancy and gestational diabetes are compared with maternal hospitalizations without diabetes by visit type (delivery or non-delivery). Additionally, this report provides information about the types of procedures commonly performed during these stays with deliveries. All differences between estimates noted in the text are statistically significant at the 0.05 level or better. Findings There were about 4.7 million maternal discharges in 2008. As shown in table 1, diabetes-related maternal stays—those involving delivery as well as pregnancy complications—accounted for about 6.5 percent of all maternal stays (307,400 discharges)—5.4 percent of all maternal stays were for gestational diabetes and 1.1 percent were for pre-existing diabetes complicating pregnancy.
|
| ||||||||||||||||||||||||||||||||||
Roughly 9 out 10 maternal discharges without diabetes (89.7 percent) and with gestational diabetes (91.6 percent) involved the birth of an infant. In contrast, for women with pre-existing diabetes, only 66.1 percent gave birth during the stay—one out of three maternal hospitalizations involving pre-existing diabetes (33.9 percent) were for treatment of complications with no delivery.
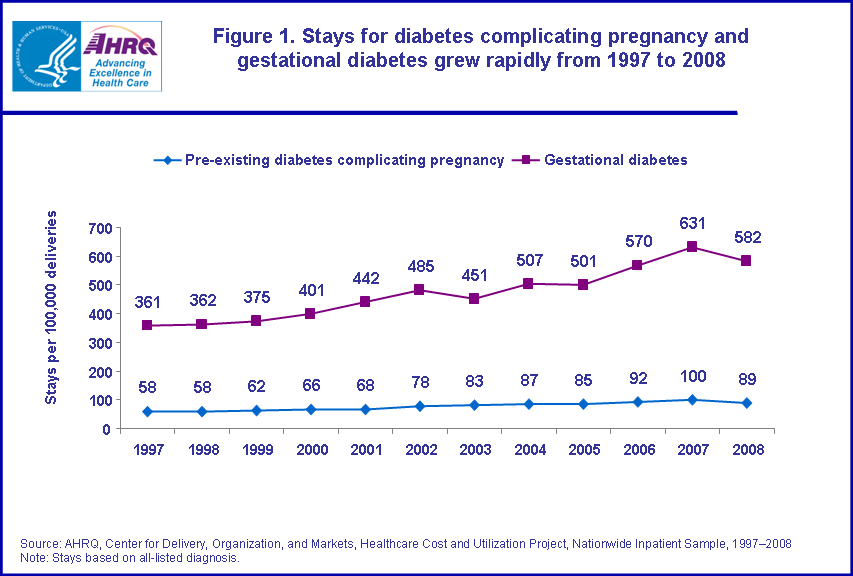
The C-section rate for women with pre-existing diabetes complicating pregnancy was more than twice as high as for women without diabetes—63.9 percent compared to 31.7 percent. The C-section rate for women with gestational diabetes was also higher than for women without diabetes—45.6 percent. From 1997 to 2007, the number of stays for all deliveries increased about 14 percent. In contrast, as shown in figure 1, the rate of hospital stays for gestational diabetes grew 75 percent (from 361 to 631 stays per 100,000 deliveries) and hospitalizations for pre-existing diabetes complicating pregnancy grew 72 percent (from 58 to 100 stays per 100,000 deliveries). In the one year interval from 2007 to 2008, the number of stays for all deliveries remained relatively stable and there was a slight, but not statistically significant, decline in stays for gestational diabetes and pre-existing diabetes complicating pregnancy. |
|
Figure 1. Stays for diabetes complicating pregnancy and gestational diabetes grew rapidly from 1997 to 2008. Trend line chart; Stays per 100,000 deliveries, pre-existing diabetes complicating pregnancy in 1997, 58; in 1998, 58; in 1999, 62; in 2000, 66; in 2001, 68; in 2002, 78; in 2003, 83; in 2004, 87; in 2005, 85; in 2006, 92; in 2007, 100; in 2008, 89. Stays per 100,000 deliveries, gestational diabetes in 1997, 361; in 1998, 362, in 1999, 375, in 2000, 401; in 2001, 442; in 2002, 485; in 2003, 451; in 2004, 507; in 2005, 501; in 2006, 570; in 2007, 631; in 2008, 582. Source: AHRQ, Center for Delivery, Organization, and Markets, Healthcare Cost and Utilization Project, Nationwide Inpatient Sample, 1997-2008. Note: Stays based on all-listed diagnosis.
|
Utilization characteristics for diabetes and pregnancy, without delivery Table 2 focuses on hospitalizations without delivery. There were 18,200 hospital stays with pre-existing diabetes complicating pregnancy and 21,400 stays with gestational diabetes and no delivery.4 There were 452,500 non-delivery maternal hospitalizations without diabetes. |
| Table 2. Characteristics of hospital stays associated with diabetes and pregnancy, without delivery, 2008 | |||
| Pre-existing diabetes complicating pregnancy | Gestational diabetes | Pregnancy-related stays without diabetes | |
|---|---|---|---|
| Total number of discharges | 18,200 | 21,400 | 452,500 |
| Mean length of stay, days | 3.9 | 4.3 | 2.8 |
| Mean hospital costs | $4,300* | $4,000* | $4,100 |
| Aggregate costs | $78,500,000 | $86,400,000 | $1,872,900,000 |
| Discharge against medical advice | 4.0% | 2.3% | 1.5% |
| Source: AHRQ, Center for Delivery, Organization, and Markets, Healthcare Cost and Utilization Project, Nationwide Inpatient Sample, 2008 Note: Counts of hospital stays based on all-listed diagnoses. * Not statistically different from pregnancy-related stays without diabetes at p<0.05. | |||
The mean length of hospitalizations with pre-existing diabetes and gestational diabetes was longer than the average without diabetes (3.9 and 4.3 days versus 2.8 days, respectively). Despite differences in length of stay, costs of hospitalization were the same across these three groups—all cost roughly $4,000 per stay regardless of diabetes status. Aggregate costs for non-delivery maternal hospitalizations for pre-existing diabetes were $78 million and for gestational diabetes aggregate costs were $86 million, compared to $1.8 billion for non-diabetes maternal hospitalizations without delivery. Discharge against medical advice was more common among stays with pre-existing diabetes complicating pregnancy (4.0 percent) and gestational diabetes (2.3 percent) compared to stays without diabetes (1.5%). Utilization characteristics for diabetes and pregnancy, deliveries only Table 3 focuses on deliveries and shows that there were 35,500 deliveries among women with pre-existing diabetes complicating pregnancy and 232,300 deliveries for women with gestational diabetes.5 There were more than 3.9 million hospitalizations for deliveries without diabetes. |
| Table 3. Characteristics of hospital stays associated with diabetes and pregnancy, deliveries only, 2008 | |||
| Pre-existing diabetes complicating pregnancy | Gestational diabetes | All deliveries without diabetes | |
|---|---|---|---|
| Total number of discharges | 35,500 | 232,300 | 3,942,100 |
| Mean length of stay, days | 4.2 | 3.2 | 2.6 |
| Mean hospital costs | $5,900 | $4,500 | $3,800 |
| Aggregate costs | $210,972,000 | $1,045,400,000 | $14,804,800,000 |
| Discharge to home | 80.4%* | 74.8% | 79.5% |
| Discharge against medical advice | 0.2% | 0.1% | 0.0% |
| Source: AHRQ, Center for Delivery, Organization, and Markets, Healthcare Cost and Utilization Project, Nationwide Inpatient Sample, 2008 Note: Counts of hospital stays based on all-listed diagnoses. * Not statistically different from all deliveries without diabetes at p<0.05. | |||
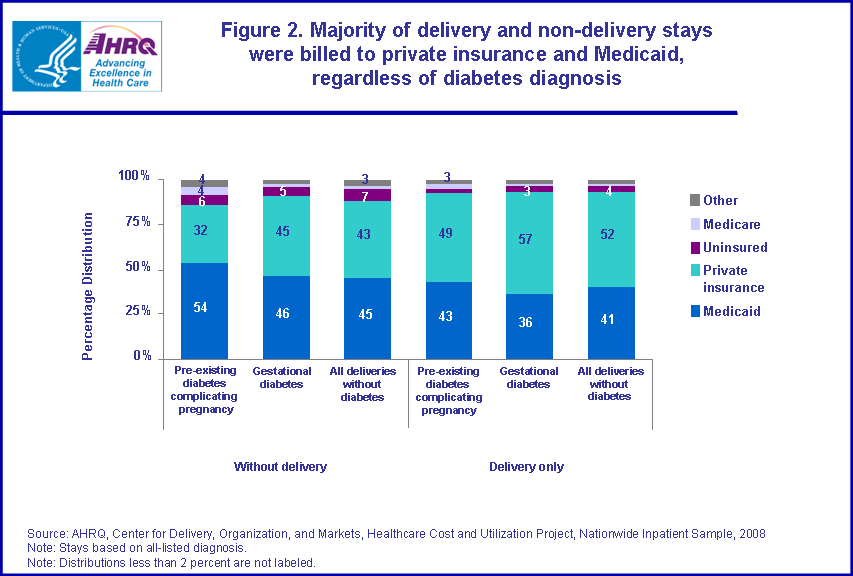
The mean length of hospitalization for delivery stays with pre-existing diabetes complicating pregnancy and gestational diabetes was longer than the average stay without diabetes (4.2 and 3.2 days versus 2.6 days, respectively). The average cost of a delivery hospitalization without diabetes was $3,800. Deliveries with pre-existing diabetes complicating pregnancy cost 55 percent more per stay ($5,900) and those with gestational diabetes cost 18 percent more ($4,500). Aggregate costs for delivery-related hospitalizations for pre-existing diabetes complicating pregnancy were $211 million and for gestational diabetes aggregate costs were over $1 billion, compared to nearly $15 billion for non-diabetes deliveries. Total costs of hospitalization for all diabetes in pregnancy (including deliveries and non-delivery stays) was over $1.4 billion, or 7.8 percent of all maternal hospitalization costs. Discharge against medical advice was uncommon among all deliveries, but was slightly more frequent among delivery stays with pre-existing diabetes complicating pregnancy (0.2 percent) and gestational diabetes (0.1 percent) than among delivery stays without diabetes. Hospitalizations related to diabetes in pregnancy, by primary payer Figure 2 shows that more than half (54 percent) of non-delivery maternal stays with pre-existing diabetes complicating pregnancy were billed to Medicaid, while 32 percent were billed to private insurance and 6 percent to uninsured individuals. Relative to non-delivery stays with pre-existing diabetes complicating pregnancy, hospitalizations with gestational diabetes and those without diabetes were billed more frequently to private insurance (43–45 percent) and billed less frequently to Medicaid (45–46 percent). Among delivery stays, a larger proportion of hospitalizations with gestational diabetes (57 percent) was billed to private insurance compared to delivery stays with pre-existing diabetes complicating pregnancy (49 percent) and without diabetes (52 percent). |
|
Figure 2. Majority of delivery and non-delivery stays were billed to private insurance and Medicaid, regardless of diabetes diagnosis. Stacked bar chart; Percentage distribution; Without delivery; pre-existing diabetes complicating pregnancy; Medicaid 54%; private insurance, 32%; uninsured, 6%; Medicare, 4%; Other, 4%. Without delivery; gestational diabetes; Medicaid 46%; private insurance, 45%; uninsured, 5%; Medicare, 2%; Other, 2%. Without delivery; all deliveries without diabetes; Medicaid 45%; private insurance, 43%; uninsured, 7%; Medicare, 2%; Other, 3%. Delivery only; pre-existing diabetes complicating pregnancy; Medicaid 43%; private insurance, 49%; uninsured, 3%; Medicare, 2%; Other, 3%. Delivery only; gestational diabetes; Medicaid 36%; private insurance, 57%; uninsured, 3%; Medicare, 1%; Other, 2%. Delivery only; all deliveries without diabetes; Medicaid 41%; private insurance, 52%; uninsured, 4%; Medicare, 1%; Other, 3%. Source: AHRQ, Center for Delivery, Organization, and Markets, Healthcare Cost and Utilization Project, Nationwide Inpatient Sample, 1997-2008. Note: Stays based on all-listed diagnosis. Note: Distributions less than 2 percent are not labeled.
|
Procedures associated with hospitalizations related to diabetes in pregnancy, deliveries only Table 4 shows that C-section was the most frequently performed procedure during stays with pre-existing diabetes complicating pregnancy and gestational diabetes. Compared to maternal delivery stays without diabetes, C-section was twice as likely to be performed for women with pre-existing diabetes complicating pregnancy (63.9 percent of stays) and about 1.4 times more likely to be performed for women with gestational diabetes (45.6 percent of stays). |
| Table 4. Most frequent all-listed procedures associated with diabetes and pregnancy, deliveries only, 2008 | ||||||
| Pre-existing diabetes complicating pregnancy | Gestational diabetes | All deliveries without diabetes | ||||
|---|---|---|---|---|---|---|
| Discharges (%) | Rank | Discharges (%) | Rank | Discharges (%) | Rank | |
| Total number of discharges | 35,500 (100.0%) | - | 232,300 (100.0%) | - | 3,942,100 (100.0%) | - |
| Cesarean section | 22,700 (63.9%) | 1 | 106,000 (45.6%) | 1 | 1,247,900 (31.7%) | 2 |
| Repair of obstetric laceration | 5,900 (16.6%) | 5 | 61,900 (26.7%) | 2 | 1,298,700 (32.9%) | 1 |
| Fetal monitoring | 7,400 (20.9%*) | 2 | 51,800 (22.3%*) | 3 | 851,300 (21.6%) | 4 |
| Artificial rupture of membranes to assist delivery | 5,900 (16.7%) | 4 | 50,300 (21.6%) | 4 | 942,200 (23.9%) | 5 |
| Ligation or occlusion of fallopian tubes | 6,800 (19.1%) | 3 | 29,500 (12.7%) | 5 | 29,500 (12.7%) | 6 |
| Episiotomy | 1,300 (3.6%) | 6 | 14,900 (6.4%) | 6 | 331,700 (8.4%) | 5 |
| Source: AHRQ, Center for Delivery, Organization, and Markets, Healthcare Cost and Utilization Project, Nationwide Inpatient Sample, 2008 Note: Counts of hospital stays based on all-listed diagnoses. * Not statistically different from all deliveries without diabetes at p<0.05. | ||||||
Repair of obstetric laceration, which ranked first among stays without diabetes (32.9 percent of stays), was the second most common procedure for gestational diabetes stays (26.7 percent of stays) and the fifth most common procedure for pre-existing diabetes complicating pregnancy stays (16.6 percent of stays). Artificial rupture of membranes to assist delivery and episiotomy were also less commonly performed for women with pre-existing diabetes complicating pregnancy and gestational diabetes, probably a function of the higher C-section rate. Ligation or occlusion of fallopian tubes was more commonly performed during stays with pre-existing diabetes complicating pregnancy (19.1 percent of stays) and gestational diabetes (12.7 percent of stays) than during stays without diabetes (6.8 percent of stays). There were no differences in fetal monitoring across the three groups. Data Source The estimates in this Statistical Brief are based upon data from the HCUP 2008 Nationwide Inpatient Sample (NIS). Historical data were drawn from the 1997, 1998, 1999, 2000, 2001, 2002, 2003, 2004, 2005, 2006, and 2007 NIS. Definitions Diagnoses, ICD-9-CM, and Clinical Classifications Software (CCS), and Diagnosis-Related Groups (DRGs) The principal diagnosis is that condition established after study to be chiefly responsible for the patient’s admission to the hospital. Secondary diagnoses are concomitant conditions that coexist at the time of admission or that develop during the stay. All-listed diagnoses include the principal diagnosis plus these additional secondary conditions. ICD-9-CM is the International Classification of Diseases, Ninth Revision, Clinical Modification, which assigns numeric codes to diagnoses. There are about 13,600 ICD-9-CM diagnosis codes. CCS categorizes ICD-9-CM diagnoses into a manageable number of clinically meaningful categories.6 This "clinical grouper" makes it easier to quickly understand patterns of diagnoses and procedures. DRGs comprise a patient classification system that categorizes patients into groups that are clinically coherent and homogeneous with respect to resource use. DRGs group patients according to diagnosis, type of treatment (procedures), age, and other relevant criteria. Each hospital stay has one DRG assigned to it. Case definition For this report, non-delivery maternal stays were identified as having an all-listed ICD-9-CM diagnosis code in the following range: 630–679. Delivery stays were identified as having a DRG code 765–768 (vaginal delivery) or 774–775 (C-section). Pre-existing diabetes complicating pregnancy was defined as an all-listed ICD-9-CM diagnosis code (648.0x). Gestational diabetes was defined as an all-listed ICD-9 CM diagnosis code (648.8x). For the few cases that listed both codes, cases were counted as diabetes complicating pregnancy. Types of hospitals included in HCUP HCUP is based on data from community hospitals, defined as short-term, non-Federal, general and other hospitals, excluding hospital units of other institutions (e.g., prisons). HCUP data include OB-GYN, ENT, orthopedic, cancer, pediatric, public, and academic medical hospitals. Excluded are long-term care, rehabilitation, psychiatric, and alcoholism and chemical dependency hospitals, but these types of discharges are included if they are from community hospitals. Unit of analysis The unit of analysis is the hospital discharge (i.e., the hospital stay), not a person or patient. This means that a person who is admitted to the hospital multiple times in one year will be counted each time as a separate "discharge" from the hospital. Costs and charges Total hospital charges were converted to costs using HCUP Cost-to-Charge Ratios based on hospital accounting reports from the Centers for Medicare and Medicaid Services (CMS).7 Costs will tend to reflect the actual costs of production, while charges represent what the hospital billed for the case. For each hospital, a hospital-wide cost-to-charge ratio is used because detailed charges are not available across all HCUP States. Hospital charges reflect the amount the hospital charged for the entire hospital stay and does not include professional (physician) fees. Payer Payer is the expected primary payer for the hospital stay. To make coding uniform across all HCUP data sources, payer combines detailed categories into more general groups:
Discharge status Discharge status indicates the disposition of the patient at discharge from the hospital, and includes the following six categories: routine (to home), transfer to another short-term hospital, other transfers (including skilled nursing facility, intermediate care, and another type of facility such as a nursing home), home healthcare, against medical advice (AMA), or died in the hospital. About HCUP HCUP is a family of powerful healthcare databases, software tools, and products for advancing research. Sponsored by the Agency for Healthcare Research and Quality (AHRQ), HCUP includes the largest all-payer encounter-level collection of longitudinal healthcare data (inpatient, ambulatory surgery, and emergency department) in the United States, beginning in 1988. HCUP is a Federal-State-Industry Partnership that brings together the data collection efforts of many organizations-such as State data organizations, hospital associations, private data organizations, and the Federal government-to create a national information resource. HCUP would not be possible without the contributions of the following data collection Partners from across the United States: Arizona Department of Health Services Arkansas Department of Health California Office of Statewide Health Planning and Development Colorado Hospital Association Connecticut Hospital Association Florida Agency for Health Care Administration Georgia Hospital Association Hawaii Health Information Corporation Illinois Department of Public Health Indiana Hospital Association Iowa Hospital Association Kansas Hospital Association Kentucky Cabinet for Health and Family Services Louisiana Department of Health and Hospitals Maine Health Data Organization Maryland Health Services Cost Review Commission Massachusetts Division of Health Care Finance and Policy Michigan Health & Hospital Association Minnesota Hospital Association Missouri Hospital Industry Data Institute Montana MHA — An Association of Montana Health Care Providers Nebraska Hospital Association Nevada Department of Health and Human Services New Hampshire Department of Health & Human Services New Jersey Department of Health and Senior Services New Mexico Health Policy Commission New York State Department of Health North Carolina Department of Health and Human Services Ohio Hospital Association Oklahoma State Department of Health Oregon Association of Hospitals and Health Systems Pennsylvania Health Care Cost Containment Council Rhode Island Department of Health South Carolina State Budget & Control Board South Dakota Association of Healthcare Organizations Tennessee Hospital Association Texas Department of State Health Services Utah Department of Health Vermont Association of Hospitals and Health Systems Virginia Health Information Washington State Department of Health West Virginia Health Care Authority Wisconsin Department of Health Services Wyoming Hospital Association About the NIS The HCUP Nationwide Inpatient Sample (NIS) is a nationwide database of hospital inpatient stays. The NIS is nationally representative of all community hospitals (i.e., short-term, non-Federal, non-rehabilitation hospitals). The NIS is a sample of hospitals and includes all patients from each hospital, regardless of payer. It is drawn from a sampling frame that contains hospitals comprising about 95 percent of all discharges in the United States. The vast size of the NIS allows the study of topics at both the national and regional levels for specific subgroups of patients. In addition, NIS data are standardized across years to facilitate ease of use. For More Information For more information about HCUP, visit http://www.hcup-us.ahrq.gov. For additional HCUP statistics, visit HCUPnet, our interactive query system, at www.hcup.ahrq.gov. For information on other hospitalizations in the U.S., download HCUP Facts and Figures: Statistics on Hospital-based Care in the United States in 2008, located at http://www.hcup-us.ahrq.gov/reports.jsp. For a detailed description of HCUP, more information on the design of the NIS, and methods to calculate estimates, please refer to the following publications: Steiner, C., Elixhauser, A., Schnaier, J.The Healthcare Cost and Utilization Project: An Overview. Effective Clinical Practice 5(3):143–51, 2002. Introduction to the HCUP Nationwide Inpatient Sample, 2008. Online. May, 2010. U.S. Agency for Healthcare Research and Quality. http://hcup-us.ahrq.gov/db/nation/nis/NIS_2008_INTRODUCTION.pdf. Houchens, R., Elixhauser, A. Final Report on Calculating Nationwide Inpatient Sample (NIS) Variances, 2001. HCUP Methods Series Report #2003-2. Online. June 2005 (revised June 6, 2005). U.S. Agency for Healthcare Research and Quality. http://www.hcup-us.ahrq.gov/reports/methods/2003_02.pdf. Houchens RL, Elixhauser A. Using the HCUP Nationwide Inpatient Sample to Estimate Trends. (Updated for 1988-2004). HCUP Methods Series Report #2006-05 Online. August 18, 2006. U.S. Agency for Healthcare Research and Quality. http://www.hcup-us.ahrq.gov/reports/methods/2006_05_NISTrendsReport_1988-2004.pdf Suggested Citation Wier, L.M. (Thomson Reuters), Witt, E. (Thomson Reuters), Burgess, J. (Thomson Reuters), and Elixhauser A. (AHRQ). Hospitalizations Related to Diabetes in Pregnancy, 2008. HCUP Statistical Brief #102. December 2010. Agency for Healthcare Research and Quality, Rockville, MD. http://www.hcup-us.ahrq.gov/reports/statbriefs/sb102.pdf. Acknowledgments The authors would like to acknowledge the contribution of Bong-Chul Chu (Thomson Reuters) and Minya Sheng (Thomson Reuters) for programming support, and Taressa Fraze (Thomson Reuters) for editorial review. *** AHRQ welcomes questions and comments from readers of this publication who are interested in obtaining more information about access, cost, use, financing, and quality of healthcare in the United States. We also invite you to tell us how you are using this Statistical Brief and other HCUP data and tools, and to share suggestions on how HCUP products might be enhanced to further meet your needs. Please e-mail us at hcup@ahrq.gov or send a letter to the address below:Irene Fraser, Ph.D., Director Center for Delivery, Organization, and Markets Agency for Healthcare Research and Quality 540 Gaither Road Rockville, MD 20850 1 American Diabetes Association. Diagnosis and classification of diabetes mellitus. Diabetes Care 30 Suppl 1:S42-S47, 2007. 2 National Institutes of Health, Eunice Kennedy Shriver National Institute of Child Health and Human Development, Gestational Diabetes. Original source is no longer available on the Web; for related information refer to National Institute of Diabetes and Digestive and Kidney Diseases's, Definition and Facts of Gestational Diabetes, https://www.niddk.nih.gov/health-information/diabetes/overview/what-is-diabetes/gestational/definition-facts (Accessed on April 18, 2018). 3 Type1 or Type 2 Diabetes and Pregnancy. http://www.cdc.gov/pregnancy/diabetes-types.html (Accessed on December 09, 2010). 4 These counts may include multiple hospitalizations by the same individuals, which is common among patients with diabetes. 5 These counts may include multiple hospitalizations by the same individuals, which is common among patients with diabetes. 6 HCUP CCS. Healthcare Cost and Utilization Project (HCUP). December 2009. U.S. Agency for Healthcare Research and Quality, Rockville, MD. www.hcup-us.ahrq.gov/toolssoftware/ccs/ccs.jsp 7 HCUP Cost-to-Charge Ratio Files (CCR). Healthcare Cost and Utilization Project (HCUP). 2001–2008. U.S. Agency for Healthcare Research and Quality, Rockville, MD. www.hcup-us.ahrq.gov/db/state/costtocharge.jsp. |