
January 31, 2011
Prepared by:
Carrie Hanlon, MA, Jill Rosenthal, MPH, and Larry Hinkle
Contact Information:
Healthcare Cost and Utilization Project (HCUP)
Agency for Healthcare Research and Quality
540 Gaither Road Rockville, MD 20850
http://www.hcup-us.ahrq.gov
For Technical Assistance with HCUP Products:
Email: hcup@ahrq.gov
or
Phone: 1-866-290-HCUP
Recommended Citation: Hanlon C, Rosenthal J, and Hinkle L. State Documentation of Racial and Ethnic Health Disparities to Inform Strategic Action. Online March 11, 2011. U.S. Agency for Healthcare Research and Quality. Available: http://www.hcup-us.ahrq.gov/reports.jsp |
The authors would like to thank the many people who contributed information to the report. This includes several state officials in the profiled states who generously gave time to participate in informal conversations with NASHP about their health disparity work.
The authors would particularly like to thank: R. Mauricio Palacio, Director, Office of Health Disparities, Colorado Department of Public Health and Environment; Margaret M. Hynes, Supervising Epidemiologist, Surveillance and Reporting Unit, Health Information Systems and Reporting Division, Connecticut Department of Public Health; Angela Jimenez, Administrator, Office of Multicultural Health, Connecticut Department of Public Health; James Peoples, Executive Director, Office of Health Improvement, Office of Minority Health, Georgia Department of Community Health; Carlessia A. Hussein, Director, Office of Minority Health and Health Disparities, Maryland Department of Health and Mental Hygiene; David A. Mann, Epidemiologist, Office of Minority Health and Health Disparities, Maryland Department of Health and Mental Hygiene; Colette Lamothe-Galette, Acting Executive Director, Office of Minority and Multicultural Health, New Jersey Department of Health and Senior Services; Sam Howarth, Director, Division of Policy and Performance, New Mexico Department of Health; Penny Jimerson, Deputy Director, Division of Policy and Performance, New Mexico Department of Health; Vicky Howell, Director, Office of Performance, New Mexico Department of Health; Barbara Pullen-Smith, Executive Director, Office of Minority Health and Health Disparities, North Carolina Department of Health and Human Services; Camillia Easley, CDC Prevention Specialist, Chronic Disease and Injury Section, North Carolina Division of Public Health; Kathleen Jones-Vessey, Manager, Statistical Services Unit, North Carolina State Center for Health Statistics; Carrie Bridges, Team Lead, Health Disparities & Access to Care Team, Rhode Island Department of Health; Rilwan Feyisitan, Chief, Office of Minority Health, Rhode Island Department of Health; Owen Quiñonez, Coordinator, Center for Multicultural Health/Office of Minority Health, Utah Department of Health; and April Young Bennett, Multicultural Health Specialist, Center for Multicultural Health, Utah Department of Health.
The authors would also like to thank the following key informants who provided valuable information about state and national efforts to reduce disparities: Mirtha Beedle, Deputy Director at the Office of Minority Health, U.S. Department of Health and Human Services; Brian Smedley, Vice President and Director of the Health Policy Institute of the Joint Center for Political and Economic Studies; Walter W. Williams, Associate Director of Minority Health, CDC Office of Minority Health and Health Disparities; and Albert Terrillion, Senior Director of Family and Community Health and Meenoo Mishra, Senior Analyst, Health Equity, both of the Association of State and Territorial Health Officials.
Nearly a decade ago, the Institute of Medicine (IOM) issued a call to action to redesign the United States’ healthcare system because Americans do not consistently receive high-quality, appropriate, evidence-based healthcare and instead experience avoidable delays, costs, complications, or errors in care. Subsequently, the IOM published a report showing that racial and ethnic minorities receive, on average, lower quality care than whites.
The Agency for Healthcare Research and Quality (AHRQ) within the U.S. Department of Health and Human Services is responsible for improving healthcare quality for Americans. Since 2003, it has published national data about the quality of the U.S. healthcare system in two annual reports: the National Healthcare Quality Report (NHQR) and the National Healthcare Disparities Report (NHDR). Since its inception, NHDR data has consistently shown that healthcare quality varies by population; the current edition concludes that nearly two-thirds of the measures of disparity in quality of care are not improving for Blacks, Asians, and Hispanics in the United States. This continuation of disparities in health status and healthcare is a problem that affects the entire country. Disparities result in life-years lost as well as subsequent health issues that likely could have been prevented with high-quality care.
As a subcontractor to Thomson Reuters, the National Academy for State Health Policy (NASHP) has supported AHRQ's Healthcare Cost and Utilization Project (HCUP), which is a family of healthcare databases and related software tools and products. This paper builds on a previous HCUP case study report about how states use race/ethnicity data from statewide hospital discharge databases to support activities to reduce disparities in health and healthcare. This report is an effort to more comprehensively explore states' identification, documentation and action on race/ethnicity data to highlight leading practices and inform the potential addition of new data to AHRQ's State Snapshots website, particularly the "Focus on Disparities" section.
For this report, NASHP conducted an environmental scan of all 50 states and the District of Columbia to identify leading states in the use of patient race/ethnicity data, defined as those with state-produced disparities documents meeting the following criteria:
Eight states were identified as leaders in terms of their analysis and/or inclusion of data from state and federal sources in strategic plans and reports to address health disparities: Colorado, Connecticut, Georgia, Maryland, New Jersey, New Mexico, Rhode Island, and Utah. NASHP scheduled informal calls with the authors of the states’ document(s) and other people from the eight states who were involved in creating or using the document(s).
This report synthesizes themes and lessons from these eight states, including the following characteristics of their data-driven disparities documents: general category of document(s); data sources referenced and found to be most useful; indicators presented; units of analysis; role of the Office of Minority Health; public and private partners; connection to broader context of departmental or state activities to reduce disparities; and resulting action and future plans, e.g., for state health reform.
Every state profiled looked to other states when crafting their disparities documents; however, not every state with interesting activity in disparities reduction met the criteria for inclusion as a featured state in this report. Efforts in Arizona, California, Massachusetts, Michigan, Minnesota, North Carolina, Ohio, and Virginia either informed the work of featured states or were identified as being noteworthy during NASHP’s environmental scan.
After reviewing featured states' documents and talking with officials from each of the eight featured states, several themes and lessons emerged.
Featured states take varied approaches to identifying, documenting, and acting on data related to racial and ethnic health and healthcare disparities. Nevertheless, they all emphasize the need for valid data to document disparities and collaboration for action planning to improve health equity. The eight featured states have developed methods for reporting health disparities and have taken concrete steps toward reducing the disparities that exist within their borders. The successes, challenges, and methods of these states can provide guidance for states that are exploring ways to improve their health equity initiatives. Opportunities for funding and increased awareness and attention to these issues, through provisions for reducing disparities in healthcare reform and the National Partnership for Action, may provide momentum for state action.
Nearly a decade ago, the Institute of Medicine (IOM) issued a call to action to redesign the United States' healthcare system because Americans do not consistently receive high-quality, appropriate, evidence-based healthcare and instead experience avoidable delays, costs, complications, or errors in care.1 Importantly, the IOM defined high-quality care as care that is safe, effective, patient-centered, timely, efficient, and equitable, meaning it "does not vary in quality because of personal characteristics such as sex, ethnicity, geographic location, and socioeconomic status.2 Subsequently, the IOM published a report confirming the existence of healthcare disparities or "racial or ethnic differences in the quality of healthcare that are not due to access related factors or clinical needs, preferences, and appropriateness of intervention."3 (see Figure 1). The report showed that racial and ethnic minorities receive, on average, lower quality care than whites. It provided multiple recommendations for improving the healthcare system, including collecting and reporting healthcare access and utilization data by race, ethnicity, and primary language, and using healthcare disparities measures to help measure performance.4
The Agency for Healthcare Research and Quality (AHRQ) within the U.S. Department of Health and Human Services is responsible for improving healthcare quality for Americans. Since 2003, it has published national data about the quality of the U.S. healthcare system in two annual reports: the National Healthcare Quality Report (NHQR) and the National Healthcare Disparities Report (NHDR). AHRQ also publishes state-specific healthcare disparities information from these reports on a companion "State Snapshots" website (http://statesnapshots.ahrq.gov).5 The NHDR is specific to healthcare quality and access among particular populations, including racial and ethnic minorities.6 Since its inception, NHDR data has consistently shown that healthcare quality varies by population; the current edition concludes that nearly two-thirds of the measures of disparity in quality of care are not improving for Blacks, Asians, and Hispanics in the United States.7
Figure 1: Health Disparity and Health Equity: Terms Defined)
The terms "health disparity" and "health equity" are defined in many ways by many organizations.organizations. In general, "disparity" is used to refer to a difference, whereas "equity" indicates the absence of differences that are avoidable and unfair. The draft National Plan for Action of the National Partnership for Action to End Health Disparities offers the following definitions:
Health disparity: " ...a particular type of health difference that is closely linked with social or economic disadvantage. Health disparities adversely affect groups of people who have systematically experienced greater social and/or economic obstacles to health and/or a clean environment based on their racial or ethnic group, religion, socioeconomic status, sex, mental health, cognitive, sensory or physical disability, sexual orientation, geographic location, or other characteristics historically linked to discrimination or exclusion." Health equity: " ...attainment of the highest level of health for all people. Achieving health equity requires valuing everyone equally with focused and ongoing societal efforts to address avoidable inequalities, historical and contemporary injustices, and the elimination of health and healthcare disparities." Source: U.S. Department of Health & Human Services, The National Partnership for Action to End Health Disparities: Changing Outcomes - Achieving Health Equity, The National Plan for Action Draft as of February 17, 2010, 2-3. Available online: http://minorityhealth.hhs.gov/npa/templates/browse.aspx?lvl=1&lvlID=31. End of Figure 1 |
This continuation of disparities in health status and healthcare is a problem that affects the entire country. From both an ethical and pragmatic perspective, disparities are costly. They result in life-years lost as well as subsequent health issues that likely could have been prevented with high-quality care. It has been estimated that health disparities cost the United States $229 billion between 2003 and 2006.8 Although much work remains to eliminate these disparities, there are a number of efforts underway to measure and address them at the federal and state level.9
Recent National Efforts
Two examples of national efforts to address disparities are the National Partnership for Action to End Health Disparities and provisions of the recently enacted federal health reform legislation.
In 1985, well before the publication of the IOM reports, the Secretary of Health and Human Services released a report about persistent gaps in health status among racial and ethnic minorities.10 That document was the impetus for the creation of the Office of Minority Health (OMH) in the U.S. Department of Health and Human Services (as well as what is now called the Office of Minority Health and Health Disparities within the Centers for Disease Control and Prevention). The OMH is dedicated to improving the health status of racial and ethnic minorities, eliminating health disparities, and achieving health equity in this country. In addition to providing funding to entities ranging from state offices of minority health to community- and faith-based organizations, OMH houses a minority health resource center, and most recently, initiated the National Partnership for Action to End Health Disparities (NPA). The NPA is an effort to coordinate national strategies to eliminate health disparities and achieve health equity. One of the five NPA goals includes improving data availability. Under the NPA, OMH is creating a National Plan for Action, a roadmap for the elimination of health disparities. The draft plan was released in February 2010 for public comment and a final version is expected in 2011. The draft plan is the culmination of regional conversations and a national summit; it "captures the status of health disparities in our country and proposes 20 strategies for their elimination."11 These strategies include the use of partnerships, cultural competence, better awareness, and research and data collection.
Additionally, in spring 2010 federal healthcare reform, known as the Patient Protection and Affordable Care Act (ACA), became law.12 The ACA includes a number of provisions that have the potential to help reduce disparities in health status and healthcare access and quality. Between now and 2014, the ACA extends health insurance to millions of Americans, which is critical as people of color comprise one-third of the United States population yet account for one-half of the country’s uninsured.13
ACA directs states to collect information and data regarding disparities.14 For example, one provision stipulates: "No later than 2013, all federally-funded health programs and population surveys... will be required to collect and report data on race, ethnicity, primary language, and other demographic characteristics identified as appropriate by the Secretary of Health and Human Services for reducing health disparities."15
ACA also includes a permanent reauthorization of the Indian Health Care Improvement Act to help meet the healthcare needs of American Indians and Alaska Natives, along with quality improvement provisions, such as the creation of national quality indicators that will be tracked by race and ethnicity.16 Other provisions of the ACA that may be relevant to states include those that relate specifically to healthcare delivery (i.e., workforce diversity, cultural competence, aligning payment with quality rather than quantity of care) and others that reach beyond the healthcare system to influence social determinants of health (i.e., community transformation grants, public health initiatives).17 Overall federal health reform "has the potential to seed, promote and guide diversity initiatives in this country for decades to come."18
NPA goals and provisions of the ACA that relate to collection and reporting of standardized data on race and ethnicity will help form a better understanding of health and healthcare disparities in order to tailor strategies to reduce these disparities. Data are critical to improvement, and effective use of data requires a commitment to collect it, a strategy to combine data from different sources, and selection of priority areas for analysis.
State Roles and Activities
Within the national context of reform and federal initiatives, states are also undertaking activities to improve the health status and quality of care for racial and ethnic minority populations. As of September 2010, all 50 states have a government office or entity dedicated to minority health or health equity.19 Additionally, the number of data organizations participating in AHRQ’s Healthcare Cost and Utilization Project that collect patient race/ethnicity data as part of their statewide hospital discharge databases has increased. As previous reports have shown, there are a number of noteworthy ways in which these hospital discharge data inform statewide efforts to reduce disparities.20,21
This paper focuses on eight states that the National Academy for State Health Policy (NASHP) identified as leaders in terms of their analysis and/or inclusion of data from state and federal sources in strategic plans and reports to address health disparities: Colorado, Connecticut, Georgia, Maryland, New Jersey, New Mexico, Rhode Island, and Utah. As with federal agencies, it has become increasingly clear to states that expanding access is only one aspect of healthcare reform; quality improvement and cost containment are critical to effectively and sustainably implement the components of reform that expand coverage and access to care.
This paper focuses on similarities and differences among data reports and strategic plans in featured states and details states’ activity related to these documents. It highlights lessons states have learned in the process of creating their documents and using them to inform their efforts to address disparities in health and healthcare.
Methodology
As a subcontractor to Thomson Reuters, NASHP has supported AHRQ’s Healthcare Cost and Utilization Project (HCUP). HCUP is a family of healthcare databases and related software tools and products. HCUP databases bring together the data collection efforts of state government organizations, hospital associations, and private data organizations (HCUP Partners) and the Federal government to create a national information resource of patient-level healthcare data that allow for research about an array of health policy issues at the national, state, and local levels. The objectives of HCUP are to create sources of national and state level all-payer healthcare data, produce a set of tools to facilitate the use of these data and other administrative data, and develop a collaborative partnership with organizations in each of the states that will increase the quality/use of healthcare data and research to inform decisions that will affect healthcare delivery.22
AHRQ has provided support to HCUP Partners through workgroups that facilitate information-sharing and peer learning about, among other topics, coding, collecting, and analyzing patient race/ethnicity data from hospital discharge databases. This paper builds on NASHP’s work supporting the recent HCUP Workgroup on Analyzing State Discharge Data on Race-Ethnicity, primarily a case study report about how states use race/ethnicity data from statewide hospital discharge databases to support activities to reduce disparities in health and healthcare.23 Through research for that report, it became clear that 1) states use a range of data sources other than hospital discharge databases to understand racial and ethnic health disparities; and 2) states often compile these data in strategic plans or data reports. This report is an effort to more comprehensively explore states’ identification, documentation and action on race/ethnicity data to highlight leading practices and inform the potential addition of new data to AHRQ’s State Snapshots website, particularly the "Focus on Disparities" section, which currently includes only discharge data.
For this report, NASHP first contacted several experts on disparities reduction activities to learn about existing national and state efforts and help identify best practices in data-driven disparities reports. Key informants represented federal agencies (U.S. Department of Health and Human Services' Office of Minority Health, CDC Office of Minority Health and Health Disparities), a research organization (the Joint Center for Political and Economic Studies) and the national organization representing public health agencies (the Association of State and Territorial Health Officials or ASTHO). Key informants shared useful background materials and resources.24
NASHP simultaneously conducted an environmental scan of all 50 states and the District of Columbia to identify leaders in the use of patient race/ethnicity data. NASHP conducted an internet search of all states’ health and/or minority health (if applicable) departments to find state-produced disparities documents meeting the following criteria:
After identifying a preliminary list of state documents that initially appeared to meet the above criteria, NASHP e-mailed directors of Departments of Health and Offices of Minority Health (where applicable) in each of the 50 states plus the District of Columbia. The directors were asked to verify the accuracy and completeness of a summary of the documents located by the search. After receiving feedback from states about their data reports and strategic plans, NASHP consulted with AHRQ and Thomson Reuters to finalize the selection of states to profile. NASHP selected eight states that best met the aforementioned criteria, with consideration also given to profiling states from different regions of the country. These states are: Colorado, Connecticut, Georgia, Maryland, New Jersey, New Mexico, Rhode Island, and Utah. NASHP then scheduled informal calls with the authors of the state document(s) and other people from the state who were involved in creating or using the document(s).
Some states that are doing noteworthy work to address disparities did not meet the particular criteria for this study and were not included among the eight that are featured. However, this paper briefly mentions some of these states and notes what makes them unique.
The following sections synthesize themes and lessons from the eight featured states, including the following characteristics of their data-driven disparities documents:
When it comes to using data to document disparities and inform action, featured states primarily produce three different categories of documents: action plans, data reports, or a combination of both. States sometimes use the terms differently. New Mexico and Georgia, for example, are unique in that they both issue "report cards" that grade disparity rates, yet New Mexico's document exclusively presents data while Georgia's document provides both data and action steps. It also is important to note that some states create reports that focus on disparities across a range of health issues and conditions, whereas others have a number of condition-specific reports that explicitly document racial/ethnic disparities. The latter are used by states separately to address disparities within a wide variety of health conditions, such as heart disease, diabetes, asthma, oral health, and HIV/AIDS.
The three main categories of documents states produce are described below.
Common Elements of Data Reports and Action Plans
Most of the reviewed state data reports provide information about data sources, indicators, and limitations of the data. These documents also interpret the data to identify findings about disparities within the state. Additionally, many data reports feature a discussion on determinants of health, comparisons of metrics and performance measures by race/ethnicity (in some cases by income level), and some plans feature target values for metrics and measures. Report cards also focus on data and include a discussion and interpretation of the rating system (See "Report Card Data," page 25).
Action plans contain a different set of common elements. As the term implies, each action plan contains action steps aimed at reducing disparities. Several of the action plans reviewed suggest critical questions that should be addressed by state program officials, policy makers, and others in order to reduce disparities. The plans then make recommendations for steps to address these questions. Action plans often also set state goals. Action plans are less focused on data as a whole; several contain little data or only a brief overview, while some contain no data at all. Instead the focus of an action plan is to strategize the steps necessary to address the problem identified by the data report and to achieve any target outcomes. For this reason, many featured states that have an action plan for reducing disparities also have a companion data report (as illustrated in Table 1, below).
Table 1 describes the documents that NASHP reviewed in the profiled states. This table does not include every plan published by each state, though the plans that NASHP reviewed with states are representative of the work being done by the state. A more detailed list of state documents — as well as web links — can be found in Appendix A.
Table 1: Reviewed Documents that Focus on Health and Health Care Disparities in Leading States, by Category (Action Plan and/or Data Report)
| State | Document Title | Action Plan | Data Report |
|---|---|---|---|
| Colorado | 2008-2010 Office of Health Disparities Strategic Plan | Y | N |
| Racial and Ethnic Health Disparities in Colorado 2009 | N | Y | |
| Colorado Health Disparities Strategic Plan 2008: Interagency Health Disparities Leadership Council | Y | N | |
| Connecticut | The 2009 Connecticut Health Disparities Report | Y | Y |
| Georgia | Health Disparities Report 2008: A County-Level Look at Health Outcomes for Minorities in Georgia | Y | Y |
| Maryland | Maryland Chartbook of Minority Health and Minority Health Disparities Data | N | Y |
| Maryland Plan to Eliminate Minority Health Disparities Plan of Action 2010-2014 | Y | Y | |
| New Jersey | Strategic Plan to Eliminate Health Disparities in New Jersey March 2007 | Y | Y |
| Strategic Plan to Eliminate Health Disparities in New Jersey Dec. 2007 Update | Y | N | |
| Strategic Plan to Eliminate Health Disparities in New Jersey: Update & Addendum | Y | Y | |
| New Mexico | Racial and Ethnic Health Disparities Report Card | N | Y |
| Rhode Island | Heart Disease and Stroke Prevention Rhode Island State Plan 2009 | Y | Y |
| Reducing the Burden of Asthma in Rhode Island: Asthma State Plan, 2009-2014 | Y | N | |
| Minority Health Plan for Action | Y | N | |
| Utah | Health Status by Race and Ethnicity: 2010 | Y | Y |
| Action Plan to Eliminate Racial/Ethnic Health Disparities in the State of Utah | Y | N |
Primary data collection and use of secondary data (including analysis and presentation in reports) play a vital part in the effort to address health disparities. In order to make effective policy and to develop useful plans, it is critical that the data accurately reflect where these gaps exist. A recent report by the Institute of Medicine (IOM) found that, "consistent methods for collecting and reporting health data by race, ethnicity, and language are essential to informing evidence-based disparity reduction initiatives."32
The states profiled had varying approaches to selecting data indicators. Maryland, New Mexico, and Connecticut each had one or more epidemiologists on staff to manage the data available and determine the appropriate indicators. Utah contacted various state health departments/programs for data and indicators to use for their disparities reports. Upon receiving the data and indicators, Utah's Office of Minority Health (OMH) then chose which indicators it felt were the best fit for the reports. Colorado convened a health disparities report advisory committee to determine the report sections and indicators. Committee members were involved from the beginning of the process and included: community-based organizations serving different racial and ethnic communities, healthcare providers, cultural competence experts, foundations, local health departments, Office of Health Disparities staff and state health department staff from different programs. Georgia brought in data collectors and an epidemiologist from outside the agency, including the Morehouse School of Medicine, to select the indicators used in the state's report. In New Jersey, indicators used in the disparities plan were primarily informed by the state's Healthy New Jersey (HNJ) 2010 indicators. When the disparity area examined did not have a corresponding HNJ indicator, programs used the data available to them to describe the disparity. Many of the data reflect a combination of HNJ and program selected indicators. Rhode Island let programs select the data indicators that they wish to use when coming up with their plans, though the State OMH does provide guidance to these programs.
The most commonly presented measures in reviewed states' data reports focus on mortality rates and the prevalence or incidence of risk factors/behaviors, such as smoking or physical inactivity; every featured state included measures from each category. Every featured state data report also included measures of healthcare access/utilization, such as avoidable hospitalizations or emergency department visits and receipt of recommended cancer screenings, physical exams or other healthcare services. Measures about access to or receipt of appropriate prenatal care were most common (6 states). See Table 2 for a more detailed list of measures included in featured states’ reviewed data reports.
Table 2: Types of Measures Presented in Featured States' Data Reports
| Measure | CO | CT | GA | MD | NJ | NM | RI | UT | |
|---|---|---|---|---|---|---|---|---|---|
| Prevalence/Incidence of Conditions | (e.g., cancer rate, new cases of sexually transmitted infections) | ✓ | ✓ | ✓ | ✓ | ✓ | ✓** | ✓ | |
| Prevalence/Incidence of Risk Factors/ Behaviors | (e.g., smoking, low-term birth, exposure to second hand smoke, arrests for driving under the influence of drugs or alcohol) | ✓ | ✓ | ✓ | ✓ | ✓ | ✓ | ✓* | ✓ |
| Access/Utilization | 1. ER/ED use for ACSCs | ✓ | ✓ | ✓ | |||||
| 2. Hospitalization for ACSCs | ✓ | ✓ | ✓ | ✓ | |||||
| 3. Receipt of recommended treatment (e.g., cancer screening, routine medical checkup) | ✓ | ✓ | ✓ | ✓ | |||||
| 4. Have health/dental insurance | ✓ | ✓ | ✓ | ✓ | ✓ | ✓ | |||
| 5. Access to healthcare providers (e.g., rate per 100K population, % of population vs. providers) | ✓ | ✓ | |||||||
| 6. Pre-natal care | ✓ | ✓ | ✓ | ✓ | ✓ | ✓ | |||
| 7. Other: a. Regular/usual source of care (CO, UT) b. No access to needed care, ED as point of access to care (UT) c. Could not afford to see a doctor in year prior (MD) d. Access to translated materials and/or language services, if needed (NJ, CT) |
✓ | ✓ | ✓ | ✓ | |||||
| Cost | 1. Excess utilization | ✓ | |||||||
| 2. Life years lost | ✓ | ||||||||
| 3. Days away from work | ✓ | ||||||||
| Mortality | (Death rate) | ✓ | ✓ | ✓ | ✓ | ✓ | ✓ | ✓* | ✓ |
| Socioeconomic Status | 1. Poverty | ✓ | ✓ | ✓ | ✓ | ||||
| 2. Income | ✓ | ✓ | ✓ | ✓** | ✓ | ||||
| 3. Unemployment | ✓ | ✓ | |||||||
| 4. Education | ✓ | ✓ | ✓* | ||||||
| Other | 1. Provider diversity (CT, GA, NJ) | ✓ | ✓ | ✓ | ✓ | ✓ | |||
| 2. Protective factors (e.g., knowledge of risk factors) (UT) | |||||||||
*ACSC – Ambulatory care sensitive condition (a condition for which hospitalization is avoidable with appropriate preventive care, e.g., diabetes, tooth pain)
Rhode Island: ✓** = Present in both Heart and Asthma plans, ✓* = Present only in Heart plan, ✓ = Present only in Asthma plan
Data Sources
States vary in data sources, unit of analysis, and rates used to report disparities in their health disparities reports (see Table 3). Many states indicated that the most valuable data was whatever told the story the best, or made the best case for the need to address the disparities. There were several data sources that were commonly used and listed as helpful. The first is Behavioral Risk Factor Surveillance System (BRFSS), "a state-based system of health surveys that collects information on health risk behaviors, preventive health practices, and health access primarily related to chronic disease and injury."33 The behaviors that are surveyed include tobacco use, alcohol use, and others that can affect health outcomes. States can use BRFSS to effectively chart trends in the population, identify health objectives, and develop appropriate public health policies in response to the results.34 A second common source of data is state registries for conditions such as cancer or HIV. States also often use vital records, which contain data about births and deaths. Hospital discharge and emergency department data are other common sources of data. Just over half of profiled states (5) use hospital discharge data, and just under half (3) use emergency department data.
Other types of data that states use vary based on what the states and hospitals record and, therefore, are available. For example, New Jersey has an abundance of violent death data in its Violent Death Reporting System, which includes measures such as homicides, suicides, and vehicular accidents. The state has found this to be a valuable resource for its disparities reports. Additionally, New Jersey published a series of maps in its plan which provided a breakdown of minority populations by county, centers for primary care by legislative district, and acute care hospitals by legislative district. Maryland includes a map in every publication that comes from its Office of Minority Health and Health Disparities. The map shows the minority population breakdown by county. Maryland includes the map because it shows that racial and ethnic minority populations (and therefore any racial or ethnic disparities in health or healthcare) are not necessarily isolated to Baltimore City and Prince George’s County (a suburb of Washington, D.C.), which had been a common misconception. Instead, this map shows that meeting the health needs of racial and ethnic minority groups by identifying and addressing disparities is indeed a statewide issue.
Table 3: Data Sources, Units of Analysis, and Rates in Reviewed State Data Reports*
| State | Data Sources | Geographic Unit(s) of Analysis | Rate(s) (Absolute or Relative) | ||||||
|---|---|---|---|---|---|---|---|---|---|
| BRFSS | Vital Records | Hospital Discharge | ED/ER | Child Health Survey | Census^ | Other | |||
| Colorado | Y | Y | N | N | Y | Y | Pregnancy Risk Assessment Monitoring System, Disease Incidence | State and County | Relative |
| Connecticut | Y | Y | Y | Y | N | Y | U.S. Department of Labor Survey of Occupational Injury and Illnesses,^ and Census of Fetal Occupational Injuries;^ Department of Public Health Infectious Disease Section; Lead Poisoning and Prevention Control Program Blood Lead Level Data, Child Oral Health Survey | State | Both |
| Georgia | Y | Y | Y | N | N | Y | County | Both | |
| MarylandChartbook and Plan | Y | Y | Y | N | N | Y | US Renal Data System^ | State and County | Both |
| New Jersey2007 Plan 2010 Update and Addendum |
Y Y |
Y Y |
Y N |
Y Y |
Y N |
Y N |
Violent Death Reporting System |
State and County State |
Both Both |
| New Mexico | Y | Y | N | N | Y | N | Infectious Disease Surveillance | State | Relative |
| Rhode Island Heart Disease Plan Asthma Plan |
Y Y |
Y Y |
N Y |
Y Y |
Y Y |
N N |
State State |
Relative Relative |
|
| Utah | Y | Y | N | N | N | Y | Utah Department of Health Office of Public Health Assessment, Utah Healthcare Access Survey, Pregnancy Risk Assessment Monitoring System, Violent Death Reporting System, Cancer Registry | State | Absolute |
*BRFSS - Behavioral Risk Factor Surveillance System, a state-based national health survey supported by CDC that monitors state-level prevalence of behavioral risk factors; Vital Records — Records of life events kept under governmental authority, including birth and death data and other related information; Hospital Discharge — Data related to information on inpatients at the time of hospital discharge; ED/ER — Emergency Department/Emergency Room Data, a registry of data collected and recorded from emergency room visits; Child Health Survey – state administered surveys to determine the health of children and youth; and Census — information from the United States Census Bureau.
^ Indicates a national data source.
AHRQ’s State Snapshots
AHRQ’s State Snapshots website (https://www.ahrq.gov/research/data/state-snapshots/index.html) uses state-level data from the annual NHQR and NHDR reports as well as additional data analyses to describe the quality of care across and within states. In particular, quality of care measures by race and ethnicity within each state can be accessed through the "Focus on Disparities" section. This section compares state performance to the national average to result in a ranking that ranges from very weak to very strong state performance in quality of care for a given racial or ethnic group compared to Whites (Non-Hispanics).
This source of health disparities information was not cited in featured states’ documents. In fact, most profiled states had very limited or no familiarity with this site and the "Focus on Disparities" Section. However, after visiting the site, states made suggestions for improving the usefulness of the information to them: adding more sources of data; including more race/ethnicity categories; and using more state-to-state comparisons.
Units of Analysis: Statewide vs. County Level
Four of the eight states studied display data broken down by county. These are the larger states: Georgia (pop. 9,829,211), New Jersey (8,707,739), Maryland (5,699,478), and Colorado (5,024,748).35 Two states that did extensive county-level analysis, Georgia and Maryland, both did so because they found it helped make the case that health disparities are truly statewide problems that affect residents of every county. Georgia uses only county-level data to illustrate that health disparities are not only an urban issue in Atlanta but are far more widespread. Colorado's 2009 report and Maryland’s Chartbook show the geographic breakdown of each minority group profiled. New Jersey’s Department of Health and Senior Services' State Health Assessment Data (NJSHAD) System website provides geographic and county-level public health and health status information that complements data in state disparities reports (https://www.nj.gov/health/chs/njshad/). ![]()
The smaller states — Connecticut (pop. 3,518,288), Utah (2,784,572), New Mexico (2,009,671), and Rhode Island (1,053,209) — generally have limited county data.36 Nevertheless, Rhode Island has geomapped cigarette vendors in low income communities, and Connecticut has used geomapping to take a closer look at cities where minority populations are over-represented.
Comparing Population Rates
Identification of disparities requires comparison of groups in order to find gaps.37 In order to compare health status and health outcomes between racial and ethnic minority populations, states use absolute and/or relative rates (see Figure 2). Either type of rate can be used to measure disparities, but they provide different types of information.38 An absolute rate is a numerical value describing a single population (e.g., mortality), whereas a relative rate, often expressed in the form of a ratio, is derived from comparing the numerical value for one population with that for another population.
Relative rates are more commonly presented by the featured states than absolute rates (i.e., all states present relative rates while three use both). States determine the comparisons that will be most useful for them. In choosing between relative and absolute rates, featured states assessed the complexity of the information (i.e., their ability to explain it to the public), as well as which rate of comparison makes the best case for action. For example, Connecticut, Georgia, Maryland and New Jersey use both absolute and relative rates, having found that each provides useful information. Maryland added that ratio metrics are easier for the public to understand; however for understanding time trends in disparities, a difference metric is a better indicator of progress. State decisions are also influenced by availability of data and standard protocols.
Figure 2: Examples of Absolute and Relative Rates
Absolute: An absolute rate is a numerical value describing a single population; for example, any data that shows that a certain condition occurs in a number of people per 1,000 of a certain population is an absolute rate. These rates include: mortality rates, birth rates, and disease incidence rates (i.e., in Connecticut the HIV/AIDS incidence rate for Hispanics is 81.9 per 100,000).* Relative: Relative rates are derived by comparing one measure to another, such as a state finding that African Americans have a diabetes incidence rate three times that of the White population; this resulting ratio is a relative rate. New Mexico’s disparity ratios are another example (e.g., the youth obesity rate for American Indians is 2.2 times greater than the youth obesity rate of Whites).** Sources: * The 2009 Connecticut Health Disparities Report, 81. ** Racial and Ethnic Health Disparities Report Card, 8. |
Races and Ethnicities Covered
As shown in Table 4, reviewed state data reports only varied slightly from each other in the races/ethnicities for which metrics and measures were presented. These variations can generally be explained by the composition of the state’s population, and by the data available for a particular racial/ethnic group. Georgia, for example, has limited data available on the Asian population, so there is a larger focus in the documents on the Hispanic/Latino and African American populations. Additionally, while each of the states have a Native American population, the western states (Colorado, New Mexico, and Utah) have larger Native American populations and generally have a larger focus on those groups in their plans. The two states that produced report cards (Georgia and New Mexico) graded disparities for each minority group, but did not produce separate report cards by race/ethnicity.
The table also shows that states define races differently. Utah, for example, includes Native Hawaiians in the Pacific Islander population and includes Alaska Natives with Native Americans, which is the federal standard. In Connecticut, however, these groups are not combined and the presentation of data specific to them depends on the indicator. Featured states also use different terms for similar populations. New Mexico uses the term "American Indians," where Colorado uses both the term "American Indians" and "Native Americans." The state documents provide more detail on how each race/ethnicity is defined.
Table 4: Races and Ethnicities Included in Reviewed State Disparities Reports
| State | Black or African American | Hispanic/ Latino | Asian/Pacific Islander | Native American or American Indian | Notes |
|---|---|---|---|---|---|
| Colorado | Y | Y | Y | Y | |
| Connecticut | Y | Y | Y | Y | Inclusion of White, Alaska Native, Native Hawaiian and Pacific |
| Georgia | Y | Y | Y | Y | Inclusion of White, Multiracial, Native Hawaiian depends on the indicator |
| Maryland Chartbook and Plan | Y | Y | Y | Y | Native American includes Alaska Natives |
| New Jersey 2007 Plan and 2010 Update and Addendum | Y | Y | Y | N | |
| New Mexico | Y | Y | Y | N | |
| Rhode Island Heart Disease Plan and Asthma Plan | Y | Y | N | N | |
| Utah | Y | Y | Y | Y | American Indian includes Alaska Natives. Asian and Pacific Islander are reported separately. Native Hawaiian/Pacific Islander are reported together. |
Health Topics and Conditions Covered
Table 5 shows the conditions addressed by disparities documents. The majority of states present data on heart disease/stroke, HIV/STDs, cancer, and maternal and child healthcare issues. Oral health and mental health are covered less often. In New Jersey, mental health programming and data fall outside the purview of the Department of Health and Senior Services, but the Office of Minority and Multicultural Health maintains contact with people designated to address disparities in mental health. Mental health indicators are being used for a forthcoming foreign-born report. Since all states use the BRFSS, there is a great deal of data featured across states on risk behaviors such as tobacco use, obesity, and alcohol/substance abuse.
Table 5: Health Topics Covered in Reviewed States’ Data Reports
| State | Heart Disease/ Stroke | Cancer | Asthma | Maternal and Child Health Care | Diabetes | HIV & STDs | Oral Health | Mental Health | All Cause or General Mortality | Other |
|---|---|---|---|---|---|---|---|---|---|---|
| Colorado | Y | Y | Y | Y | Y | Y | Y | Y | Y | Motor Vehicle Injury |
| Connecticut | Y | Y | Y | Y | Y | Y | Y | N | Y | |
| Georgia | N | Y | N | Y | N | Y | Y | Y | Y | |
| Maryland Chartbook and Plan | Y | Y | Y | Y | Y | Y | N | Y | Y | Tobacco Use, Obesity, Renal Disease |
| New Jersey 2007 Plan and 2010 Update and Addendum | Y | Y | Y | Y | Y | Y | N | N | Y | Violent Deaths, Adult and Child Immunization, Renal Disease, Influenza and Pneumonia |
| New Mexico 2007 Plan and 2010 Update and Addendum | N | Y | N | Y | Y | Y | N | N | N | Homicide, Motor Vehicle Injury, Suicide, Teen Births, Obesity, Tobacco Use, Alcohol Related Deaths, Pneumonia Vaccination, Pertussis |
| Rhode Island Heart Disease Plan Asthma Plan |
Y | Y | ||||||||
| Utah | Y | Y | Y | Y | Y | Y | N | Y | N | Violent Death, Alcohol Abuse, Tobacco Use, Tuberculosis, Motor Vehicle Injury, Motor Vehicle Crash Death, Adult Immunization, Obesity |
States Increasingly Turn to the Topic of Costs of Disparities
"The costs to the health system are significant when care for Georgia’s uninsured people are uncompensated and the costs are absorbed by the health institutions. The cost of treating unhealthy patients in Georgia’s emergency rooms is much higher than the cost of preventing health problems. When populations have disproportionately higher illness rates and higher uninsured rates, it results in higher costs to the health system overall."
- 2008 Georgia Health Disparities Report, 13
A data topic of great interest among featured states is the impact of disparities. Some of the profiled states (e.g., Georgia and Maryland) already measure the impact of disparities while several others are exploring ways to do so. Costs can be calculated both in years of potential life lost, and in financial terms of additional spending on healthcare services. Georgia calculated years of potential life lost (YPLL) - 75 for each county because it made for an effective message on disparities. Georgia defines and calculates (YPLL) - 75 as "the number of person-years of life lost due to deaths before age 75. Consider one African American male dying at age 54 (YPLL = 21 person years) and the disproportionate impact (lost grand-parenting, lost productivity and income, and lost wisdom of our elders) of the younger man’s death on the African American community."39 The state presented this metric for each county to show the human cost that health disparities can have on a population in a way other forms of information can not.
Maryland, on the other hand, looked at the cost of disparities in terms of monetary value. Using the state’s hospital discharge data, Maryland calculates the "excess cost" to the state incurred both by Medicare, and by all-payers. Maryland calculates the cost of excess hospital admissions for all diagnoses incurred by the African American population ($59 million to Medicaid and $481 million to all payers), and breaks down the cost further to several specific diagnoses (i.e., cancer and asthma). These excess costs are associated with hospitalization related to the diagnoses seen in Figure 3.40 The state noted that this is a valuable metric when it comes to addressing stakeholders and other interested parties. It shows these groups that there is a financial or economic benefit to reducing disparity rates.
Figure 3: Hospital Cost of Excess Black or African American Hospital Admissions, Maryland, 2004
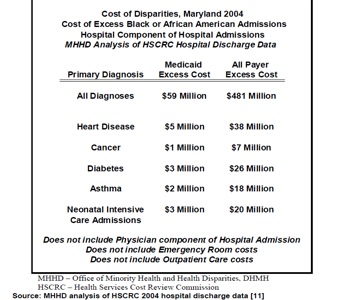
Source: Maryland Chartbook of Minority Health and Minority Health Disparities Data, 2009, 33.
Connecticut calculates costs in terms of human loss and days away from work. For the former term Connecticut uses the metric "excess deaths, excess events," which it defines as, "those deaths that would not have occurred if one population subgroup (e.g. Black or male) had the same death rate as another subgroup (White or female)." Connecticut uses the following formula to calculate excess deaths:
Excess deaths (or events) = Number of deaths (or events) x [1 - (1 / relative risk)]
This metric is similar to Georgia’s use of YPLL. In calculating this metric, Connecticut was able to demonstrate that, "Compared with White residents, Blacks or African Americans had an estimated total of 376 excess deaths per year from 2000 to 2004."43 Using Connecticut’s formula and CDC WONDER mortality data, Maryland was able to calculate excess deaths in its state; one Maryland official believes every state could do the same thing.
Additionally, Connecticut includes a graph which demonstrates the days away from work caused by injuries and illness in private industry by race or ethnicity.44 The graph Connecticut includes in its report demonstrates that Hispanic and Black populations in Connecticut consistently experience days away from work at a higher rate than the White population.
Figure 4: Rate of Non-fatal Work-related Injuries and Illnesses Involving Days Away from Work, Connecticut—Private Industry, by Race or Ethnicity, 1999-2006
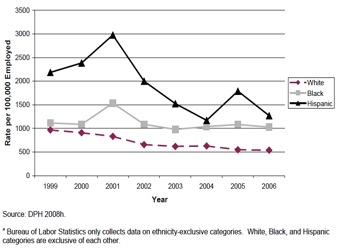
Source: Stratton, Hynes, and Nepaul. The 2009 Connecticut Health Disparities Report, 120
Colorado has not yet established a metric for calculating the cost of disparities, however, the state recognizes the importance of the topic and discusses it in its Racial and Ethnic Health Disparities in Colorado 2009 report:
"Health disparities are costly in several senses of the term. They generate costs to the health-care system that could be reduced by the elimination of disparities. More importantly, poor health extracts a cost to individuals, families and communities by limiting the ability of people to realize their full potential."45
Eventually, Colorado would like to take the same approach as Maryland, to help make the case to policy makers and others for funding. Rhode Island, with the assistance of a consulting organization, is in the process of producing several fact sheets that analyze the costs of disparities associated with cardiovascular disease, diabetes, obesity and sexually transmitted infections. The state is analyzing costs by race, ethnicity, and language spoken in terms of excess deaths, days of hospitalization, and burden of disease, along with excess or unnecessary medical charges and insurance claims. The documents will be published in 2011.
States Lack Data Indicators Needed to Develop a Comprehensive Understanding of Disparities
In addition to cost of disparities data, there were several other characteristics of data indicators that the profiled states expressed interest in for inclusion in future reports. Most states indicated that they want more of their data sources and indicators to be broken down by race/ethnicity. Georgia and Colorado, for example, have very little data on Asian Americans; Colorado would also like additional condition-specific data for American Indians. New Mexico indicated a need for more reliable hospital discharge data before including that data in its reports. Maryland lacks non-hospital-based outpatient administrative data broken down by race/ethnicity; race/ethnicity data are not currently included in the claims information received by the State from insurance companies for inclusion in the Statewide claims database.
Sometimes race/ethnicity data are available from a particular source but the specific fields or indicators are not exactly in line with what the state wants to include in its disparities document. For example, New Jersey is interested in including different immunization data than what is currently collected, so it has omitted this source from its reports thus far. New Jersey would need to move to an electronic birth record to facilitate better measurement of disparities in immunization rates. Mandatory reporters would need to be required to record race/ethnicity data in order for both immunization and STD disparities to be better captured. In Utah, the Department of Health would include substance abuse data in its reports, if the data were analyzed differently, such as by aggregating multiple years of data to decrease confidence intervals.
Use of Socioeconomic Data Is Contingent on Availability
All profiled states indicated that socioeconomic status data are an important resource for data reports about disparities since variables such as education level, income, and poverty correlate with the health of minorities, and racial and ethnic minorities are disproportionately represented among the poor. Most of the states use socioeconomic data in some form; however the availability and, therefore, the degree of use varies from state to state. New Jersey includes socioeconomic data as part of the overall demographic introduction to its reports and plans to do more with these data in the future. Connecticut had access to socioeconomic data from a federal source (the Census), but very few sources within the Department of Public Health consistently collect socioeconomic data. Georgia relies heavily on socioeconomic data from the Census, for example, persons below poverty and percent of adults having completed less than a ninth grade education.
Report Card Data
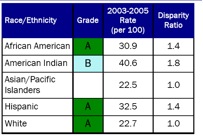
Of the states profiled, both Georgia and New Mexico compile data into "report cards" or publications that categorize data into letter grades; however, they approach their respective report cards differently. Georgia examines the state on the county level and grades each county in a number of different categories that fall under four broader headings (Social and Economic, Mortality, Illness Events, and Birth Outcomes). New Mexico, being smaller than Georgia, focuses its report card on the state level and grades the disparity ratio for each ethnicity by condition (i.e., obesity, diabetes, infant mortality, etc.). New Mexico’s grading system is also inspired by North Carolina (see Figure 8). One key difference in their otherwise-similar approaches, however, is that North Carolina’s disparity rates are all calculated by comparing the rate of the minority group to the rate in the white population. New Mexico, on the other hand, calculates ratios using the population with the best rate for a condition as a comparison. New Mexico took this approach because the state’s white population is not as large a percentage as many others, and the white population did not have the best rate on each condition.
Even though Georgia and New Mexico grade different metrics/measures and conditions, there are several similarities between the two. Both states grade on an A-F scale. For example, in Georgia, an A rate is given for "Excellent Black Performance or Outcome combined with High Level of Equality," and an F for, "Extremely Poor Black Performance or Outcome made worse by Very Severe Racial Inequality."46 Figure 5 presents an example of part of a Georgia county report card.
Figure 5: Sample Georgia Minority Health Report Card: Barrow County
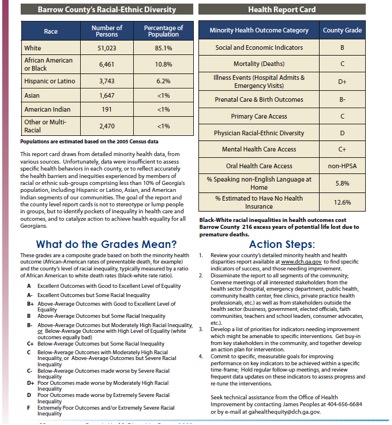
Source: 2008 Georgia Health Disparities Report, 33.
Georgia, like New Mexico, chose to produce a report card because it felt that a report card would bring attention to the topic of health disparities. New Mexico also believed that a report card would be more meaningful to the public, and it would be better received than a plan, given a great number of existing plans. New Mexico initially found that the grades in the report card upset some community members who believed that the grade reflected upon the racial or ethnic population rather than the state’s or health system’s performance in meeting the health needs of the population. The state conducted outreach to communities about the meanings of the report card grades. Based on community feedback, New Mexico re-worded the explanation of the grading system in subsequent versions of the report card; "grade" was replaced by the phrase "health system effectiveness" as demonstrated in Figure 6, below.
Figure 6: Changes in Wording from 2006-2007 in New Mexico's Report Cards As Demonstrated by the "Prenatal Care - Late or No Care" Measure*
| 2006 Wording | 2007 Wording |
|---|---|
 |
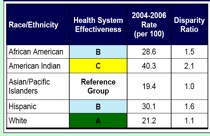 |
*This measure indicates the rate at which women receive prenatal care late in pregnancy (after the third month) or not at all during pregnancy.
Several of the states profiled that have not developed report cards indicated that doing so would be of interest in the future.
The featured states use various processes to develop their disparities data reports and action plans, but all require and rely on collaboration. As the following sections describe, profiled states work collaboratively with sister departments as well as with private partners to compile data about racial and ethnic disparities into public documents; epidemiologists from both public and private entities are particularly important for selecting data indicators.
The states profiled vary in the role the State Office of Minority Health (OMH) plays in collecting and aggregating data and carrying out improvement strategies. At one end of a spectrum, the OMH has its own epidemiologists who collect or analyze data and report on disparities across a range of health conditions and healthcare issues in consultation with various programs and agencies. On the other end of the spectrum, the OMH plays a consultancy role to various programs and agencies. In this case, the programs are charged with setting goals for reducing disparities and collecting and aggregating their data to evaluate impact. The programs issue condition-specific reports rather than a more comprehensive report issued by the OMH. The examples below represent the continuum of approaches.
Featured States Rely on Public/Private Partnerships
A similarity among all of the states, regardless of how they structure their disparities work, is a strong reliance on private and/or public partnerships to produce data documents.
Academic Institutions
States frequently partner with state academic institutions for assistance with data analysis and collection. For example, Georgia partners with Georgia State University (GSU) and Morehouse School of Medicine; the latter is aiding in the primary collection of data for the Asian community. Georgia also partnered with GSU as one of its grantees to provide services to address legal needs encountered as a result of social determinants of health. Connecticut partners with the University of Connecticut, which has conducted geocoding to analyze births and deaths on the local level. Similarly, Rhode Island has collaborated with Brown University, and Maryland has worked with the University of Maryland and Johns Hopkins University.
Community Coalitions or Organizations
Critical partners for featured states are community-based coalitions or organizations that strive to reduce racial and ethnic disparities, such as NAACP state chapters, Native American interest groups, Hispanic groups, Asian groups, and groups that focus on reducing poverty. States consult with community groups before, during, and after the creation of disparities data reports and action plans to understand community priorities and help shape current or future documents. Maryland involves communities each step of the way in the creation of its documents. Before drafting its plan, staff members meet with various community groups representing different races/ethnicities to hear which issues they consider most pressing. Maryland undertakes this process to help establish a reputation and credibility with groups throughout the state. As a result, the state’s data and plan have been received well, and the state has fostered a network for outreach to communities on a variety of issues. Colorado works in partnership with community stakeholders, community-based organizations, the Minority Health Advisory Commission and the Interagency Health Disparities Leadership Council to develop its Colorado Health Disparities Strategic plan. Colorado’s health disparities report was developed with input from a diverse and multidisciplinary advisory group. Now several community groups in Colorado are working with the state to reduce disparities. New Jersey presents data to community groups upon request; the OMMH has also called community members together, for example by hosting a series of roundtable discussions, to address various topics of interest. The OMMH joins community coalitions also engaged in initiatives to reduce health disparities statewide.
Community organization feedback also helps identify areas where documents can be improved. As previously noted, New Mexico changed its language describing the report card grading system after receiving community feedback. Georgia decided to develop a plan devoted to Asians after community organizations noted the need for inclusion of data about Asians. Georgia now aims to use a vetting process for future draft reports to solicit community feedback before finalizing the information for publication.
Other Private Partners
Other private partners identified by featured states include hospital associations that house hospital discharge data and foundations. In Connecticut, the disparities report came about as a result of a grant from the Connecticut Health Foundation, and the state has an arrangement with the Connecticut Hospital Association to access hospital discharge data for its report. Featured states use a number of funding mechanisms to develop their disparities data documents, and grants from organizations such as the Robert Wood Johnson Foundation and W.K. Kellogg Foundation have provided valuable support. Potential future partners include HCUP Partner organizations (data collection organizations other than hospital associations that participate in HCUP) and Medicaid agencies, with which profiled states have less strong relationships.
The impetus for each state’s document demonstrates the need to engage partners beyond those listed above to include federal agencies, state agencies, and state legislators. New Jersey and Maryland’s documents were authorized through state legislation. Georgia and Rhode Island’s documents came out of departmental initiatives. New Mexico and Utah’s documents were prepared under grants from the Federal OMH. Kaiser Permanente provided significant financial support for Colorado’s health disparities report. Activities and support for the health disparities report and the Colorado Health Disparities Strategic plan were also part of a State Partnership grant from the Federal OMH.
One strategy featured states use to engage multiple private and public sector partners is partnership councils that provide guidance on various activities, such as data documents. For example, New Mexico convened a Report Card Advisory Council that included several epidemiologists and informed the data indicators used in the state’s report card. In other states, councils advise on statewide minority health improvement efforts, however the partnerships also create a mechanism for collaboration across programs or departments to improve disparities data documents. Examples of councils include the Minority Health Advisory Council (GA), Minority Health Advisory Commission (CO, NJ), Interagency Health Disparities Leadership Council (CO), and Minority Health Advisory Committee (RI).
All of the profiled states have taken action on their disparities data reports, and they have clear plans for future action. Their past and planned actions include: applying for national or federal grants; educating and engaging communities; establishing new or strengthening existing public health projects; producing additional related documents; and implementing new policies or strategies to assess and improve internal departmental operations. Many of the featured states have planned future action based on their reports, or are working on new reports. Several of the states indicated, however, that future action is contingent on funding, which is a challenge in the current economic climate.
A simple, yet powerful way featured states act on their disparities reports is by incorporating data and information into applications for national or federal grants to make the case for funding:
Profiled states have also conducted outreach to stakeholders, particularly local communities, to inform them about the disparities documents:
State disparities documents also inform new or existing public health projects. States provide grants to local communities to address disparities described in state reports.
Featured states have published or are planning new documents that update or complement previous reports. These include fact sheets, or brief summaries with detailed information about health disparities for specific racial and ethnic minority populations, as referenced in Figure 7.
Figure 7: Fact Sheets
Several featured states have produced fact sheets that focus on disparities for specific populations. In follow up to its disparities report, Colorado created four health disparities data sheets about Hispanics/Latinos, African Americans/Blacks, American Indians, and Asians/Pacific Islanders. Similarly, Rhode Island published four minority health fact sheets with data for African Americans, Asians and Pacific Islanders, Hispanics/Latinos, and Native Americans. Both states’ fact sheets include data on healthcare access, infectious disease, risk behaviors, demographics, and maternal and child health. Utah published Health Disparities Summaries 2009, which includes a set of fact sheets with infectious disease, alcohol abuse, mental health and violence data for African Americans/Blacks, Asians, Hispanics/Latinos, and Pacific Islanders. The series also includes six fact sheets with data on chronic conditions, reproductive health, injury, and lifestyle risk for different races and ethnicities. (See Appendix for links to referenced state fact sheets). |
Finally, profiled states use their documents to strengthen internal processes to help state government address disparities in more strategic, streamlined, and comprehensive ways.
States Are Exploring Ways to Track Progress and Evaluate Impact
For several reasons, primarily limited funding and staffing, most of the states featured have not yet undertaken steps to evaluate the impact of their disparities reports; all are interested in doing so. Several of the featured states have taken steps to evaluate which programs have made progress in implementing initiatives to reduce disparities highlighted in documents, but evaluating progress for each individual measure is more difficult. States with more recent plans will need longer timeframes for evaluating results. In addition, since the causes of health disparities are varied and hard to disentangle, it is challenging to link improvement to specific interventions. However, featured states do have processes in place to track progress in reducing disparities (regardless of the causal factors):
Disparities Reports Are Not Yet Fully Integrated into Broader State Health Reform Initiatives
As previously noted, the Patient Protection and Affordable Care Act (ACA) includes provisions that could have a significant impact on health disparities. The ACA provisions will influence state activities, for instance, by strengthening data collection and reporting mechanisms in the Medicaid and Children’s Health Insurance Programs.
It is increasingly important for states to have a coordinated and streamlined approach to respond effectively to healthcare reform requirements and opportunities. Many states are developing interagency health reform coordinating bodies to facilitate planning and implementation of the ACA.53 Representation on these councils could provide an opportunity to ensure that states integrate efforts to reduce health disparities into their comprehensive plans.
Although all of the states profiled are considering opportunities to integrate their initiatives into healthcare reform agendas, only a few states indicated that their current documents are being used to inform broader healthcare reform efforts within their states. Many states indicated that they are awaiting further health reform developments, and that it is too early to determine how their disparities initiatives will inform their states’ healthcare reform agendas. Other states noted that ACA provides some leverage for the Federal OMH which may be beneficial, and that HIT initiatives that could help in reducing disparities are also supported by healthcare reform.
States Benefit from Sharing Strategies
Not every state with interesting or noteworthy activity in disparities reduction met the criteria for inclusion as a featured state in this report; however, particularly relevant or frequently mentioned state activity is useful to note. Every state profiled looked to other states when crafting their disparities documents. Connecticut, for example, considered Rhode Island’s data collection policy as a model in developing its own. Colorado looked to Rhode Island when working on its agency plan. Utah, in turn, has compared its reports to Colorado. Finally, New Jersey indicated that it has tried to model some of Maryland’s reports. Profiled states also referenced other states, specifically North Carolina, Massachusetts, Minnesota and Ohio. Additionally, NASHP identified noteworthy activity in California, Michigan, Virginia, and Arizona. Brief information about each of these states’ activities appears below or in Figure 8 (for North Carolina).
Figure 8: The North Carolina Experience
North Carolina was most frequently cited by the profiled states as a state with best practices to reduce health disparities. As a result, NASHP spoke with state officials to learn more about North Carolina’s experience documenting racial and ethnic health disparities to inform strategic action.
North Carolina published its first report on disparities in 1987. Since that time, the state has produced multiple reports including its Women’s Health Report Card and reports developed by its Healthy Carolinians group. Unlike many of the states profiled here, North Carolina does not have a single strategic plan, instead opting to use a combination of data profiles and a report card, with the latest iteration published in 2010.* As these various data profiles and report cards evolved, so did North Carolina’s cross-programmatic approach to addressing disparities. Like Rhode Island, North Carolina expects disparity reduction to be addressed by every program within the state health department. All programs are charged with setting goals, developing interventions, and measuring progress. The state Office of Minority Health (OMH) takes on a technical assistance role, working with programs within and outside of the health department (i.e., social services) that develop interventions to reduce health disparities among North Carolinians. Like the other states profiled, the North Carolina OMH understands the necessity for partnering with groups outside of the health department and state government in order to accomplish its objectives. Currently, North Carolina is working to finalize a reporting tool that will make performance measures consistent across various offices and divisions. Data North Carolina gets the majority of its data from the State Center for Health Statistics (BRFSS, discharge data, and Vital Statistics), the Census Center (demographic data), and other sources (disease information). The In addition to the data that the state already uses, North Carolina, like several of the states profiled, is in the process of attempting to look at the cost of disparities and to reframe the case for disparities reduction to focus on the economic burden of disparities. The state has published a report on the Medicaid cost of diabetes within the state. An article on this issue was published in the North Carolina Medical Journal.** In addition to cost of disparities, North Carolina would also like to include access data, as well as mental health and substance abuse data. Action North Carolina has taken several action steps based on the reports issued by the state OMH. In 2005, the State Assembly established a $3 million grant program for communities. The majority of the funds for these projects go directly to faith-based organizations, community based organizations and American Indian tribes, with a small percentage of the funds going through traditional public health agencies. North Carolina historically has invested in nontraditional partners and is working to expand those partnerships through leadership development and community engagement strategies. The legislation also identified six focus areas based on the greatest disparities in the state. Finally the legislation stipulated that the funding engage the African American, Native American, and Hispanic/Latino populations. The funds for these projects generally go through the traditional local health department agency. North Carolina now is trying to reach beyond health departments to work with non-traditional partners. The state enacted legislation in 2009 that requires hospitals to report self-reported race/ethnicity patient data.. This change took effect in January 2010. North Carolina hopes that this requirement will improve its disparities data. Sources: *Office of Minority Health and Health Disparities and State Center for Health Statistics, Racial and Ethnic Disparities in North Carolina: Report Card 2010. Available online: http://www.schs.state.nc.us/SCHS/pdf/MinRptCard_WEB_062210.pdf. **Paul A. Buescher, J. Timothy Whitmire, and Barbara Pullen Smith. "Medical Care Costs for Diabetes Associated With Health Disparities Among Adult Medicaid Enrollees in North Carolina," North Carolina Medical Journal 71 (4) (July/August 2010): 319-324. Available online: http://digital.ncdcr.gov/cdm/ref/collection/p249901coll22/id/24550. |
After reviewing featured states’ documents and talking with officials from each of these states, several themes and lessons emerged.
States take varied approaches to identifying, documenting, and acting on data related to racial and ethnic health and healthcare disparities. Nevertheless, they all emphasize the need for valid data to document disparities and collaboration for action planning to improve health equity. Whether through an action plan, data report (or report card), or a combination of these, all of these states have developed methods for reporting health disparities and have taken concrete steps toward reducing the disparities that exist within their borders.
Despite the work that these states are doing to improve health equity, the states recognize that there is more work to be done. States noted that disparities in health outcomes and access are very compelling issues, and it is important to inspire people to work together on the issue despite limited resources.
The successes, challenges, and methods of these states can provide guidance for states that are exploring ways to improve their health equity initiatives. Lessons learned by these states, such as the need for substantive stakeholder and community involvement, can also help states that are trying to improve. Opportunities for funding and increased awareness and attention to these issues, through provisions for reducing disparities in healthcare reform and the National Partnership for Action, may provide momentum for state action.
Below is a table featuring many of the disparities plans/reports that NASHP reviewed for each of the states profiled. All links were accurate as of December 2010.
1 Committee on Quality of Health Care in America, Institute of Medicine, Crossing the Quality Chasm: A New Health System for the 21st Century (Washington, DC: National Academies Press, 2001).
2 Committee on Quality of Health Care in America, Institute of Medicine, Crossing the Quality Chasm: A New Health System for the 21st Century (Washington, DC: National Academies Press, 2001), 6.
3 Ibid, 3-4.
4 Brian Smedley, Adrienne Stith, and Alan Nelson, eds., Unequal Treatment: Confronting Racial and Ethnic Disparities in Health Care (Washington, DC: National Academies Press, 2003).
5 National Healthcare Quality Report 2009 State Snapshots. https://www.ahrq.gov/research/data/state-snapshots/index.html
6 Agency for Healthcare Research and Quality. National Healthcare Disparities Report, 2009. Rockville, MD: March 2010. http://archive.ahrq.gov/research/findings/nhqrdr/nhqr09/nhqr09.pdf.
7 Ibid, 6.
8 LaVeist, T., Gaskin, D., and Richard, P. The Economic Burden of Health Inequalities in the United States. Washington, DC: Joint Center for Political and Economic Studies, September 2009. http://jointcenter.org/sites/default/files/Economic%20Burden%20of%20Health%20Inequalities%20Fact%20Sheet.pdf. ![]() Date accessed: December 16, 2010.
Date accessed: December 16, 2010.
9 For additional examples, including the work of non-governmental groups, see Hanlon, C. and Raetzman S. State Uses of Hospital Discharge Databases to Reduce Racial and Ethnic Disparities. Online October 14, 2010. U.S. Agency for Healthcare Research and Quality (AHRQ). Available: http://www.hcup-us.ahrq.gov/reports.jsp
10 Centers for Disease Control and Prevention, "Perspectives in Disease Prevention and Health Promotion Report of the Secretary's Task Force on Black and Minority Health," Morbidity and Mortality Weekly Report 35 (8) (February 28, 1986): 109-112. Available online: http://www.cdc.gov/mmwr/preview/mmwrhtml/00000688.htm.
11 "The National Plan for Action Draft as of February 17, 2010," United States Department of Health and Human Services, available online: http://minorityhealth.hhs.gov/npa/templates/browse.aspx?lvl=1&lvlID=31. Last modified February 17, 2010.
12 Public Law 111–148 http://www.gpo.gov/fdsys/pkg/PLAW-111publ148/pdf/PLAW-111publ148.pdf.
13 "Health Reform and Communities of Color: Implications for Racial and Ethnic Health Disparities," The Henry J. Kaiser Family Foundation, September 2010, 1. Available online: http://www.kff.org/healthreform/upload/8016-02.pdf. ![]() (Accessed September 27, 2010.)
(Accessed September 27, 2010.)
14 These ACA provisions complement other legislation, specifically the Health Information Technology for Economic and Clinical Health (HITECH) Act of the American Recovery and Reinvestment Act of 2009. HITECH contains a Meaningful Use Incentives Program administered by state Medicaid agencies; providers who can demonstrate the "meaningful use" of certified electronic health record technology receive incentive payments. Patient race, ethnicity, and preferred language are among the core elements of meaningful use. See Blumenthal, D. and M. Tavenner. "The ‘Meaningful Use’ Regulation for Electronic Health Records," The New England Journal of Medicine, 13 July 2010. http://www.nejm.org/doi/full/10.1056/NEJMp1006114 ![]() (Accessed November 8, 2010).
(Accessed November 8, 2010).
15 Andrulis et al., Patient Protection and Affordable Care Act of 2010, 2.
16 "Health Reform and Communities of Color," Kaiser, 2.
17 Dennis P. Andrulis et al., Patient Protection and Affordable Care Act of 2010: Advancing Health Equity for Racially and Ethnically Diverse Populations, (Washington, DC: Joint Center for Political and Economic Studies, July 2010). (Accessed October 21, 2010.) http://jointcenter.org/sites/default/files/Patient%20Protection%20and%20Affordable%20Care%20Act.pdf. ![]()
18 Ibid, 18.
19 National Conference of State Legislatures. "State Profiles: Minority Health and Health Equity Offices." September 2010. (Accessed October 21, 2010.) http://www.ncsl.org/?tabid=14299. ![]()
20 Hanlon, C. and Raetzman S. State Uses of Hospital Discharge Databases to Reduce Racial and Ethnic Disparities. Online October 14, 2010. U.S. Agency for Healthcare Research and Quality (AHRQ). Available: http://www.hcup-us.ahrq.gov/reports.jsp.
21 Love D. Case Studies of Uses of Data on Patient Race/Ethnicity from Statewide Hospital Discharge Databases. Agency for Healthcare Research and Quality, Healthcare Cost and Utilization Project, 2005. Contract # 290-00-004. Rockville, MD.
22 "Overview of HCUP," Agency for Healthcare Quality and Research. (Accessed October 21, 2010.) http://www.hcup-us.ahrq.gov/overview.jsp.
23 Hanlon, C. and Raetzman S. State Uses of Hospital Discharge Databases to Reduce Racial and Ethnic Disparities. Online October 14, 2010. U.S. Agency for Healthcare Research and Quality (AHRQ). Available: http://www.hcup-us.ahrq.gov/reports.jsp.
24 See, for example: Smedley, B. Moving Toward Health Equity in New York: State Strategies to Eliminate Health Disparities. A Report for the Minority Health Council, New York State Department of Health. 2009. (Accessed October 21, 2010.) http://hcfany.files.wordpress.com/2009/01/microsoft-word-final-and-distributed-version-of-white-paper-_3_.pdf ![]() ; and ASTHO State Health Equity Snapshot Map. (Accessed October 21, 2010.) http://astho.org/Programs/Health-Equity/State-Snapshots-Map/State-Snapshots/.
; and ASTHO State Health Equity Snapshot Map. (Accessed October 21, 2010.) http://astho.org/Programs/Health-Equity/State-Snapshots-Map/State-Snapshots/. ![]()
25 AHRQ explicitly expressed interest in states that focus not only on health disparities (i.e., disparities in health status) but also on healthcare disparities (i.e., disparities in care).
26 New Mexico Department of Health, Racial and Ethnic Health Disparities Report Card. Santa Fe, NM: 2010. Available online: http://hospitals.unm.edu/dei/documents/nm_doh_2010_racial_ethnic_disparities.pdf. ![]()
27 Rhode Island Department of Health, Minority Health Plan for Action, Providence, RI: 2004. Available online: http://www.health.ri.gov/publications/actionplans/2004MinorityHealth.pdf. ![]()
28 Alison Stratton, Margaret Hynes, and Ava Nepaul. The 2009 Connecticut Health Disparities Report, Hartford, CT: Connecticut Department of Public Health, 2009. Available online: http://www.ct.gov/dph/lib/dph/hisr/pdf/2009ct_healthdisparitiesreport.pdf. ![]()
29 New Jersey Department of Health & Senior Services, Office of Minority and Multicultural Health. Strategic Plan to Eliminate Health Disparities in New Jersey Update & Addendum Trenton, NJ: 2010. Available online: http://s3.amazonaws.com/zanran_storage/liberty.state.nj.us/ContentPages/1028094015.pdf. ![]()
30 Center for Multicultural Health, Health Status by Race and Ethnicity: 2010. Salt Lake City, UT: Utah Department of Health, 2010. Available online: http://health.utah.gov/disparities/data/race-ethnicity-report/healthstatus.pdf. ![]()
31 Center for Multicultural Health, Action Plan to Eliminate Racial/Ethnic Health Disparities in the State of Utah. Salt Lake City, UT: Utah Department of Health, 2008. Available online: http://health.utah.gov/disparities/data/ohd/OHDSTRATEGICPLAN2013.15.pdf. ![]()
32 Cheryl Ulmer, Bernadette McFadden, and David R. Nerenz. Race, Ethnicity and Language Data: Standardization for Health Care Quality Improvement. Subcommittee on Standardized Collection of Race/Ethnicity Data for Healthcare Quality Improvement, Institute of Medicine. In Andrulis et al., Patient Protection and Affordable Care Act of 2010, 2.
33 "About the BRFSS," Centers for Disease Control and Prevention. (Accessed October 21, 2010.) http://www.cdc.gov/brfss/about/about_brfss.htm
34 Ibid.
35 All population data courtesy of the United States Census 2009 population estimate. (Accessed August 6, 2010.) https://www.census.gov/quickfacts/table/PST045216/00.
36 Ibid.
37 Sam Harper and John Lynch. Methods for Measuring Cancer Disparities: Using Data Relevant to Healthy People 2010 Cancer-Related Objectives. National Cancer Institute Surveillance Monograph Series, Number 6. NIH Publication No. 05-5777. Bethesda, MD (2005): 21. (Accessed October 21, 2010.) http://seer.cancer.gov/publications/disparities/. ![]()
38 Ibid., 22.
39 Debbie Hall et al., Health Disparities Report 2008: A County-Level Look at Health Outcomes for Minorities in Georgia, Georgia Department of Community Health’s Office of Health Improvement and the Minority Health Council, 2008, 26.
40 David Mann, Toyin Fatogun, and Carlessia Hussein. Maryland Chartbook of Minority Health and Minority Health Disparities Data: With Sections on Sex-specific Health and Jurisdiction-specific Health, Maryland Office of Minority Health and Health Disparities, Maryland Department of Health and Mental Hygiene, December 2009, 34. Available online: http://dhmh.maryland.gov/mhhd/Documents/Chartbook_2nd_Ed_Final_2010_04_28.pdf. ![]()
41 Stratton, Hynes, and Nepaul. The 2009 Connecticut Health Disparities Report, 172.
42 Ibid., 173.
43 Ibid., 144.
44 Stratton, Hynes, and Nepaul. The 2009 Connecticut Health Disparities Report, 120.
45 Mauricio Palacio et al., Racial and Ethnic Health Disparities in Colorado 2009, Office of Health Disparities, Colorado Department of Public Health and Environment, 2009, 2. Available online: http://www.cdphe.state.co.us/ohd/ethnicdisparitiesreport/HD%202009%20LowRes.pdf. ![]()
46 Georgia Department of Community Health, Georgia Health Equity Initiative Health Disparities Report 2008: A County-Level Look at Health Outcomes for Minorities in Georgia (Georgia Department of Community Health, Atlanta) 2008, 30.
47 Colorado’s 21 regions are aggregations of counties defined by the Health Statistics Section in partnership with state and local public health professionals. The regions were created using statistical and demographic criteria. More information on the 21 regions is available by contacting the Health Statistics Section, CDPHE.
48 Debbie Hall et al., Georgia Health Disparities Report 2008, 12.
49 For example, see New Mexico Department of Health, American Indian Health Disparities In New Mexico From The 2010 Racial and Ethnic Health Disparities Report Card. Available online at: http://cdm16256.contentdm.oclc.org/cdm/singleitem/collection/p267801coll5/id/3869/rec/19. ![]()
50 Additionally, the Connecticut Multicultural Health Partners Language Services Committee conducted a survey about language access services with the local health departments and community health centers in the state. Findings from the survey were published as a separate report ("Language Access Services Project") available online at http://www.ct.gov/dph/lib/dph/multicultural_health/cmph_lang_prof_project.pdf. ![]()
51 New Jersey Department of Health & Senior Services’ Office of Minority and Multicultural Health and Rutgers University Center for State Health Policy. 2009 Health Disparities Initiatives Self-Assessment Survey Report, June 2010. https://www.pdffiller.com/16709523--2009-Health-Disparities-Initiatives-Self-Assessment-Survey-Report-. ![]()
52 Utah Department of Health, Center for Multicultural Health. Moving Forward in 2010: Progress Toward Health Equity by Race and Ethnicity in Utah. Available online: http://www.health.utah.gov/disparities/data/race-ethnicity-report/MovingForwardAA2016.pdf. ![]()
53 National Academy for State Health Policy, State Refor(u)m, www.statereforum.org ![]() , (Accessed September 28, 2010.)
, (Accessed September 28, 2010.)
54 For more information about Arizona's Health Disparities work, please visit the Arizona Health Disparities Center online at: http://www.azdhs.gov/hsd/health-disparities/. ![]()
55 For more information about California’s Health Disparities work, please visit the California Office of Multicultural Health online at: https://minorityhealth.hhs.gov/omh/browse.aspx?lvl=1&lvlid=1. ![]()
56 See "California Health Interview Survey." www.chis.ucla.edu/. ![]()
57 For more information see Making CLAS Happen: Six Areas for Action, Massachusetts Department of Health, Office of Health Equity, June 2009. Available online: http://www.mass.gov/eohhs/gov/departments/dph/programs/admin/health-equity/clas/making-clas-happen.html. ![]()
58 For more information see 2008 Health Disparities Report: Color Me Healthy, Michigan Department of Community Health, February 2009. Available online: http://www.michigan.gov/documents/mdch/2008_Health_Disparities_Report_MDCH_2.16.09_271335_7.pdf. ![]()
59 For more information see Anne M. Snowden et al., 2009 Health Care Disparities Report for Minnesota Health Care Programs: Comparing Medical Group Performance for Public and Private Purchasers Using Health Plan Data, Minnesota Department of Human Services, 2009. Available online: http://archive.leg.state.mn.us/docs/2012/mandated/120442.pdf. ![]()
60 For more information see Janelle Edwards et al., Addressing Disparities in Ohio’s Priority Populations, Ohio Department of Health, 2007. Available online: http://www.healthy.ohio.gov/hdsp/~/media/3F3D005A28F04026B058E293C22CBD0A.ashx . ![]()
61 Unequal Health Access Across the Commonwealth: A Snapshot. Available online: http://www.vdh.state.va.us/healthpolicy/documents/health-equity-report-08.pdf. ![]()
62 To review and download the Video and Video Transcript of the Virginia Department of Health's 2008 Health Equity, please visit: http://www.vdh.state.va.us/healthpolicy/2008report.htm. ![]()