TABLE OF CONTENTS
HIGHLIGHTS
INTRODUCTION
HCUP PARTNERS
1. OVERVIEW
2. DIAGNOSES
3. PROCEDURES
4. COSTS
5. MHSA
SOURCES/METHODS
DEFINITIONS
FOR MORE INFO
ACKNOWLEDGMENTS
CITATION
FACTS & FIGURES 2008 PDF
|
EXHIBIT 4.1 Cost by Principal Diagnosis (PDF)
Aggregate Costs by Principal Diagnosis, 1997, 2002, and 2008
| PRINCIPAL CCS DIAGNOSIS |
TOTAL INFLATION-ADJUSTED† HOSPITAL COSTS IN BILLIONS: 2008 DOLLARS |
PERCENT OF TOTAL COSTS |
AVERAGE ANNUAL GROWTH |
| 1997 |
2002 |
2008 |
1997 |
2002 |
2008 |
1997-2008 |
| All diagnoses |
$227.2 |
$305.7 |
$364.7 |
100.0% |
100.0% |
100.0% |
4.4% |
| Septicemia |
4.2 |
5.1 |
14.6 |
1.9 |
1.7 |
4.0 |
11.9 |
| Coronary atherosclerosis |
15.2 |
17.0‡ |
14.5 |
6.7 |
5.6 |
4.0 |
-0.4 |
| Osteoarthritis |
4.9 |
7.4 |
13.5 |
2.1 |
2.4 |
3.7 |
9.7 |
| Acute myocardial infarction |
9.5 |
12.5 |
11.6‡ |
4.2 |
4.1 |
3.2 |
1.9 |
| Liveborn infant |
8.2 |
10.1 |
11.5 |
3.6 |
3.3 |
3.1 |
3.1 |
| Complication of device, implant or graft |
5.7 |
8.4 |
11.5 |
2.5 |
2.8 |
3.1 |
6.5 |
| Congestive heart failure |
6.9 |
9.9 |
10.7‡ |
3.0 |
3.2 |
2.9 |
4.1 |
| Pneumonia |
9.2 |
11.2 |
10.5‡ |
4.1 |
3.7 |
2.9 |
1.1 |
| Spondylosis, intervertebral disc disorders, and other back problems |
3.6 |
6.2 |
9.5 |
1.6 |
2.0 |
2.6 |
9.4 |
| Respiratory failure |
3.4 |
4.7 |
9.1 |
1.5 |
1.5 |
2.5 |
9.3 |
| Acute cerebrovascular disease |
5.6 |
6.4 |
7.6 |
2.5 |
2.1 |
2.1 |
2.8 |
| Cardiac dysrhythmias |
3.7 |
6.6 |
7.4 |
1.6 |
2.2 |
2.0 |
6.6 |
| Complication of surgical procedures or medical care |
3.0 |
4.5 |
6.1 |
1.3 |
1.5 |
1.7 |
6.7 |
| Chronic obstructive pulmonary disease and bronchiectasis |
3.4 |
4.5 |
5.4 |
1.5 |
1.5 |
1.5 |
4.1 |
| Rehabilitation care, fitting of prostheses, and adjustment of devices |
3.9 |
5.1 |
4.9‡ |
1.7 |
1.7 |
1.3 |
2.2 |
| Biliary tract disease |
3.4 |
4.5 |
4.9 |
1.5 |
1.5 |
1.3 |
3.2 |
| Diabetes mellitus with complications |
2.8 |
4.0 |
4.6 |
1.3 |
1.3 |
1.3 |
4.4 |
| Fracture of neck of femur (hip) |
3.3 |
3.8 |
4.5 |
1.5 |
1.3 |
1.2 |
2.9 |
| Acute renal failure |
1.0 |
1.8 |
4.3 |
0.4 |
0.6 |
1.2 |
14.2 |
| Mood disorders |
3.2 |
4.3 |
4.2‡ |
1.4 |
1.4 |
1.1 |
2.4 |
† Adjusted for inflation using the GDP deflator (http://www.bea.gov/national/nipaweb/SelectTable.asp, Table 1.1.4. Price Indexes for Gross Domestic Product).
‡ Costs are not statistically different from previously reported year shown on table at p‹0.05.
Note: Aggregate costs for residual codes and those not elsewhere classified are not shown here. As a result, aggregate costs for all body systems may be larger than the sum of the component parts.
Source: AHRQ, Center for Delivery, Organization, and Markets, Healthcare Cost and Utilization Project, Nationwide Inpatient Sample, 1997, 2002, and 2008. |
Inflation-adjusted aggregate costs for community hospital stays rose from $227.2 billion in 1997 to $364.7 billion in 2008.
- The top three conditions with the highest aggregate costs—septicemia, coronary atherosclerosis, and osteoarthritis —accounted for more than 11 percent of all hospital costs in 2008.
- Five of the twenty most expensive conditions were cardiovascular: coronary atherosclerosis, acute myocardial infarction, congestive heart failure, acute cerebrovascular disease, and cardiac dysrhythmias.
- With the exception of costs of stays for cardiac dysrhythmias, the costs for these cardiovascular diagnoses grew at a slower pace than total hospital costs between 1997 and 2008.
- Three of the twenty most expensive conditions were musculoskeletal: osteoarthritis, spondylosis, intervertebral disc disorders, and other back problems, and fracture of neck of femur (hip).
- Costs for osteoarthritis and spondylosis grew at more than twice the pace of total hospital costs between 1997 and 2008.
- Between 1997 and 2008, costs for acute renal failure, septicemia, and respiratory failure grew at two to three times the rate of total hospital costs. Costs for pneumonia, acute myocardial infarction, rehabilitation care, fitting of prostheses, and adjustment of devices, and mood disorders grew at a slower pace than overall costs. Costs for coronary atherosclerosis stabilized between 1997 and 2008.
(text version)
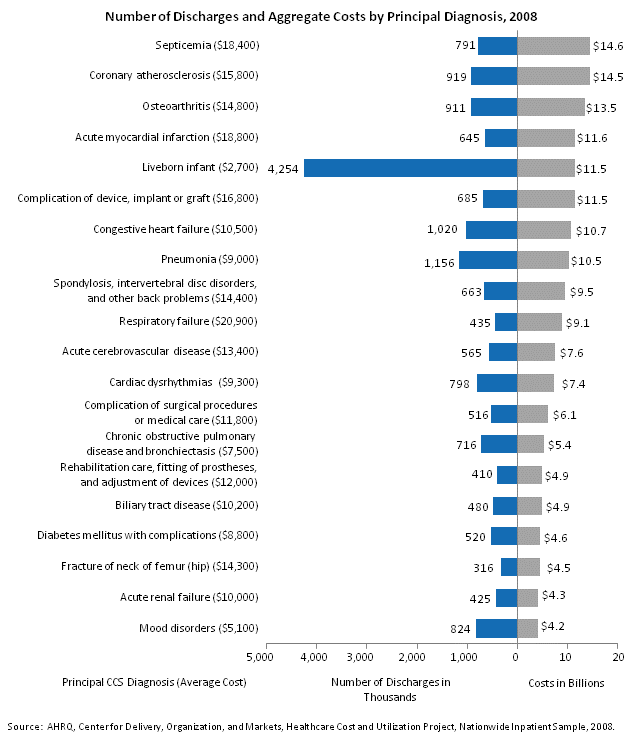
- Hospital stays for septicemia cost a total of $14.6 billion and accounted for 791,000 discharges. The average cost per discharge was $18,400, about twice as much as the average cost for all discharges.
- The greatest number of discharges was for liveborn infants (4.3 million). These stays were responsible for $11.5 billion in hospital costs; each stay cost an average of $2,700.
- Mood disorders cost $4.2 billion and accounted for 824,000 discharges. This diagnosis had the lowest average cost per stay ($5,100) after liveborn infants.
Previous Next
|
