TABLE OF CONTENTS
HIGHLIGHTS
INTRODUCTION
HCUP PARTNERS
1. OVERVIEW
2. DIAGNOSES
3. PROCEDURES
4. COSTS
5. MHSA
SOURCES/METHODS
DEFINITIONS
FOR MORE INFO
ACKNOWLEDGMENTS
CITATION
FACTS & FIGURES 2008 PDF
|
EXHIBIT 1.6 Patient Age (PDF)
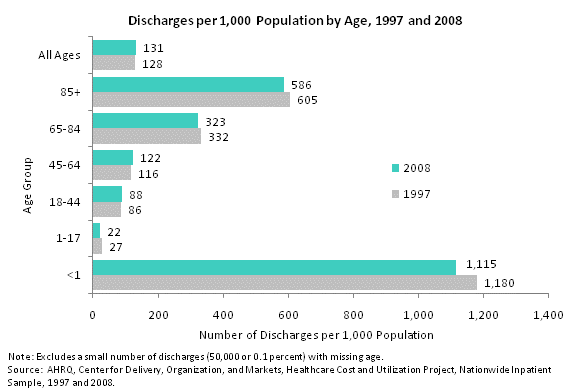
Discharges per 1,000 population by age, 1997 and 2008. Bar chart. Number of discharges per 1,000 population. 1997. Less than 1: 1,180; 1 to 17: 27; 18 to 44: 86; 45 to 64: 116; 65 to 84: 332; 85 and over: 605; all ages: 128. 2008. Less than 1: 1,115; 1 to 17: 22; 18 to 44: 88; 45 to 64: 122; 65 to 84: 323; 85 and over: 586; all ages: 131. Note: Excludes a small number of discharges (50,000 or 0.1%) with missing age.
Discharges per 1,000 population by age group show that persons of older age had a greater chance of hospitalization in both 1997 and 2008.
- Across all age groups, there were 131 discharges for every 1,000 persons in the United States in 2008, little changed from the rate of 128 discharges in 1997.
- There were fewer than 30 hospital stays for every 1,000 children 1-17 years old in 1997 and 2008.
- For adults 85 and older, there were 605 and 586 stays per 1,000 persons in 1997 and 2008, respectively.
- While older age was generally associated with higher hospitalization rates, infants younger than 1 year of age experienced the highest rates of hospitalization: 1,180 hospitalizations per 1,000 infants in 1997 and 1,115 hospitalizations per 1,000 infants in 2008. These high rates of hospital stays occur because nearly all births happen in the hospital and some infants require additional hospitalization in the first year of life.
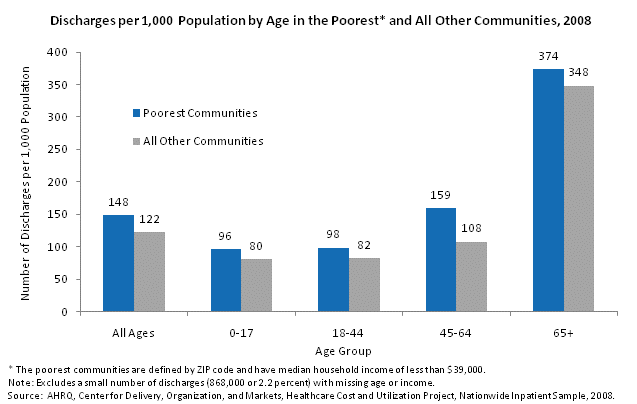
Discharges per 1,000 population by age in the poorest and all other communities, 2008. Column chart. Number of discharges per 1,000 population. Poorest communities. All ages: 148; 0 to 17: 96; 18 to 44: 98; 45 to 64: 159; 65 and over: 374. All other communities. All ages: 122; 0 to 17: 80; 18 to 44: 82; 45 to 64: 108; 65 and over: 348. Note: The poorest communities are defined by ZIP code and have median household income of less than $39,000. Note: Excludes a small number of discharges (868,000 or 2.2%) with missing age or income.
- Persons residing in the poorest communities had a 21-percent higher rate of hospitalization in 2008 (148 discharges per 1,000 population) than those residing in all other communities (122 discharges per 1,000 population).
- The rate of hospitalization for children 0-17 and adults 18-44 in the lowest income communities (96 and 98 discharges per 1,000 population) compared to all other communities (80 and 82 discharges per 1,000 population) was about 19 percent higher.
- The discharge rate for adults 45-64 was 48 percent higher in the poorest than in all other communities (159 discharges per 1,000 population in the poorest communities compared to 108 discharges per 1,000 population in all other communities).
- Community income level had the least impact on the hospitalization rate of patients 65 years and older, with the poorest communities experiencing similar hospitalization rates to all other communities (374 discharges per 1,000 population in the poorest communities compared to 348 discharges per 1,000 population in wealthier communities).
>
Previous Next
|
